 Open Access Article
Dynamic spectrum extraction method based on independent component analysis combined dual-tree complex wavelet transform
Yao Pengab,
Gang Liab,
Mei Zhouc,
Huaile Wangab and
Ling Lin*ab
aState Key Laboratory of Precision Measurement Technology and Instruments, Tianjin University, Tianjin 300072, China. E-mail: linling@tju.edu.cn
bTianjin Key Laboratory of Biomedical Detecting Techniques & Instruments, Tianjin University, Tianjin 300072, China
cShanghai Key Laboratory of Multidimensional Information Processing, East China Normal University, Shanghai 200241, China
First published on 13th February 2017
Abstract
Dynamic spectrum (DS) has major significance in the non-invasive measurement of blood components. Effective dynamic spectrum extraction methods can enhance the signal to noise ratio (SNR) of dynamic spectrum data and improve the non-invasive measurement accuracy. According to the principle of DS and the characteristics of the photoplethysmogram (PPG), in this paper, a new dynamic spectrum extraction method based on independent component analysis (ICA) combined with dual-tree complex wavelet transform (DTCWT) is proposed. The core of this method is to find out the closest ratio between each PPG signal at one wavelength and the template signal of PPGs which represents original blood pulsating information best as DS data. In order to testify the effectiveness of the new proposed method, experiments for the determination of hemoglobin concentration of 151 volunteers based on three different kinds of DS extraction methods coupled with partial least squares (PLS) were conducted respectively, where the root mean square error of the calibration (RMSEC), root mean square error of prediction (RMSEP), correlation coefficient of calibration (Rc) and correlation coefficient of prediction (Rp) were used as the evaluation index of the prediction performance. Compared with the other two famous DS extraction methods, frequency domain analysis and single trial estimation, ICA combined DTCWT showed better prediction ability. The forecast accuracy of the new method ICA combined DTCWT reached 90.62%, while commonly used frequency domain analysis and single trial estimation was 63.71% and 78.83%, respectively. The results show comprehensively that the dynamic spectrum extraction method based on ICA combined DTCWT is more reliable and accurate, which opens up avenues for the non-invasive study of the dynamic spectrum.
Introduction
Chemical composition analysis based on a spectroscopy method has wide applications in agriculture,1 food industry,2 and medicine.3,4 Among these, the non-invasive measurement of blood components based on a spectrum is one of the frontiers,5–7 especially for the measurement of the hemoglobin concentration.8–12 Optical methods mainly include bright sound spectroscopy, Raman spectroscopy, fluorescence and near infrared (NIR) spectroscopy. Optical detection methods have been the most promising detection means for their non-invasive characteristics and high speed. The most representative NIR spectroscopy has been a hot spot for lots of scholars to explore and research in recent years as it can obtain required results with high precision and low cost in principle.NIR spectroscopy is a non-invasive optical technique to monitor tissue oxygenation. It is currently used for the detection of blood glucose, blood oxygen, and hemoglobin concentration detection. However, the individual discrepancy and measuring condition can affect the measured spectrum, which will significantly affect the accuracy of hemoglobin concentration. Jeon13 proposed to establish the calibration model by the measured data to analyze hemoglobin concentration in 2002. Xingdan Chen14 proposed an effective signal extraction method based on subtraction of blood volume difference to obtain the effective spectral information which directly reflected the blood components. Gang Li15,16 proposed dynamic spectrum (DS) theory which extracted the absorption spectrum from pulse oximeter's photoplethysmogram (PPG) signals. The absorbance reflected the changes in blood information. Using the absorbance for modeling could eliminate individual differences of the measured subjects and the influence of measuring conditions more effectively. Compared with the two traditional theories, DS can obtain more accurate data. DS theory studies on the relationship between spectral changes and the PPG signals, and then predicts the concentration of the blood components by modeling. It has achieved a series of results on spectrum extraction, signal acquisition and clinical trials, etc.17
DS demands spectral data of high quality, thus it requires the measurement accuracy of spectral data to be as high as possible. Frequency domain analysis18 and single trial estimation19 are two famous extraction methods for DS currently. Frequency domain analysis extracts the amplitude of fundamental of the logarithmic PPG by Fast Fourier Transform (FFT), but its accuracy is low because the PPG is not a single-frequency signal. As we all know, if a signal has a certain level of total energy, the wider the frequency spectrum width, the weaker the amplitude of fundamental. Single trial estimation has a strong anti-noise ability due to the elimination of abnormal data and the error correction by line-fitting. It is possible to increase the SNR of the original PPG signal by eliminating the anomalous periods, at the same time, it is possible to improve the SNR of DS at each wavelength by averaging the DS data of each period. However, the disadvantage of this method is that the implementation process is more cumbersome for a large number of data samples, and this method still has not achieved the desired results. In addition, Butterworth filter is the main PPG signals pre-processing method for both frequency domain analysis and single trial estimation, but it is very easy to cause distortion due to the long transition zone.
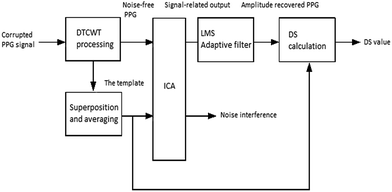
In connection with time and frequency domain characteristics of PPG signals, this paper proposes a new DS extraction method by combining ICA and DTCWT. It integrates blind source separation of ICA and denoising characteristics of DTCWT to improve the accuracy of blood component measurement by DS. Firstly, pre-process the PPG signals by DTCWT aimed at removing the noise interference. Secondly, calculate the template signal using the processed PPG signals. Then put the template and the PPG signal at each wavelength to do ICA processing, resulting in the signal which mostly approximates the clean signal distribution of the arterial blood volume changes. At last, figure out the closest ratio k between each generated PPG signal at each wavelength and the template signal as DS data. All proportions constitute new DS data. The processed PPG signals result using the new method showed more desirable effects. And the extracted DS can reflect accurate absorbance changes information more effectively. Furthermore, for modeling prediction of hemoglobin concentration, the forecast results of ICA combined DTCWT reached the highest accuracy compared with the frequency domain analysis and single trial estimation.
Theory and analysis
Dynamic spectrum
Dynamic spectrum is a spectral method for the non-invasive measurement of arterial blood components based on the generation principle of pulse waves. The theoretical basis of this approach is modified Lambert–Beer's law (MLBL).20 By using the absorbance changes during cardiac diastole and heart contraction, individual differences created by skin tissue and muscle tissue will be eliminated. As shown in Fig. 1. Supposing there is a light beam irradiating vertically down, which transmits through the tissues of fingertips (from the nail to the finger pad). In each cardiac cycle, the heart pumps blood to the periphery. When the artery filling reaches a minimum state, incident light from the light source is not subjected to fluctuations of arterial blood. The output intensity will be the strongest at this time (referred as Imax), which can be regarded as the incident light Io of pulsating artery blood; when the artery filling meets the highest state, it means pulsating artery blood has reached the strongest effect. The output intensity will be the weakest at this time (referred as Imin) and it can be regarded as the minimum output intensity of pulsating artery blood. Therefore, by recording the absorbance value of both the maximum value as diastole and the minimum value as heart contracts, the effect of absorbance created by skin tissue and subcutaneous tissue will be eliminated, so as to the effect of lighting and detector response curve. According to MLBL, the formula for pulsating blood layer absorbance is:| ODi = (∑aiC)Bd + G | (1) |
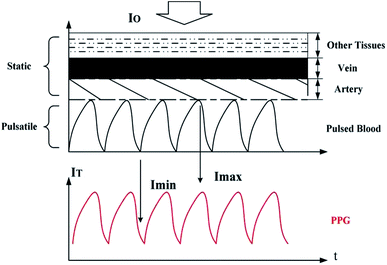 | ||
| Fig. 1 The generation of the PPG and a simplified model of tissue. PPG is a simple optical method to detect blood volume changes in the microvascular bed of tissue.21 The PPG waveform consists of two parts: AC (pulsatile) and DC (baseline), so the tissue can be regarded as a combination of a pulsatile part and a “static” part. | ||
ODi is the absorbance during one cardiac cycle corresponding to the wavelength i. G is the loss caused by the background, B is the factor of path and ai represents specific extinction coefficient of different wavelengths. Then the changes of the absorbance at wavelength i is:
 | (2) |
In formula (2), Ioi is the intensity of the incident light. Iimax is the maximum output intensity while Iimin is the minimum output intensity. By extracting the alternating component of the logarithmic PPG (PPG signal after logarithmic transformation), the light absorption information of arterial pulsatile blood can be obtained. Δd is the path length of pulsating blood layer. i represents the mark of multiple wavelengths. The pulsating blood layer is very thin and light scattering effects can be ignored, so BΔd can be normalized to 1. Therefore, the concentration of the substance in the blood C can be determined by the modeling method.
ICA principle and theoretical analysis
In the early 90s of the 20th century, the basic theoretical framework of Independent Component Analysis (ICA) was provided by Comon22 and then used in a wide range of studies such as biomedical signal processing, voice signal separation, data analysis and so on. It is a new signal processing technology for blind source separation problem, and it is an analytical method based on high order statistics.23,24 According to the principles of statistical independence, ICA can separate the components as independent as possible from the linear mixed-signal formed by a plurality of signals without any prior knowledge of the subject. Assuming m numbers of observed signals have been detected by related instrument, as X(t) = [x1(t), x2(t),⋯, xm(t)]T, which is formed by n kinds of independent sources S(t) = [s1(t), s2(t),⋯, sn(t)]T by the linear combination from some position, here m ≥ n. Assuming m = n, A = (ai,j)(1 ≤ i, j ≤ n) can represent the unknown linear combinations. Therefore, ICA's classic model can be represented in the form of a vector matrix:| X(t) = AS(t) | (3) |
Or expressed as a matrix form:
 | (4) |
Only observed signals X(t) is known in the information above. The role of ICA algorithm is used to evaluate mixed matrix A and independent source signals S(t) according to the observed signal, and the estimated value of source signals Y(t) can be solved by following formula:
| Y(t) = WTX(t) | (5) |
Formula (5) is the solving model of ICA. W = [w1, w2,⋯, wn] in formula is the inverse matrix of mixed matrix A, and it is called separating matrix or unmixing matrix.
The basic idea of ICA model solution method is using some kind of objective function and optimization algorithm to measure the independence of separate random variables. According to the central limit theorem, the measurement of dependence degree among random signals can be done by non-Gaussianity measurement. At present, negentropy25 and kurtosis are used to measure non-Gaussianity of random variables. Considering better stability of negative entropy and large amounts of PPG signals, FastICA algorithm26 whose objective function is negative entropy has been selected to achieve PPG signals separation in this study.
ICA is a statistical method and it only separate signal having the greatest statistical independence to approximate the source signal waveform. It is noteworthy that compared with source signal, separation signal exists inconsistencies of magnitude and order. For inconsistencies of order, signals can be determined by spectral analysis correspondingly and it will not affect the overall results. But the amplitude of PPG signal reflects the important pulse information, so amplitude recovery is a more critical issue. In this respect, the amplitude of the signal was recovered by using adaptive filter, and for simplicity, the Least Mean Square (LMS)27 algorithm was selected:
| y(n) = wT(n)u(n) | (6) |
| e(n) = d(n) − y(n) | (7) |
| w(n + 1) = w(n) + μe(n)u(n) | (8) |
Among them, u(n) represents filter input, d(n) represents the desired signal, w(n) is filter weight, e(n) shows error reduction through adaptive filter and μ represents the steps for weighting vector updating.
DTCWT for signal processing
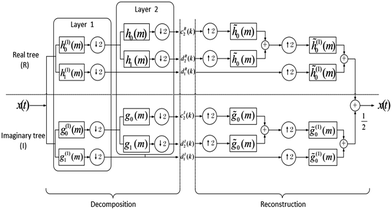
Dual-tree complex wavelet transform (DTCWT) was proposed by Kinsbury.28 It is a very effective method for extracting required information from the corrupted data, and it has been used in a wide range of applications. DTCWT is implemented as simple block processing means29 based on shift invariant transform with a limited redundancy. It is an improved complex wavelet transform with two parallel discrete wavelet transforms (DWT), low-pass and high-pass filters which could overcome the drawbacks of the two extraction of DWT. One of them is a real tree, the other is an imaginary tree, and wherefore perfect reconstruction condition can be achieved. The decomposition and reconstruction block diagram is shown as Fig. 2.In Fig. 2, h0(m), h1(m) represents low-pass and high-pass filter pair for the first-layer decomposition of real tree of signal x(t), respectively. g0(m), g1(m) represents low-pass and high-pass filter pair for the first-layer decomposition of imaginary tree of signal x(t), respectively. There is one sample interval delay between real tree and imaginary tree at the first layer of decomposition, so the data extracted from real tree is what imaginary tree has not extracted, that is to say they could form complementary relationships. For the decomposition of following layer, the sum of the delay difference generated by two trees in the layer and all the previous layers is a sampling period relative to the original input. The phase-frequency response of the two-tree filter should have a group delay of half a sampling period, and the amplitude-frequency response of the two-tree filter is equal. In this case the loss of information can be effectively reduced. Therefore DTCWT has the approximate translation in-variance and could reduce the effect of translation disturbances of the signal.
Due to maximum a posteriori (MAP) estimation algorithm has the advantage of being able to optimize the loss function, MAP was adopted in this paper to determine the threshold for DTCWT high frequency coefficients processing. Morphology open operation or closed operation is a compound operation combined expansion with corrosion operation. Maragos constructed morphological open-close (OC) and morphological closed-open (CO) filters.30 A combinatorial filter by averaging the morphological open-closing filter and the morphological close-opening filter was used for DTCWT low frequency coefficients processing in this research. In morphology, structural elements play the role of the filter window, and the shape of it has a great impact on the filter effect. The shape of structural elements like circular, triangular, linear, parabolic, and sinusoidal and other polygons have been widely used. In different shapes of structural elements, the parabolic structure elements can effectively suppress the impulse noise. Disc-type structural elements have rotational invariance and high smoothness. Thus these two structural elements were selected to design a generalized morphological filter in this paper. Therefore, averaging the morphological open-closing filter and the morphological close-opening filter with structural elements were combined to eliminate low frequency interference. The algorithm is as follows, where f is the input signal, g1, g2 represents different structural elements, respectively. The symbol ○ and ● denotes the open and closing operations, respectively.
| GOC(f(n)) = f○g1●g2 | (9) |
| GCO(f(n)) = f●g1○g2 | (10) |
The output of the filter is:
| y(n) = [GOC(f(n)) + GCO(f(n))]/2 | (11) |
DS extraction method based on ICA combined DTCWT
PPG signal at each wavelength has similarity, by combining the denoising advantages of DTCWT and blind source separation of ICA, the main steps of the new method are that DTCWT is used to pre-process PPG signals at all wavelengths firstly, and the template signal is obtained by superimposing and averaging the PPG signals at all wavelengths. The template signal is regarded as a standard signal, then ICA is used to separate PPG signal at each wavelength in the blind source, and the spectral signal at each wavelength closest to the template signal is obtained. For each wavelength, the ratios between the processed PPG at each signal points and the template signal are calculated, the ratio which minimized the output of formula (12) is selected eventually as the DS data. All of the DS data at all wavelengths constitute the DS data vector. The advantages of this new method are that ICA is able to obtain data which is closer to the original acquisition signal from the perspective of the signal source; no extra information filtering is required during the extraction process. Besides, DTCWT is more effective for denoising. And the results can reflect more accurate and original information, in order to further improve the accuracy of DS data.The proposed block processing for the objective considered here can be explained using the flow chart represented in Fig. 3.
The specific steps of DS extraction method ICA combined DTCWT are as follows.
| min|PPGs − kPPGI| = 0 | (12) |
Materials and methods
In order to verify the new DS extraction method, actual non-invasive measurement experiment of hemoglobin concentration was conducted.Spectral data acquiring system
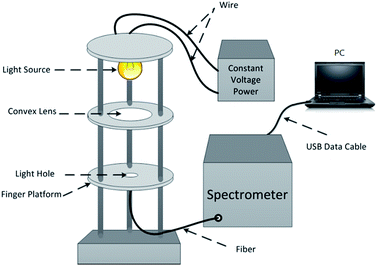
The spectral data acquiring system consisted of four major components – a test bench with a light source and optical collimators and an optical fiber bundle, a constant voltage power supply, a spectrometer, and a PC. Entire measuring device platform is shown in Fig. 4. The broadband light source was a tungsten halogen lamp and a stabilized DC power source supplied power to it. A collimated light beam made by lenses and diaphragms fell on the fingertip and the transmitted light was piped to the spectrometer through the optical fiber bundle which contained several fibers with a numerical aperture (NA) of 0.22. The spectrometer is of high sensitivity and low noise (AvaSpec-HS 1024x58TEC-USB2, manufactured by Avantes, Holland). It continuously scanned the transmission spectrum of fingertip tissue over visible and NIR wavebands (200–1160 nm) for a certain amount of time and the scans were stored in internal memory in real time. Then the spectrometer sent the data to the PC through the USB data cable.Experiment procedure and details
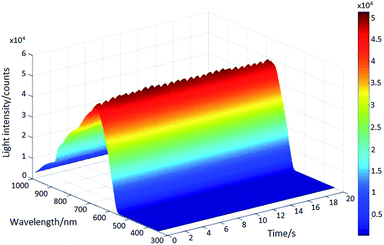
Most of the measured volunteers were healthy and ensured fasting measurements. All of the volunteers agreed to the experiments. Subjects of the experiments were recruited from the people who were going to accept a medical examination in the hospital. Before participating in our study, the potential subjects were provided with the general information about our research and were noticed of the right to withdraw the consent to participate at any time, to ensure they could make an informed choice. All these experiments were conducted in compliance with the relevant laws as well as the guidelines issued by the Ethical Committee of Tianjin University and Tianjin No. 254 hospital. Each subject placed their right middle finger flatted on the finger platform in a stable state. Make sure their finger cover the detection optical fiber. The light emitted from the light source transmitted through the finger, and the transmitted light got into two different wave bands spectrometers by two optical fibers, respectively. The overall procedure time for one subject was about 2 to 3 minutes. The wavelengths range used in this research was from 591.85 nm to 1119.96 nm (the number of wavelength is 586) due to the limit of light source wavelength range and the characteristics of spectrum. The integration time of the spectrometer was set to 20 ms, the sampling frequency was 50 Hz and the number of sampling points was 1400. After sampling experiments, the hospital professionals collected venous blood for the volunteers to get their blood biochemical parameters and the blood constituent concentration value.Fig. 5 shows the PPG signal (20 s) of one volunteer. It's a time-varying signal which contains the transmission spectrum over a fixed wavelength range but at different moments. At the waveband of high signal intensity, the pulse wave can be identified clearly.
After the collection of spectral data, 218 subjects were measured, 151 of which were eventually selected for modeling and predicting. The general information of these volunteers is listed in Table 1. During the 151 samples, 129 of them were selected according to the“M + N” theory31 as the training set (calibration) to establish a calibration model while the other 22 samples composed the test set (prediction).
| Gender | Max age | Min age | Average age | Sample size |
|---|---|---|---|---|
| Male | 81 | 24 | 47.48 | 91 |
| Female | 74 | 24 | 45.44 | 60 |
| Overall | 81 | 24 | 46.66 | 151 |
Firstly, the method of DTCWT was used to pre-process the recorded PPG signals. Secondly, DS data of these subjects were extracted by the new method. Last but not least, these DS data were used for modeling. PLS32,33 was used as the modeling method and the number of principal components was determined by cross validation in this research. The correlation coefficient of the calibration set Rc, the root mean square error of the calibration set RMSEC, the correlation coefficient of the prediction set Rp and the root mean square error of the prediction set RMSEP were considered as the evaluation index of the prediction performance. In order to verify this new DS extraction method, two commonly used DS extraction methods were used for comparison.
All data obtained from the experiments were gathered to format convert by using Avaspec software (version 76USB2) and transferred to MATLAB. All calculations were processed by MATLAB (version 2010 a).
Results and discussion
DTCWT pre-processing
The signal was pre-processed simultaneously by Butterworth filter and DTCWT, respectively. The processed signals at wavelength 670.04 nm of one subject are shown in Fig. 6.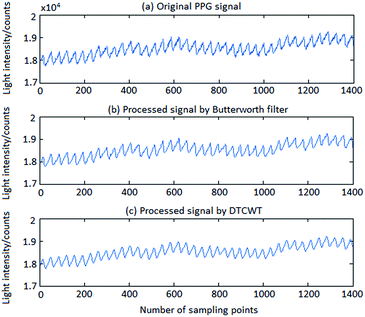 | ||
| Fig. 6 Pre-processed results of one subject: (a) original PPG signal. (b) Processed signal by Butterworth filter. (c) Processed signal by DTCWT. | ||
It is obvious that both of the two methods removed the high frequency noise well. However, compared with Butterworth filter, processed signal by DTCWT showed greater smoothness. And then the template signal was obtained by superposition and averaging. As shown in Fig. 7.
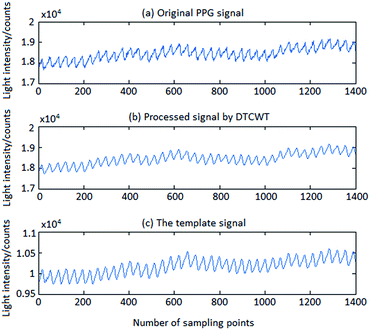 | ||
| Fig. 7 DTCWT pre-processing results of one subject: (a) original PPG signal. (b) Processed signal by DTCWT. (c) The template signal. | ||
It is obvious that the template signal removed random error and a part of baseline drift, which will give a great help for the back of the extraction work.
FastICA processing
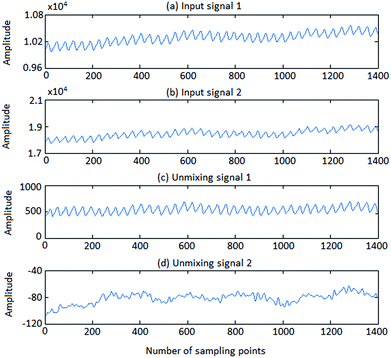
The processed results of FastICA are portrayed in Fig. 8.It is obvious that ICA was able to make blind source separated from the subgraphs above. The required signal was separated with the useless part which was irrelevant to both PPG signal and the template signal. And for the required signal, the motion artifact (MA) was removed, so it would contain more adequate and stable information of the original signal. Then the required signal was processed by LMS adaptive filtering, and the output is shown as Fig. 9.
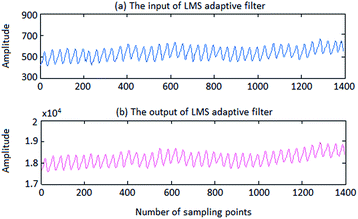 | ||
| Fig. 9 The result of LMS adaptive filter processing: (a) the input of LMS adaptive filter. (b) The output of LMS adaptive filter. | ||
This graph clearly indicates that the amplitude of PPG correlation signal of outputs of ICA was recovered by LMS adaptive filter. In that way, the output of LMS adaptive filter will have the same order of magnitude with the original PPG.
DS generation
The extracted DS results by three methods of one subject are depicted as in Fig. 10.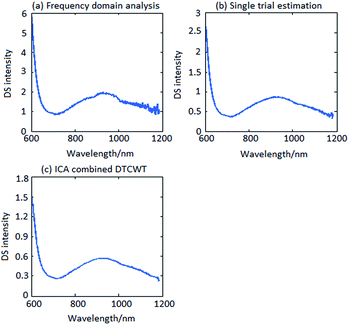 | ||
| Fig. 10 Comparison diagram of DS by three methods: (a) DS of frequency domain analysis. (b) DS of single trial estimation. (c) DS of ICA combined DTCWT. | ||
It is clearly shown that DS curve of frequency domain analysis had burr which represented the high-frequency interference was not removed completely. DS curve of single trial estimation was quite smooth, but there was still a little interference on low-frequency. And DS curve of ICA combined DTCWT is the smoothest and cleanest which mean that the DS data would express better information.
Modeling forecast
The DS data extracted by the three methods were modeled to predict the value of hemoglobin concentration separately. Table 2 and Fig. 11 showed the prediction results of the DS modeling by the three methods. In Table 2, range represents hemoglobin concentration range covering all subjects.| DS extraction method | Range (g L−1) | RMSEC (g L−1) | Rc | RMSEP (g L−1) | RP |
|---|---|---|---|---|---|
| Frequency domain analysis | 90–173 | 14.7799 | 0.8230 | 17.3135 | 0.6371 |
| Single trial estimation | 90–173 | 10.6272 | 0.8578 | 12.1011 | 0.7883 |
| ICA combined DTCWT | 90–173 | 10.2818 | 0.9389 | 8.6401 | 0.9062 |
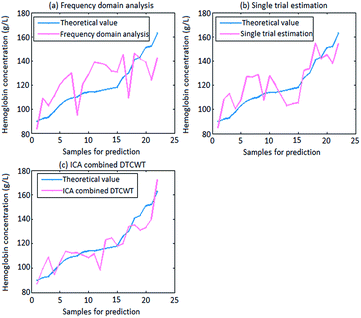 | ||
| Fig. 11 Prediction values of three extraction methods: (a) frequency domain analysis. (b) Single trial estimation. (c) ICA combined DTCWT. | ||
Table 2 showed that the correlation coefficient RP and the RMSEP value by using frequency domain analysis were 0.6371 and 17.3135. The correlation coefficient RP and the RMSEP value by using single trial estimation were 0.7883 and 12.1011. However, the correlation coefficient RP by using ICA combined DTCWT was the best, and the value reached 0.9062. Compared with the two methods, it was increased by 42.24% and 14.96%, respectively. Furthermore, the RMSEP value of the new method was 8.6401. Compared with the two methods, it was reduced by 50.10% and 28.60%, respectively. Obviously, the forecast result by using the new method worked best. Comparative prediction values of hemoglobin concentration by using different extraction methods are shown as in Fig. 11.
Fig. 11 clearly illustrates that the predicted value using ICA combined DTCWT had the minimum difference with the theoretical value. Namely, this method worked best on predicting. The above researches jointly demonstrate that the proposed new method could reach a relatively desired consequence for DS modeling forecast, which will promote the non-invasive measurement of blood components progress effectively and accurately.
Discussion
The proposed method in this paper combines the advantage of DTCWT and ICA. From the experiment results above, it can be clearly seen that DTCWT was more excellent on denoising than the commonly used method Butterworth filter. ICA could extract the effective signal without any prior information and it was able to obtain data which was closer to the original acquisition signal from the perspective of the signal source. Besides, no extra filtering was required during the extraction process, so the results reflected more accurate information. Compared with the currently popular DS extraction methods: frequency domain analysis and single trial estimation, the new method showed great improvement on the accuracy of the DS data and improved the modeling precision significantly.Conclusion
Dynamic spectrum plays an important role in the non-invasive detection of blood components. Frequency domain analysis and single trial estimation are two famous extraction methods for DS currently. However, frequency domain analysis is easy to use but cannot exclude singular value, and the motion artifacts cannot be easily removed because of spectral overlap. Single trial estimation has a strong anti-noise ability due to the elimination of abnormal data and the error correction by line-fitting. But it is more cumbersome for large sample data implementation and it still has not reached high prediction accuracy on modeling prediction. In this paper, a novel method based on ICA combined DTCWT has been proposed. This method can improve data accuracy from the perspective of the signal source and obtain more accurate DS data. In order to verify the effectiveness of this method, actual non-invasive measurement of hemoglobin concentration of 151 subjects was conducted. For further analysis and verification, prediction results of frequency domain analysis and single trial estimation were compared simultaneously. Analysis results showed that the method ICA combined DTCWT made spectral data modeling more accurate, which would be significant for non-invasive measurement of blood components.Acknowledgements
We are grateful to the help from the Medical Center of Tianjin PLA No. 254 Hospital. This study was supported by the National Natural Science Foundation of China (no. 30973964), and the Tianjin Application Basis & Front Technology Study Programs (no. 14JCZDJC33100).Notes and references
- S. R. Delwiche and R. A. Graybosch, Talanta, 2016, 146, 496–506 CrossRef CAS PubMed.
- J. Sundaram, C. V. Kandala and K. N. Govindarajan, et al., J. Sens. Technol., 2012, 2, 1–7 CrossRef CAS.
- K. Maruo and Y. Yamada, J. Biomed. Opt., 2015, 20(4), 047003 CrossRef PubMed.
- S. Liakat, K. A. Bors and T. Y. Huang, et al., Biomed. Opt. Express, 2013, 4(7), 1083–1090 CrossRef CAS PubMed.
- J. Kraitl and D. Klinger, Advancement in Sensing Technology, 2013, pp. 237–262 Search PubMed.
- M. Zanon, G. Sparacino and A. Facchinetti, et al., Med. Biol. Eng. Comput., 2012, 50(10), 1047–1057 Search PubMed.
- S. K. Vashist, Anal. Chim. Acta, 2012, 750, 16–27 CrossRef CAS PubMed.
- J. Kraitl, H. Ewald and H. Gehring, J. Opt. A: Pure Appl. Opt., 2005, 7(6), S318 CrossRef CAS.
- J. McMurdy, G. Jay and S. Suner, et al., J. Biophotonics, 2009, 2(5), 277–287 CrossRef CAS PubMed.
- M. X. Sun, L. Y. Zhang and C. Y. Jiang, et al., Optik, 2015, 126(4), 460–463 CrossRef CAS.
- P. Chen, B. Fernald and W. Lin, Phys. Med. Biol., 2011, 56(13), 3985 CrossRef CAS PubMed.
- J. E. Bender, A. B. Shang and E. W. Moretti, et al., Opt. Express, 2009, 17(26), 23396–23409 CrossRef CAS PubMed.
- K. J. Jeon, S. J. Kim and K. K. Park, J. Biomed. Opt., 2002, 7(1), 45–50 CrossRef CAS PubMed.
- X. Chen, Opt. Precis. Eng., 2008, 16(5), 759–763 CAS.
- Q. X. Li, H. Q Wang, G. Li and Z. Zhao, et al., Trans. Inst. Meas. Control, 2013, 35(1), 16–24 CrossRef.
- Y. Wang, G. Li and L. Lin, et al., Proceeding of the 2005 IEEE Engineering in Medicine and Biology 27th Annual International Conference, Shanghai, 2005, p. 6679 Search PubMed.
- G. Li, Y. C. Yang and L. Lin, et al., Comput. Eng. Appl. J., 2009, 45(35), 145 Search PubMed.
- G. Li, Q. X. Li and L. Lin, et al., Spectrosc. Spectral Anal., 2006, 26(12), 2177–2180 CAS.
- G. Li, C. Xiong and L. Lin, et al., Spectrosc. Spectral Anal., 2011, 31(7), 1857–1861 CAS.
- D. T. Delpy, M. Cope and P. Van der Zee, et al., Phys. Med. Biol., 1988, 33(12), 1433 CrossRef CAS PubMed.
- J. Allen, Physiol. Meas., 2007, 28(3), R1 CrossRef PubMed.
- P. Comon, Signal Process., 1994, 36, 287 CrossRef.
- Y. W. An and S. Wang, Chin. Phys. C, 2013, 37, 037006 CrossRef.
- W. B. Wang, X. D. Zhang and X. L. Wang, Acta Phys. Sin., 2013, 62, 050201 Search PubMed.
- A. Hyvarinen and E. Oja, Neural Comput., 1997, 9, 1483 CrossRef.
- A. Hyvarinen, IEEE Trans. Neural Network., 1999, 10, 626 CrossRef CAS PubMed.
- F. Peng, Z. Zhang, X. Gou, H. Liu and W. Wang, BioMedical Engineering Online, 2014, 13(1), 694–694 CrossRef PubMed.
- I. W. Selesnick, R. G. Baraniuk and N. G. Kingsbury, IEEE Signal Process. Mag., 2005, 22(6), 123–151 CrossRef.
- M. R. Ram, K. V. Madhav, E. H. Krishna, N. R. Komalla, K. Sivani and K. A. Reddy, IEEE Trans. Instrum. Meas., 2013, 62(10), 2639–2651 CrossRef.
- P. Maragos and R. W. Schafer, IEEE Trans. Acoust., Speech, Signal Process., 1987, 35(8), 1153–1169 CrossRef.
- L. Lin, Q. R. Zhang and M. Zhou, et al., RSC Adv., 2016, 6, 113322–113326 RSC.
- Y. W. Mi, Y. Y. Li and P. X. Chen, Chin. Med. Equip. J., 2011, 26(5), 92–95 Search PubMed.
- S. Pirhadi, F. Shiri and J. B. Ghasemi, RSC Adv., 2015, 5(127), 104635–104665 RSC.
| This journal is © The Royal Society of Chemistry 2017 |

