 Open Access Article
Creative Commons Attribution 3.0 Unported Licence
Bicrystalline TiO2 heterojunction for enhanced organic photodegradation: engineering and exploring surface chemistry†
Panpan Zhoua,
Yu Xie *a,
Lianjun Liub,
Jianhua Songa,
Tongcai Chena and
Yun Linga
aNanchang Hangkong University, Department of Material Chemistry, Nanchang, Jiangxi Province, China. E-mail: xieyu2006@gmail.com
bUniversity of Wisconsin-Milwaukee, Mechanical Engineering Department, Milwaukee, WI, USA
First published on 15th March 2017
Abstract
Bicrystalline TiO2 anatase/rutile (TiAR) and anatase/brookite (TiAB) have been extensively studied for photocatalysis, but the differences in their surface chemistry (defect and non-defect) are still not well understood. Here we integrated treatment effect and phase heterojunction effect to engineer the surface chemistry of TiAR and TiAB. TiAR and TiAB were either reduced by H2 or oxidized by H2O2. TiAR consisted of nanoparticle (anatase) patched nanobricks (rutile), while TiAB was predominated with nanorods. After treatment, both of them retained their morphologies, crystal structure, and porosities. We found that untreated TiAB demonstrated a twice higher activity than TiAR in methylene orange (MO) degradation, mainly because of the more facilitated charge transfer between the anatase and brookite interface, exposure of surface Ti3+/O2− radicals, and the positively charged surface in TiAB. Interestingly, H2-reduced TiAR and TiAB showed a decrease in activity compared to their counterparts, while H2O2-treated TiO2 went through different mechanisms. H2O2 treatment induced a gradual decrease in the activity of TiAB(H2O2), depending on the treatment temperature. By contrast, TiAR(H2O2) showed three times enhancement in activity that was comparable to the most active TiAB. The findings in this work provided new insights that rather than crystallinity, particle size, surface area, and band gap, the photocatalytic performance of TiO2 is closely associated with the phase junction, surface charge and defect sites (Ti3+/vacancy).
Introduction
Among various transition metal oxide semiconductors, titanium dioxide (TiO2) is an excellent photocatalyst candidate for eliminating organic contaminants in wastewater1–5 and producing solar fuels from artificial water splitting,6–9 because TiO2 has desirable chemical stability, photo-corrosion resistance, non-toxicity, strong oxidizing power and low cost. Generally, TiO2 exists in three different polymorphs: rutile, anatase and brookite.7,10 Among them, the rutile phase (band gap 3.0 eV) is the most thermodynamically stable form,11,12 while anatase and brookite with band gaps of 3.2 eV and 3.3 eV, respectively are the metastable forms,13–15 which could be transformed into rutile upon heating at high temperatures (>500 °C). Interestingly, anatase TiO2 usually demonstrates higher activity than rutile in photocatalysis. In contrast, the brookite phase is less studied because of its instability and difficulty in synthesis.Recently bi-and tri-crystalline TiO2 nanocrystals are of particular interests due to the formation of heterojunction between two phases.3,11,16–21 It is believed that the presence of more than one polymorph suppresses the recombination of electron–hole (e−–h+) pairs, since photo-excited electrons can migrate from one phase to another,8,22,23 and thus leading to an enhancement on the photocatalytic performance. For example, commercial Degussa P25 (∼80% anatase and 20% rutile) was often used as a reference and showed good activity due to the interfacial electron transfer from anatase to rutile that enhanced charge separation efficiency. On the other hand, biphasic anatase/brookite TiO2 with a tuneable ratio had been successfully developed,13,14,19,24 which exhibited higher activity than pure anatase or brookite phase for CO2 photoreduction and water splitting. This was primarily attributed to enhanced charge transfer occurring at the interface between anatase and brookite, where electrons could transfer from brookite to anatase while holes went through an opposite direction. From this aspect, more efforts are highly desirable to further explore the promising bicrystalline anatase/rutile (AR) and anatase/brookite (AB). Especially, it is very important to compare and understand the difference in the surface chemistry of TiO2(AR) and TiO2(AB).
Besides engineering the crystal phase of TiO2, many efforts have been paid to treat TiO2 through either thermal reduction using H2, NaBH4, or Mg,25–28 or oxidation process by H2O2 or O2,29–35 or self-doping,21,36–39 with a final aim to enhance charge transfer and visible light response. Reduction process generally induced the production of various colored (e.g., gray, blue, black) TiO2 with defects (oxygen vacancy and Ti3+) and narrowed band gap. This oxygen-deficient TiO2 not only extended light response to visible or even infrared region, but also showed good activity and durability for water splitting to H2 due to the exposure of more active sites.25 On the other hand, oxidation process (chemisorption of H2O2 onto the surface of TiO2) resulted in the formation of yellow complex titanium peroxide (Ti–OOH), which caused a red shift to 400–500 nm visible light region and generated interstitial oxygen defects.32,33 Moreover, the Ti–OOH complex could photo-excite and inject electrons into the conduction band of TiO2, which led to the decomposition of H2O2 into hydroxyl radicals (OH˙). These OH˙ radicals were very reactive, being nonselective species that rapidly react with a wide variety of organic substances. For example, Etacheri et al., provided a straightforward aqueous peroxo-titania route for the synthesis of high temperature stable and visible light active, oxygen-rich anatase phase TiO2.29 In this method, H2O2-treated TiO2 anatase showed higher activity than non-treated one for methylene blue degradation, largely depending on the concentration of H2O2. It is noted that in the aforementioned H2O2–TiO2 systems, most TiO2 particles or colloids are anatase or amorphous, whereas H2O2-treated bicrystalline TiO2 are seldom studied. In particular, which pre-treatment method (pre-reduce or pre-oxidize) to modify TiO2 is more advanced? It is necessary to comprehensively explore the difference in the surface and interface between reduced and oxidized TiO2 and between TiO2(AR) and TiO2(AB), as well as the correlation with photocatalytic activity.
In this work, to improve the photocatalytic performance of TiO2 nanocrystals, we combined the advantages of phase-junction and treatment effects. We controllably synthesized AR and AB by tuning the concentration of urea, and treated TiO2 by H2/Ar and H2O2 respectively to get the reduced and oxidized TiO2. We also systematically characterized their morphologies, crystal structures, textural properties, interface, and surface chemistry, and established the relationship between structure and photocatalytic performance. Most importantly, we found that oxidized TiO2 always exhibited higher activity than reduced one, and H2O2-treated AR and AB went through opposite mechanism towards organic degradation.
Experimental
Materials synthesis
TiO2(AR) and TiO2(AB) were prepared by a hydrothermal method. For TiO2(AR), 0.6 g urea was first dissolved in some deionized water, then 10 ml titanium bis(ammonium lactate) dihydroxide (TALH) (50% in H2O) and additional water were added to above urea solution up to 100 ml in total. After stirring 30 min, the mixed solution was transferred to a 250 ml Teflon-lined autoclave. The autoclave was subsequently sealed and heated in an electric oven at 160 °C for 24 h. After the autoclave naturally cooled down, the white precipitates were collected by high speed centrifugation, washed with deionized water for several times until pH around 7.0, and dried at 60 °C overnight. Finally, the product was calcined in air at 400 °C for 2 h. For TiO2(AB), the same procedure was conducted as TiO2(AR) except using high concentration of urea, i.e., 42 g.To get reduced TiO2 nanocrystals, TiO2(AR) or TiO2(AB) was calcined at 400 °C for 1 h again in 10% H2/Ar. To get oxidized TiO2, 200 mg TiO2(AR) or TiO2(AB) was mixed with 50 ml H2O and 2 ml 28% H2O2. Then the solution was transferred into autoclaved, sealed and heated in an electric oven at different temperatures (100 °C, 160 °C, 200 °C) for 12 h. After that, the H2O2 treated samples were washed by centrifugation several times and later dried at 60 °C overnight. The non-treated, H2 reduced, and H2O2 oxidized samples were labeled as TiAR, TiAB, TiAR(H2), TiAB(H2), TiAR(H2O2-X), and TiAB(H2O2-X), where X represented the temperature of H2O2 treatment.
Materials characterization
X-ray diffraction (XRD) pattern was conducted on an automatic X-ray diffractometer (XRD, Rigaku, RINT 2000 operated at 40 kV, 30 mA) to investigate the crystal structures of all prepared samples, with Cu Kα as the X-ray irradiation source. Field-emission scanning electron microscopy (FESEM, JEOL, JSM-6700F, 15 kV) was used to examine the morphologies of TiO2 polymorphs by using JSM-6700F in a secondary electron scattering mode at 15 kV. Transmission electron microscopy (TEM, Tecnai G2F20 S-Twin, 200 kV) was carried out to examine morphology and lattice structure. UV-vis diffuse reflectance spectra (DRS) was obtained on a Solid Spec-3700DUV spectrophotometer (Shimadzu) equipped with Labsphere diffuse reflectance accessory, using BaSO4 as reference. Adsorption–desorption isotherms of nitrogen were measured using the Brunauer–Emmett–Teller (BET) method at 77 K on a Micromeritics ASAP2020 apparatus. The surface composition and chemical state were analyzed by X-ray photoelectron spectroscopy (XPS) that was conducted by an X-ray photoelectron spectrometer (ESCALAB MK II) using MgKα (1253.6 eV) X-rays as the excitation source. Electron-paramagnetic resonance (EPR) experiments were carried out using a BrukerA300 spectrometer operating in the X-band (9.4 GHz) and equipped with an Oxford CF935 helium flow cryostat with an ITC-5025 temperature controller. The EPR spectra were recorded at 110 K. The surface charge (zeta potential) of TiO2 before and after treatment was measured by Malvern Zetaszier NanoZS90. The pH value of TiO2 solution was adjusted by HCl (0.1 M) or NaOH (1 M) from 0 to 14.Photocatalytic activity measurement
The photocatalytic performances of TiAR- and TiAB-based samples for degradation of organic dye were measured in aqueous solution under simulated solar light irradiation. The photocatalytic reaction was conducted at room temperature. The light source was 300 W xenon lamp (PLS-SXE300, Beijing Trust-tech Co., Ltd., China). The light intensity was ∼100 mW cm−2 in the range of 200–1000 nm. 50 mg photocatalyst was added in the 50 ml MO solution (10 ppm), and stirred thoroughly for 0.5 h in the dark to reach adsorption–desorption equilibrium. After that, 3 ml of suspension was taken out to measure the initial concentration of MO after dark adsorption. Meanwhile, the xenon lamp was turned on to irradiate the solution under constant stirring. At a given interval of 15 min, the suspension (3 ml) was separated by centrifugation. The solution was then immediately analyzed on UV-vis spectrophotometer (UV-2550, Shimadzu, Japan) at λ = 463 nm to determine the concentration of residual MO.Results and discussion
Photocatalytic performance
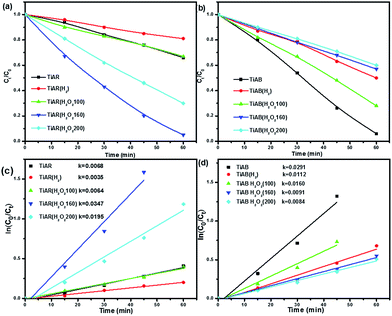
Fig. 1 shows the ratio of MO concentration (Ct/C0) as a function of irradiation time using the non-treated and treated TiO2. In Fig. 1a, TiAR showed 34% removal efficiency of MO after 60 min. TiAR(H2) even exhibited a decrease in degradation efficiency that only reached 16%. By contrast, H2O2 treatment remarkably enhanced the activity of TiAR, depending on the treatment temperature. After treated at a low temperature, TiAR(H2O2-100) had similar activity as TiAR. When treated at a moderate temperature, TiAR(H2O2-160) showed a higher activity, which almost reached 100% within 60 min. Further increasing the temperature to 200 °C, the activity of TiAR(H2O2-200) decreased to 50%. The optimum temperature by H2O2 treatment for TiAR was ∼160 °C in this work.More interestingly, when using same process to treat TiAB, the resulting samples showed totally opposite activity trend to TiAR. As shown in Fig. 1b, MO was almost removed completely by TiAB (without any treatment) within 60 min. Unfortunately, the photo-degradation efficiency of TiAB decreased if treated either by H2 or by H2O2. For example, TiAB(H2) showed only 50% removal efficiency after 60 min. The activity of TiAB(H2O2) also decreased gradually with the increase of treatment temperature. By comparing the results in Fig. 1, one can also easily find that TiAB demonstrated over twice higher degradation efficiency and faster degradation rate than TiAR. On the other hand, TiAR(H2O2-160) showed nearly three times higher activity than TiAB(H2O2-160). We also calculated the reaction rate constant for TiAR and TiAB samples, assuming the degradation process followed the pseudo-first-order kinetic model. For TiAR-based samples (Fig. 1c), the reaction rate constant was on the order of TiAR(H2O2-160) > TiAR(H2O2-200) > TiAR(H2O2-100) ≈ TiAR > TiAR(H2), while for TiAB-based samples (Fig. 1d), the reaction rate constant was TiAB > TiAB(H2O2-100) > TiAB(H2) > TiAB(H2O2-160) > TiAR(H2O2-200). On the other hand, TiAB and TiAR(H2O2-160) show a comparable reaction rate with commercial P25, which was higher than TiAR. Here several key questions need to be addressed: (1) why TiAB is more active than TiAR? (2) Why does H2 reduction treatment cause activity loss for both TiAR and TiAB? (3) Why does H2O2 treatment induce an opposite trend for TiAR and TiAB? The materials structures and surface chemistry will be characterized and correlated with the photocatalytic data later in this paper.
Crystal structure and morphology
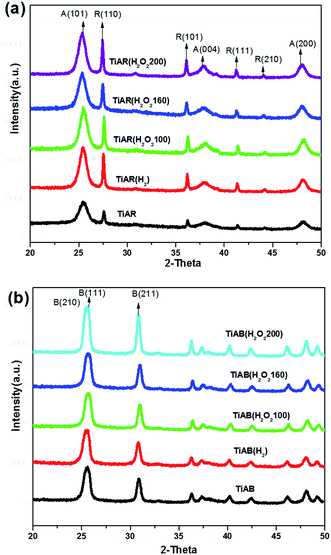
The crystal structures of bicrystalline TiAR and TiAB samples were confirmed by XRD and Raman spectroscopy. Fig. 2 shows the XRD patterns of the as-prepared and treated TiO2. As shown in Fig. 2a, TiAR showed a mixed phase of anatase (JCPDS no. 86-1156) and rutile (JCPDS no. 87-0710) with a ratio of 59%/41%. After H2 treatment, TiAR(H2) still remained in bicrystalline anatase/rutile phase, but its diffraction peaks become stronger and shaper. This result indicated that H2 treatment could not change the crystal phase, but increased the crystallinity, crystal size and content of rutile phase (49%), likely because post-treatment for additional 1 h resulted in further growth of TiO2 crystals and slight transformation of anatase to rutile. Similarly, H2O2 treatment also induced an increase of TiO2 crystallinity and growth of rutile phase (46–48%), which was affected by hydrothermal treatment temperature slightly (Table 1).| Samples | BET surface area (m2 g−1) | Pore volume (cm3 g−1) | Band gap (eV) | Zeta potential (mV) | A/R or A/B ratio |
|---|---|---|---|---|---|
| TiAR | 118 | 0.187 | 3.08 | −35.3 | 59% A/41% R |
| TiAR(H2) | 89 | 0.160 | 3.05 | −25.8 | 49% A/51% R |
| TiAR(H2O2-160) | 102 | 0.168 | 3.01 | −0.094 | 53% A/47% R |
| TiAR(H2O2-200) | 109 | 0.172 | 3.00 | — | 52% A/48% R |
| TiAB | 70 | 0.273 | 3.23 | 0.724 | 83% B/17% A |
| TiAB(H2) | 75 | 0.292 | 3.24 | −4.06 | 84% B/16% A |
| TiAB(H2O2-160) | 67 | 0.280 | 3.25 | −13.4 | 87% B/13% A |
| TiAB(H2O2-200) | 63 | 0.270 | 3.29 | — | 95% B/5% A |
In respect to anatase/brookite samples (Fig. 2b), TiAB showed discernible brookite phase (JCPDS no. 76-1934) from its unique (211), (221), and (302) diffraction peaks at 30.81°, 42.34°, 46.07° (2θ).13,14 Since the main diffraction peaks of anatase (101) at 25.31°, (004) at 38.01° and (200) at 48.23° overlapped with brookite, it was difficult to directly distinguish anatase from brookite by XRD patterns. Raman results have confirmed the existence of anatase phase in TiAB (see Fig. S1†). We also used Rietveld refinement method to calculate the anatase-brookite ratio from XRD patterns. The phase ratio is obtained from the MAUD software automatically after appropriate refinement (see Fig. S2,† TiAB fitting curve as an example). TiAB was composed of 83% brookite and 17% anatase. After treated by H2 or by H2O2 below 160 °C, TiAB(H2), TiAB(H2O2-100) and TiAB(H2O2-160) showed very similar XRD patterns as TiAB, indicating no significant changes occurred in the crystallinity, crystal size and ratio of crystal phase. However, TiAB(H2O2-200) exhibited shaper and stronger peaks than others, and the brookite content increased to 95%. In agreement with previous report,13 the hydrothermal temperature that was high could promote further growth of brookite crystals.
The morphologies and particle size of the treated TiO2 nanocrystals were examined by SEM, as shown in Fig. 3. TiAR consisted sphere-shaped nanoparticles (<20 nm) and brick-shaped particles (width × length ≈ 80 nm × 250 nm) (Fig. 3a), where the small particles were dispersed on the surface of bricks. The small particles could possibly be in anatase phase while bricks could be in rutile phase, which was confirmed by TEM/HRTEM described later in this paper. Noticeably, varying the treatment conditions, either H2 or H2O2 at different temperatures, did not change the morphology and particle size of TiAR (Fig. 3b–e). In terms of brookite-rich samples, TiAB had a small portion of sphere-shaped nanoparticles that were patched on the rod-shaped particles (length ≈ 100 nm) (Fig. 3f). When treated by H2 or by H2O2 at 100 °C, the morphologies of TiAB(H2) (Fig. 3g) and TiAB(H2O2-100) (Fig. 3h) retained similar as TiAB, but when treated by H2O2 at 160 °C or above, TiAB(H2O2-160) (Fig. 3i) and TiAB(H2O2-200) (not shown) had a higher aspect ratio (rods-shaped) and their length became longer (≈150 nm). This phenomenon was consistent with XRD observations that brookite content approached nearly 100% when increasing the treatment temperature with H2O2, which may cause the evolution of anatase nanoparticles to brookite nanorods.14
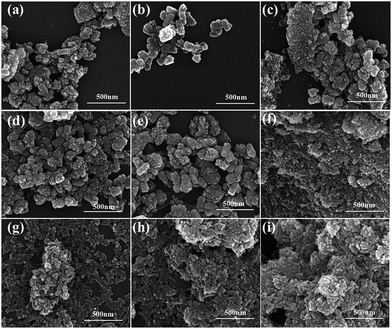 | ||
| Fig. 3 SEM images of (a) TiAR, (b) TiAR(H2), (c) TiAR(H2O2-100), (d) TiAR(H2O2-160), (e) TiAR(H2O2-200), (f) TiAB, (g) TiAB(H2), (h) TiAB(H2O2-100), and (i) TiAB(H2O2-160). | ||
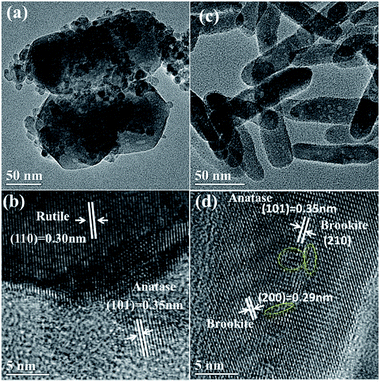
TEM and HRTEM were further conducted to evaluate the morphology, particle size, and lattice structure of TiAR(H2O2-160) and TiAB(H2O2-160). For TiAR(H2O2-160), TEM image (Fig. 4a) showed that many small particles with a size of about 10 nm were patched either at the edge of or on the top of nanobricks. The HRTEM image (Fig. 4b) clearly demonstrated that the nanoparticles were anatase (lattice spacing of 0.35 nm, corresponding to the anatase (101) plane) and the nanobricks were rutile (lattice spacing = 0.30 nm, attributed to rutile (110) plane).11,22,30 Fig. 4b also indicated the formation of a coherent interface between the overlapping anatase nanoparticles and rutile nanobricks. The lattice fringe of rutile became fuzzy and even discontinued where rutile and anatase crystals overlapped. An anatase particle was also located at the edge of rutile. Besides the attachment of anatase particles to rutile bricks, a phase heterojunction could be possibly formed due to the close contact and interaction between them. Such phenomenon has also been observed on P25 and anatase/rutile mixture by other groups.17,22,23
As shown in Fig. 4c, the nanorods-shaped TiAB(H2O2-160) was randomly dispersed with a diameter of 25 nm and a length of approximately 100 nm. The HRTEM image in Fig. 4d showed clear lattice fringes of TiO2 brookite (lattice spacing = 0.29 nm), which coincided with the distance between the (200) planes.40,41 In Fig. 4c, one can also see that the surface of the nanorods was decorated with a few small white spots. However, it is difficult to distinguish the spots are anatase particles or defects. The HRTEM image showed that some lattice fringes have a spacing of 0.35 nm that matched to either anatase (101) plane or brookite (210) plane. On the other hand, some lattice fringe becomes fuzzy and even discontinued (yellow circle region), which is possibly caused by the overlap of different planes in one phase or of anatase and brookite crystals. The combination of XRD, Raman and HRTEM results suggest that anatase and brookite indeed co-exist on TiAB. A unique interface between them can be formed because the two phases may share a common boundary. This observation also agrees with the previous theoretical simulations and experimental reports.11,24,42
Textural properties and band gap
N2 adsorption was measured to explore the effect of treatment on the porosity and textural properties of all the samples. Fig. 5a shows the N2 adsorption–desorption isotherms for TiAR-based samples. Obviously, TiAR showed a type-IV isotherm with a H2-type hysteresis loop, which was associated with a typical mesoporous structure arising from the space between the nanoparticles. No matter treated by H2 or by H2O2, TiAR(H2) and TiAR(H2O2) samples displayed similar isotherms as TiAR. This result indicated that the treatment had minor impact on the mesoporous structure of TiAR, probably because treatment did not change their morphologies significantly. The same phenomenon was also observed on the TiAB-based samples before and after treatment (Fig. 5b). On the other hand, the hysteresis loops of TiAR-based samples were located at a lower relative pressure (P/P0 = 0.4–0.8) compared with that of TiAB (P/P0 = 0.7–1.0). This difference likely resulted from the smaller pore size of TiAR-based samples. As confirmed by the pore size distributions (PSDs) results, TiAR, TiAR(H2) and TiAR(H2O2) had narrow PSDs peaks centered at ∼8 nm, while TiAB-based samples had broad PSDs peaks at ∼16–30 nm. As aforementioned in SEM, TiAR-based samples were composed of many aggregated small particles while TiAB samples were rods-shaped particles with a large size. Hence the small space between those nanoparticles resulted in the small pore size of TiAR.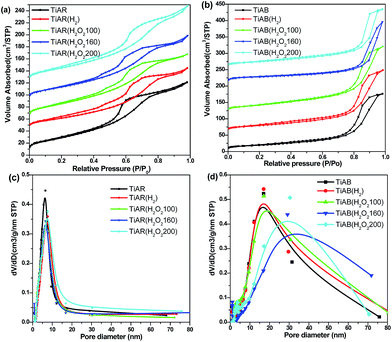 | ||
| Fig. 5 Nitrogen adsorption–desorption isotherms and pore-size distribution for (a and c) TiAR and (b and d) TiAB samples treated by H2 and H2O2. | ||
The porous structures of TiAR and TiAB samples were negligibly affected by H2 or H2O2 treatment, but their surface area and pore volume changed slightly. As shown in Table 1, the surface area and pore volume of TiAR(H2O2) slightly decreased to 105 m2 g−1 and 0.170 cm3 g−1 compared with TiAR (118 m2 g−1, 0.187 cm3 g−1). H2 treatment resulted in further decrease of surface area and pore volume to 89 m2 g−1 and 0.160 cm3 g−1, likely due to the increase of crystal size and rutile content (more nanobricks) in TiAR(H2). However, TiAB, TiAB(H2) and TiAB(H2O2) showed comparable surface area and pore volume, because their morphologies and crystal size retained similar. In Table 1, one can also find that TiAB-based samples generally show ∼35% smaller surface areas but ∼50% larger pore volume than that of TiAR. This was because TiAB-based samples were composed of uniform and large-size nanorods, which led to small surface area; but the space between the nanorods was wide, which resulted in the formation of large pore volume and pore size.
UV-vis spectra have been recorded to examine the light absorption and band gap of bicrystalline TiO2 before and after treatment. As shown in Fig. 6a, the absorption edge of TiAR was around 403 nm, corresponding to a band gap of 3.08 eV on the basis of the Kubelka–Munk function (Fig. 6b). The band gap of TiAR(H2) was slightly narrowed down to 3.05 eV, because H2 treatment induced the increase of rutile content, while pure rutile (3.1 eV) generally had a smaller band gap than anatase (3.2 eV).16,43 More interestingly, H2O2 treatment led to a decrease of band gap further. For example, the absorption edge of TiAR(H2O2-160) red shifted to 415 nm (band gap = 3.00 eV), and a small tail extended to visible light region (415–550 nm). This result strongly suggests that H2O2 treatment could enhance visible light absorption ability, which is reflected by its physical appearance of light yellowish color. This observation is also consistent with previous reports that treatment of TiO2 hydrosol or rutile with H2O2 leads to the formation of Ti–OOH or super-oxide species on the surface, which could contribute to visible light response.31–33,44,45
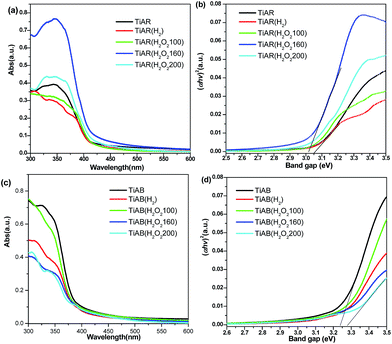 | ||
| Fig. 6 UV-vis diffuse reflectance spectra and band gap analyses for (a and b) TiAR and (c and d) TiAB samples treated by H2 and H2O2. | ||
Regarding anatase-brookite samples, treatment by either H2 or H2O2 induced a blue shift of absorption edge to from 400 nm to 380 nm (Fig. 6c). Correspondingly, the band gaps were enlarged (Fig. 6d). For instance, the band gap of TiAB(H2O2-200) could reach as high as 3.29 eV compared with 3.23 eV for TiAB. This was because the brookite content increased after treatment, while brookite TiO2 usually had the largest band gap (3.30 eV) among the three anatase, rutile and brookite phases.8,19,46 From Fig. 6a and c one can also find that even through same H2O2 treatment process, an opposite trend is observed in terms of absorption edge, i.e., red shift over TiAR-H2O2 while blue shift over TiAB-H2O2. This important finding demonstrates that crystal phase not only governs the light absorption ability and band gap but also control the surface chemistry of TiO2. It seems that the surface lattice oxygen of TiAR is easier to be tuned than TiAB.
Chemical state and surface chemistry
XPS analysis was performed on the as-prepared TiO2 to investigate the chemical states before and after treatment. TiAR, TiAR(H2) and TiAR(H2O2-160) showed two peaks at 458.56 eV and 464.41 eV (Fig. 7a), which are related to the 2p3/2 and 2p1/2 spin states of Ti4+, respectively. No shoulder peaks for Ti3+ (457.7 eV) were observed even on the reduced TiAR(H2), possibly because the concentration of Ti3+ was low that beyond the XPS detection limitation or because Ti3+ sites were located in the bulk rather than surface. The O 1s profiles of the three samples were all characterized by a major peak at 529.3 eV (O′), assigned to O atoms in the TiO2 lattice, and one minor component at 531.5 eV (O′′) (Fig. 7b), attributed to –OH and C![[double bond, length as m-dash]](https://www.rsc.org/images/entities/char_e001.gif) O groups adsorbed on the surface TiO2. It is noted that in agreement with earlier findings, TiAR(H2O2) did not display any peaks in the O 1s profile that could be assigned to the formation of Ti-peroxide. In addition, TiAB and TiAB(H2O2-160) showed similar Ti 2p and O 1s profiles as TiAR. Through the calculation of fitting peak ratio (O′′/(O′ + O′′)), it was found that the surface oxygen-containing group was on the order of TiAR (19.8%) > TiAR(H2) (18.5%) > TiAR(H2O2-160) (16.5%). This result suggested that H2O2 treatment could increase the amount of surface lattice O either by increasing the crystallinity or by filling the subsurface defects.
O groups adsorbed on the surface TiO2. It is noted that in agreement with earlier findings, TiAR(H2O2) did not display any peaks in the O 1s profile that could be assigned to the formation of Ti-peroxide. In addition, TiAB and TiAB(H2O2-160) showed similar Ti 2p and O 1s profiles as TiAR. Through the calculation of fitting peak ratio (O′′/(O′ + O′′)), it was found that the surface oxygen-containing group was on the order of TiAR (19.8%) > TiAR(H2) (18.5%) > TiAR(H2O2-160) (16.5%). This result suggested that H2O2 treatment could increase the amount of surface lattice O either by increasing the crystallinity or by filling the subsurface defects.
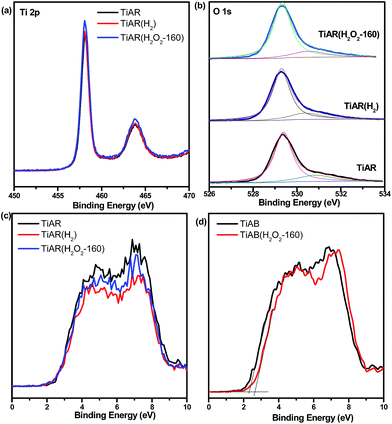 | ||
| Fig. 7 XPS spectra for TiAR, TiAR(H2) and TiAR(H2O2-160): (a) Ti 2p, (b) O 1s; valence band spectra for (c) TiAR and (d) TiAB before and after treatment. | ||
XPS analysis has also been conducted to examine the treatment effect on the position of valance band (VB) of TiAR and TiAB. As shown in Fig. 7c, the valence band position of TiAR, TiAR(H2) and TiAR(H2O2-160) was all at 2.6 eV. On the basis of the measured Eg from UV-vis spectra, the conduction band (CB) of TiAR, TiAR(H2) and TiAR(H2O2-160) was calculated to be −0.49 eV, −0.45 eV and −0.40 eV, respectively, using the equation of Eg = EVB − ECB. On the other hand, the EVB of TiAB and TiAB(H2O2-160) was located at 2.32 eV and 2.65 eV, respectively (Fig. 7d). Correspondingly, their calculated ECB are at −0.91 eV and −0.6 eV. Clearly, on TiAR H2O2 treatment induced the movement of ECB only towards more positive direction, while on TiAB both ECB and EVB became more positive.
To confirm the possible formation of Ti3+ and oxygen vacancy (VO) and further approach the surface chemistry of TiO2 before and after treatment, we have carried out EPR at 110 K. As shown in Fig. 8a, un-treated TiAR showed a strong signal at g = 2.01 and a broad peak at g = 1.981, which were ascribed to VO and unsaturated Ti3+, respectively.47–49 For TiAR(H2), an extra new peak for Ti3+ (g = 1.999) appeared, and the peak intensity for VO increased slightly. This result indicated that H2 treatment led to the formation of more Ti3+/VO on TiAR(H2), which was consistent with literature reports.25,26 This observation also matched with its own appearance of TiAR(H2) that showed a gray blue colour. When treated by H2O2, TiAR(H2O2-160) showed similar signal as TiAR, indicating that H2O2 treatment may not change the structure of TiAR.
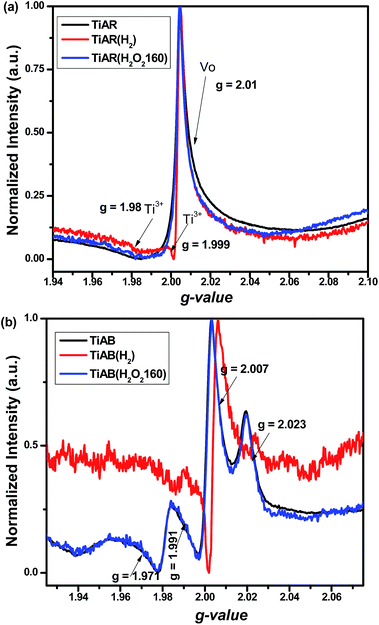 | ||
| Fig. 8 EPR spectra for (a) TiAR, TiAR(H2) and TiAR(H2O2-160) and (b) TiAB, TiAB(H2) and TiAB(H2O2-160). | ||
On the other hand, Fig. 8b shows that TiAB has similar trend in change of Ti3+/VO after H2 and H2O2 treatment. Noticeably, two major differences could be distinguished from the comparison of TiAB and TiAR. First, TiAB had multiple peaks at g = 1.971–1.991, g = 2.007, and g = 2.023, which were attributed to Ti3+ sites, VO and super-oxygen ions (O2−), respectively.47,49–51 The formation of O2− species was possibly due to the attachment of electrons stored in VO to adsorbed O2 molecules. Second but more importantly, the intensity of Ti3+ on TiAB was much stronger than that on TiAR, indicating TiAR had a higher content of Ti3+. Compared to TiAR(H2), the peak intensity for Ti3+ also significantly increased in TiAB(H2). In agreement with DFT calculation and previous reports,42,52 Ti3+ sites were more easily formed on anatase and brookite phase than rutile phase, due to the lowest formation energy of Ti3+ defects on brookite (5.52 eV) compared to anatase (5.58 eV) and rutile (5.82 eV). In addition, the sharp shape of Ti3+ signal indicated that Ti3+ sites were typically located in the bulk.
Structure–performance relationship
By recalling the questions arising from photocatalytic performance, the higher activity of TiAB than TiAR should result from its unique band structure and surface property, although TiAB has smaller surface area, larger band gap and bigger particle size. First, because TiAB has high ratio of brookite phase, TiAB has a more negative CB, which means strongly oxidative O2− radicals could be generated through the attachment of photo-excited electrons to adsorbed O2 molecules (see EPR analysis). The O2− radicals have strong ability to oxidize organic dyes. However, no O2− radicals appeared on TiAR. Second, the photocurrent measurements showed that the photocurrent over TiAB could reach as high as 8 × 10⁻⁷ A cm−2 but TiAR had a low photocurrent of 4 × 10⁻⁷ A cm−2 (Fig. 9). Obviously, the charge transfer in TiAB was more efficient than that in TiAR. Third, at pH around 8 TiAB had a zeta potential 0.794 mV (Table 1) while the surface of TiAR was negatively charged (zeta potential −35.4 mV). Because MO was a negatively charged molecule when dissolved in water (pH ≈ 8), the positively charged surface of TiAB can enhance molecule adsorption through electrostatic binding. To further clarify the important role of surface charge in governing the performance of TiAR and TiAB, we conducted control experiments of degrading a positively charged organic molecule, i.e., methylene blue (MB) (see Fig. S3†). The result showed that TiAR had ∼70% degradation efficiency for MB at 60 min, slightly lower than TiAB (90%). However, TiAR only removed MO by 30%, two times lower than TiAB. This difference demonstrated that the negatively charged surface of TiAR could adsorb MB more easily compared to MO, thus leading to an enhanced activity of TiAR. Similar trends were also observed on the treated TiAR and TiAB. Again, the control experiment confirmed that surface charge of TiO2 was a key factor to affect the photocatalytic performance of organic pollutants degradation.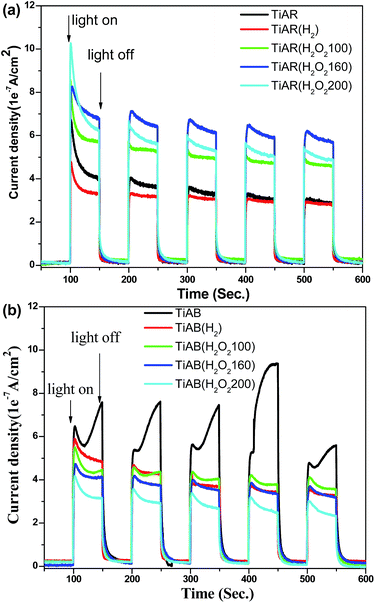 | ||
| Fig. 9 Photocurrent density for (a) TiAR-based samples and (b) TiAB-based samples under UV-vis light irradiation. | ||
In terms of H2 treated TiO2, the slight decrease in the activity of TiAR(H2) should be due to the decrease of surface area and the increased content of rutile phase, which could possibly limit the adsorption of MO molecules and accelerate the recombination rate of electron–hole pairs. TiAR(H2) had a smaller photocurrent density than TiAR (Fig. 9), which clearly demonstrated that the presence of more rutile in TiAR(H2) induced fast charge recombination. On the other hand, since TiAB and TiAB(H2) had comparable surface area, band gap, crystallinity and ratio of anatase/brookite, the loss of activity over TiAB(H2) could be due to the following two reasons: (1) H2 treatment resulted in the formation of additional Ti3+ sites located in the bulk, which could act as charge recombination center. In this context, charge carriers could be easily recombined over TiAB(H2). This was also evidenced by its lower photocurrent density than TiAB (see Fig. 9b); (2) the surface of TiAB(H2) became negative (zeta potential = −4.06 mV) that may hinder the adsorption and contact of MO with TiAB(H2). It is worth mentioning that even though H2 treatment decreased the activity of both TiAB and TiAR, TiAB(H2) still showed twice higher activity than TiAR(H2). This interesting result indicates that the surface chemistry of TiO2 (e.g., surface charge and active sites) plays an essential role in determining its photocatalytic performance, while there is a trade-off between each factor. The crystal phase of TiO2 will determine its surface property.
More interestingly, TiAR(H2O2) and TiAB(H2O2) may go through different mechanisms for MO adsorption and degradation. H2O2-treated TiAR showed an enhanced performance that was primarily due to the combination of the following factors: (1) H2O2 treatment induced the narrow of band gap and boosted the light absorption of TiAR(H2O2-160); (2) the bulk Ti3+/vacancy sites (recombination center) were filled with extra O fragment from H2O2, thus enhancing charge separation and transfer significantly. This inference was confirmed by the photocurrent density measurement that TiAR(H2O2-160) showed highest value among the five TiAR-based samples; and (3) compared with TiAR (−35.3 mV) the surface charge of TiAR(H2O2-160) was close to neutral (−0.094 mV) (Table 1), possibly caused by full fill of oxygen-deficient sites by H2O2. As a result, TiAR(H2O2-160) has a stronger affinity to attract negative MO molecules. On the other hand, TiAB(H2O2-160) showed a lower activity than TiAB, probably due to its enhanced crystallinity, enlarged band gap, and negatively charged surface (see Table 1). We also found that TiAR(H2O2-160) was more active than TiAB(H2O2-160) but comparable to untreated TiAB. We infer that (1) the surface of TiAR is more sensitive to oxidation process than TiAB, possibly because TiAB has good crystallinity, high ratio of brookite to anatase, and less defect sites; and (2) for degrading organics, oxidation treatment process (H2O2) is a more efficient way to enhance the efficiency of TiO2 than reduction process (H2 treatment). This important finding shows that to degrade a specific organic matter we need to determine the right treatment method and the appropriate crystal phase of TiO2.
Conclusions
We have developed two methods (H2O2 oxidation and H2 reduction) to treat bicrystalline TiO2 heterojunctions, i.e., anatase/rutile (TiAR) and anatase/brookite (TiAB). It was found that TiAR was composed of anatase particles patched rutile nanobricks, and TiAB was nanorods. Treatment didn't change their morphologies, crystal phases, particle size, and pore size, but slightly changed crystal phase ratio and band gap (red shift for TiAR and blue shift for TiAB). H2 treatment induce the formation of extra Ti3+ sites. More importantly, TiAR and TiAB-based samples went through different mechanisms for photo-degradation of MO dye. TiAB showed twice higher active than TiAR, mainly due to the enhanced charge transfer between anatase and brookite, the presence of surface Ti3+ and O2− radicals, and the positive charged surface. However, H2 treatment induced decrease in activity for both TiAB and TiAR. H2O2 treatment led to a twice enhancement on the activity of TiAR but decrease on TiAB. The findings in this work demonstrated that phase heterojunction, surface charge and Ti3+/vacancy sites essentially governed the photocatalytic activity of TiO2. It also needs to pay close attention to choose an appropriate TiO2 with a rational crystal phase ratio and treatment method.Acknowledgements
We thank the financial supports from National Natural Science Foundation of China (No. 21667019), Natural Science Foundation of Jiangxi Province (No. 20132BAB203018), Jiangxi Province Youth Scientists Cultivating Object Program (No. 20112BCB23017), Nanchang Hangkong University Graduate Innovation Foundation (YC2015020), and Key Laboratory of Photochemical Conversion and Optoelectronic Materials, TIPC, CSA (No. PCOM201401).Notes and references
- N. Miranda-Garcia, S. Suarez, B. Sanchez, J. M. Coronado, S. Malato and M. I. Maldonado, Appl. Catal., B, 2011, 103, 294–301 CrossRef CAS.
- P. Pattanaik and M. K. Sahoo, Desalin. Water Treat., 2014, 52, 6567–6590 CrossRef CAS.
- R. Boppella, P. Basak and S. V. Manorama, ACS Appl. Mater. Interfaces, 2012, 4, 1239–1246 CAS.
- P. Gao, Z. Liu, M. Tai, D. D. Sun and W. Ng, Appl. Catal., B, 2013, 138, 17–25 CrossRef.
- M. T. Amin, A. A. Alazba and U. Manzoor, Adv. Mater. Sci. Eng., 2014, 825910 Search PubMed.
- J. Schneider, M. Matsuoka, M. Takeuchi, J. L. Zhang, Y. Horiuchi, M. Anpo and D. W. Bahnemann, Chem. Rev., 2014, 114, 9919–9986 CrossRef CAS PubMed.
- Q. Guo, C. Y. Zhou, Z. B. Ma, Z. F. Ren, H. J. Fan and X. M. Yang, Chem. Soc. Rev., 2016, 45, 3701–3730 RSC.
- L. J. Liu, D. T. Pitts, H. L. Zhao, C. Y. Zhao and Y. Li, Appl. Catal., A, 2013, 467, 474–482 CrossRef CAS.
- J. B. J. Hongyan Liu, M. Dahl, L. Fu, Z. Zeng and Y. Yin, Energy Environ. Sci., 2015, 8, 286–296 Search PubMed.
- Z. Li, S. Cong and Y. M. Xu, ACS Catal., 2014, 4, 3273–3280 CrossRef CAS.
- Y. L. Liao, W. X. Que, Q. Y. Jia, Y. C. He, J. Zhang and P. Zhong, J. Mater. Chem., 2012, 22, 7937–7944 RSC.
- B. K. Mutuma, G. N. Shao, W. D. Kim and H. T. Kim, J. Colloid Interface Sci., 2015, 442, 1–7 CrossRef CAS PubMed.
- J. H. Zhang, X. Xiao and J. M. Nan, J. Hazard. Mater., 2010, 176, 617–622 CrossRef CAS PubMed.
- T. A. Kandiel, A. Feldhoff, L. Robben, R. Dillert and D. W. Bahnemann, Chem. Mater., 2010, 22, 2050–2060 CrossRef CAS.
- X. J. Shen, B. Z. Tian and J. L. Zhang, Catal. Today, 2013, 201, 151–158 CrossRef CAS.
- Z. W. Yang, B. Wang, H. Cui, H. An, Y. Pan and J. P. Zhai, J. Phys. Chem. C, 2015, 119, 16905–16912 CAS.
- W. K. Wang, J. J. Chen, M. Gao, Y. X. Huang, X. Zhang and H. Q. Yu, Appl. Catal., B, 2016, 195, 69–76 CrossRef CAS.
- V. Likodimos, A. Chrysi, M. Calamiotou, C. Fernandez-Rodriguez, J. M. Dona-Rodriguez, D. D. Dionysiou and P. Falaras, Appl. Catal., B, 2016, 192, 242–252 CrossRef CAS.
- R. Kaplan, B. Erjavec, G. Drazic, J. Grdadolnik and A. Pintar, Appl. Catal., B, 2016, 181, 465–474 CrossRef CAS.
- Y. F. Cao, X. T. Li, Z. F. Bian, A. Fuhr, D. Q. Zhang and J. Zhu, Appl. Catal., B, 2016, 180, 551–558 CrossRef CAS.
- L. Pan, S. B. Wang, J. W. Xie, L. Wang, X. W. Zhang and J. J. Zou, Nano Energy, 2016, 28, 296–303 CrossRef CAS.
- G. H. Li, S. Ciston, Z. V. Saponjic, L. Chen, N. M. Dimitrijevic, T. Rajh and K. A. Gray, J. Catal., 2008, 253, 105–110 CrossRef CAS.
- J. Zhang, Q. Xu, Z. C. Feng, M. J. Li and C. Li, Angew. Chem., Int. Ed., 2008, 47, 1766–1769 CrossRef CAS PubMed.
- H. L. Zhao, L. J. Liu, J. M. Andino and Y. Li, J. Mater. Chem. A, 2013, 1, 8209–8216 CAS.
- X. Chen, L. Liu, P. Y. Yu and S. S. Mao, Science, 2011, 331, 746–750 CrossRef CAS PubMed.
- X. Chen, L. Liu and F. Huang, Chem. Soc. Rev., 2015, 44, 1861–1885 RSC.
- H. Tan, Z. Zhao, M. Niu, C. Mao, D. Cao, D. Cheng, P. Feng and Z. Sun, Nanoscale, 2014, 6, 10216–10223 RSC.
- L. J. Liu, Y. Q. Jiang, H. L. Zhao, J. T. Chen, J. L. Cheng, K. S. Yang and Y. Li, ACS Catal., 2016, 6, 1097–1108 CrossRef CAS.
- V. Etacheri, M. K. Seery, S. J. Hinder and S. C. Pillai, Adv. Funct. Mater., 2011, 21, 3744–3752 CrossRef CAS.
- Y. Wang, X. J. Meng, X. L. Yu, M. Zhang and J. J. Yang, Appl. Catal., B, 2013, 138, 326–332 CrossRef.
- R. J. Ramirez, C. A. P. Arellano, A. A. A. Gallegos, A. E. J. Gonzalez and S. S. Martinez, J. Photochem. Photobiol., A, 2015, 305, 51–59 CrossRef CAS.
- T. X. Liu, X. M. Li, X. Yuan, Y. Wang and F. B. Li, J. Mol. Catal. A: Chem., 2016, 414, 122–129 CrossRef CAS.
- L. Korosi, M. Prato, A. Scarpellini, J. Kovacs, D. Domotor, T. Kovacs and S. Papp, Appl. Surf. Sci., 2016, 365, 171–179 CrossRef CAS.
- M. Buchalska, M. Kobielusz, A. Matuszek, M. Pacia, S. Wojtyla and W. Macyk, ACS Catal., 2015, 5, 7424–7431 CrossRef CAS.
- H. U. Lee, Y. C. Lee, S. C. Lee, S. Y. Park, B. Son, J. W. Lee, C. H. Lim, C. J. Choi, M. H. Choi, S. Y. Lee, Y. K. Oh and J. Lee, Chem. Eng. J., 2014, 254, 268–275 CrossRef CAS.
- L. Ma, H. Han, L. Pan, M. Tahir, L. Wang, X. W. Zhang and J. J. Zou, RSC Adv., 2016, 6, 63984–63990 RSC.
- L. Pan, S. B. Wang, J. J. Zou, Z. F. Huang, L. Wang and X. W. Zhang, Chem. Commun., 2014, 50, 988–990 RSC.
- L. Pan, J. J. Zou, S. B. Wang, Z. F. Huang, A. Yu, L. Wang and X. W. Zhang, Chem. Commun., 2013, 49, 6593–6595 RSC.
- S. B. Wang, L. Pan, J. J. Song, W. B. Mi, J. J. Zou, L. Wang and X. W. Zhang, J. Am. Chem. Soc., 2015, 137, 2975–2983 CrossRef CAS PubMed.
- Y. C. Jiao, F. Chen, B. Zhao, H. Y. Yang and J. L. Zhang, Colloids Surf., A, 2012, 402, 66–71 CrossRef CAS.
- H. U. Lee, S. C. Lee, J. H. Seo, W. G. Hong, H. Kim, H. J. Yun, H. J. Kim and J. Lee, Chem. Eng. J., 2013, 223, 209–215 CrossRef CAS.
- X. Q. Gong and A. Selloni, Phys. Rev. B: Condens. Matter Mater. Phys., 2007, 76, 235307 CrossRef.
- L. R. Grabstanowicz, S. M. Gao, T. Li, R. M. Rickard, T. Rajh, D. J. Liu and T. Xu, Inorg. Chem., 2013, 52, 3884–3890 CrossRef CAS PubMed.
- J. H. Liao, L. Y. Shi, S. Yuan, Y. Zhao and J. H. Fang, J. Phys. Chem. C, 2009, 113, 18778–18783 CAS.
- X. Z. Li, C. C. Chen and J. C. Zhao, Langmuir, 2001, 17, 4118–4122 CrossRef CAS.
- S. M. El-Sheikh, G. S. Zhang, H. M. El-Hosainy, A. A. Ismail, K. E. O'Shea, P. Falaras, A. G. Kontos and D. D. Dionysiou, J. Hazard. Mater., 2014, 280, 723–733 CrossRef CAS PubMed.
- M. Rutar, N. Rozman, M. Pregelj, C. Bittencourt, R. C. Korosec, A. S. Skapin, A. Mrzel, S. D. Skapin and P. Umek, Beilstein J. Nanotechnol., 2015, 6, 831–844 CrossRef CAS PubMed.
- R. G. Li, Y. X. Weng, X. Zhou, X. L. Wang, Y. Mi, R. F. Chong, H. X. Han and C. Li, Energy Environ. Sci., 2015, 8, 2377–2382 CAS.
- X. X. Zou, J. K. Liu, J. Su, F. Zuo, J. S. Chen and P. Y. Feng, Chem.–Eur. J., 2013, 19, 2866–2873 CrossRef CAS PubMed.
- N. Shi, X. H. Li, T. X. Fan, H. Zhou, J. A. Ding, D. Zhang and H. X. Zhu, Energy Environ. Sci., 2011, 4, 172–180 CAS.
- K. C. Christoforidis and M. Fernandez-Garcia, Catal. Sci. Technol., 2016, 6, 1094–1105 CAS.
- H. Pan, B. H. Gu and Z. Y. Zhang, J. Chem. Theory Comput., 2009, 5, 3074–3078 CrossRef CAS PubMed.
Footnote |
| † Electronic supplementary information (ESI) available. See DOI: 10.1039/c6ra28658e |
| This journal is © The Royal Society of Chemistry 2017 |

