 Open Access Article
Creative Commons Attribution 3.0 Unported Licence
Improved performance of Schiff based ionophore modified with MWCNT for Fe(II) sensing by potentiometry and voltammetry supported with DFT studies†
Sanjeev Kumara,
Susheel K. Mittal *a,
Navneet Kaurb and
Ravneet Kaurb
aSchool of Chemistry and Biochemistry, Thapar University, Patiala, Punjab 147004, India. E-mail: smittal@thapar.edu
bDepartment of Chemistry, Panjab University Chandigarh, Punjab 160014, India
First published on 15th March 2017
Abstract
A novel potentiometric and voltammetric sensor for creating a cationic response for Fe(II) is introduced. These methods were applied to produce an Fe(II) selective sensor based on (E)-3-((2-aminoethylimino)methyl)-4H-chromen-4-one (IFE). The influence of variables including the amount of ionophore, plasticizers, anion excluder and multiwalled carbon nanotubes (MWCNTs) on the performance of the potentiometric sensor were investigated. The sensor for Fe(II) improvised the dynamic linear range (1 × 10⁻⁷ to 1 × 10⁻¹ mol L−1) with a slope of 27 mV per decade and a detection limit of 2.5 × 10⁻⁸ mol L−1. Selectivity of the ion selective electrode improved after modification with MWCNTs. The reduction and oxidation properties of IFE were studied by voltammetric measurements. Differential pulse voltammetry was applied to the optimized electrode and a linear dynamic range from (9.9 × 10⁻⁷ to 2.9 × 10⁻⁵ mol L−1) with a detection limit of 6.13 × 10⁻⁸ mol L−1 was obtained. The composition and morphology of the modified ion selective electrode were characterized with scanning electron microscopy. The modified electrodes have good selectivity for Fe(II) ions over a number of metal ions. It was successfully applied for direct determination of Fe(II) ions in different real life samples. Theoretical calculations also supported the complexation behavior of Fe(II) with IFE.
1 Introduction
Iron is the fourth most abundant element in the earth's crust, one of the essential trace elements in the human body and plays a vital role in plant metabolism and in various biological processes.1 The essentiality of both iron(II) and iron(III) for living organisms is well known and in each oxidation state iron plays different major roles in serving as active centers of proteins such as oxidases and reductases, being involved in oxygen transport and photosynthesis.2–6 Compared to iron(III), iron(II) is the more soluble form and is required for proper transport of oxygen to tissues by means of hemoglobin and myoglobin. Methemoglobin and myoglobin containing the oxidized form of iron lack the ability to bind to oxygen.7 Deficiency of iron in a human being leads to anemia while its excess concentration in the body causes liver and kidney damage (hemochromatosis).8 Based on the various functions of iron it is important to determine the traces of iron in medicinal, environmental chemistry and in the various biological process.Numerous analytical techniques have been used for sensing Fe(II). Conventional techniques such as spectrophotometry,9,10 FAAS (flame atomic absorption spectroscopy)11 and ICP-AES (inductively coupled plasma-atomic emission spectrometry)12,13 have been used for iron ions detection. These methods are costly, complicated and not convenient for quick online monitoring of Fe(II). Among the various sensing applications, potentiometry and voltammetry are employed for the direct quantification of trace analysis of Iron. Schiff bases, having an azomethine group –C![[double bond, length as m-dash]](https://www.rsc.org/images/entities/char_e001.gif) N– are among the most important ligands used in modern coordination chemistry due to their well-known coordinating capability and their rapid exchange kinetics.
N– are among the most important ligands used in modern coordination chemistry due to their well-known coordinating capability and their rapid exchange kinetics.
The Schiff bases system are known to perform as an efficient donor–bridge–acceptor system.14–17 The Schiff base moiety in the receptor plays key role in host–guest chemistry of IFE with Fe(II). These Schiff bases and their complexes have wide applications in different areas of electrochemistry,18 highly selective polymer membrane electrodes,19 optical sensors20 and other biological probes.21
To the best of our knowledge, there is no report available in literature regarding the electrochemical sensing of Fe(II) using MWCNT as an ion to electron transducer. In this work, a novel Fe(II) ion selective sensor prepared by the addition of MWCNT in the membrane matrix of ion selective electrode (ISE) in presence of anionic additive and plasticizer is proposed. Both the developed potentiometric and voltammetric sensors were successfully applied to detect the Fe(II) ions in pharmaceutical tablets and black tea.
2 Experimental
2.1 Materials
All reagents and solvents were of analytical reagent grade. Multi-walled carbon nanotubes–COOH (MWCNT–COOH) with 10–30 nm diameter, 1–10 μm length and >95% purity were obtained from Nanoshel (USA) and used as received. High molecular weight polyvinyl chloride (PVC), tetrahydrofuran (THF), sodium tetraphenylborate (NaTPB), various plasticizers such as o-nitrophenyl octyl ether (o-NPOE), dibutyl amine (DBA), dioctyl phthalate (DOP) were purchased from Sigma-Aldrich (India) and used as received. Bis (2-ethylhexyl) sebacate (DOS) was purchased from Alpha Aesar (India). Electrolyte tetrabutylammonium hexafluorophosphate was obtained from Sigma-Aldrich. Sodium hydroxide, hydrogen peroxide, hydrazine, nitric acid, sulphuric acid and perchloric acid were obtained from Sd Fine (India). Metal salt solutions of concentration 0.1 mol L−1 were prepared by dissolving metal nitrates in double distilled water and standardized wherever necessary. Working solutions of different concentrations were prepared by serial dilutions.2.2 Synthesis
A 100 mL round bottom flask was indicted with 4-oxo chromene-3-carbaldehyde (0.174 g, 10−3 mol L−1) and ethane-1,2-diamine (0.18 g, 3 × 10⁻³ mol L−1) in chloroform as solvent (40 mL) using a method similar to one reported for Schiff's base formation.22 The obtained mixture was stirred at room temperature for 4 hours. Receptor IFE was obtained as yellow precipitates. The precipitates thus obtained were filtered and washed thrice using methanol. The obtained receptor was confirmed using melting point, 1H, 13C NMR spectroscopy (Fig. S1 and S2†) and CHN analysis.2.3 Preparation of PVC membranes
PVC-based membranes were prepared by dissolving different amounts of the ionophore (E)-3-((2-aminoethylimino)methyl)-4H-chromen-4-one (IFE) provided by our coworkers, anion excluder NaTPB, solvent mediator o-NPOE and PVC in 5 mL of THF. Different components were mixed in terms of weight percentages as per combinations are given in Table 1. The resulting homogenous mixture was concentrated by evaporating THF and then poured in glass rings placed on smooth glass plates. To obtain a membrane with reproducible characteristics, solvent evaporation was carefully controlled; otherwise, morphology and thickness of membranes show significant variations that may ultimately affect sensor response. Transparent membrane so obtained was removed carefully from the glass plate. A 6 mm diameter piece of the membrane was cut out and glued to one end of the ‘Pyrex’ glass tube. The prepared electrode was finally conditioned for 24 h by soaking in a 0.1 mol L−1 Fe(II) solution. It is known that sensitivity, linearity, and selectivity for a given ionophore depend significantly on the membrane composition and nature of plasticizers used.23 Hence, several membranes of varying composition were prepared and investigated. The membrane that gave reproducible results and best performance characteristics was selected for detailed studies. Optimum composition of the membrane with the best performance is given in Table 1.| S. no. | Composition of membrane (%w/w) | Detection limit (mol L−1) | Linear range (mol L−1) | Slope (mV per decade) | |||||||
|---|---|---|---|---|---|---|---|---|---|---|---|
| Ionophore | PVC | o-NPOE | DBA | DOP | DOS | NaTPB | MW-CNTs | ||||
| 1 | 1 | 33 | 64 | — | — | — | 2 | — | 1.0 × 10⁻⁶ | 1 × 10⁻⁶ to 1 × 10⁻¹ | 25 |
| 2 | 2 | 33 | 63 | — | — | — | 2 | — | 3.9 × 10⁻⁶ | 1 × 10⁻⁵ to 1 × 10⁻¹ | 33 |
| 3 | 3 | 33 | 62 | — | — | — | 2 | — | 1.0 × 10⁻⁷ | 1 × 10⁻⁷ to 1 × 10⁻¹ | 27 |
| 4 | 4 | 33 | 61 | — | — | — | 2 | — | 5.0 × 10⁻⁷ | 1 × 10⁻⁶ to 1 × 10⁻¹ | 19 |
| 5 | 5 | 33 | 60 | — | — | — | 2 | — | 1.2 × 10⁻⁶ | 1 × 10⁻⁵ to 1 × 10⁻¹ | 33 |
| 6 | 3 | 33 | — | 62 | — | — | 2 | — | 1.0 × 10⁻⁶ | 1 × 10⁻⁶ to 1 × 10⁻¹ | 18 |
| 7 | 3 | 33 | — | — | 62 | — | 2 | — | 1.7 × 10⁻⁷ | 1 × 10⁻⁶ to 1 × 10⁻¹ | 14 |
| 8 | 3 | 33 | — | — | — | 62 | 2 | — | 3.1 × 10⁻⁷ | 1 × 10⁻⁶ to 1 × 10⁻¹ | 11 |
| 9 | 3 | 33 | 64 | — | — | — | — | — | 1.0 × 10⁻⁶ | 1 × 10⁻⁵ to 1 × 10⁻¹ | 24 |
| 10 | 3 | 33 | 62 | — | — | — | 2 | 0.5 | 1.6 × 10⁻⁶ | 1 × 10⁻⁵ to 1 × 10⁻¹ | 27 |
| 11 | 3 | 33 | 62 | — | — | — | — | 1 | 1.5 × 10⁻⁵ | 1 × 10⁻⁴ to 1 × 10⁻¹ | 20 |
| 12 | 3 | 33 | 62 | 2 | 1 | 2.5 × 10⁻⁸ | 1 × 10⁻⁷ to 1 × 10⁻² | 26 | |||
2.4 Sample preparation and determination
2.5 Electrochemical and spectroscopic measurements
REF‖Fe2+ test solution|ionophore (IFE) membrane|Fe2+ (0.1 mol L−1)‖REF.
A fixed concentration of Fe2+ was taken as an internal solution (0.1 mol L−1) and silver, silver chloride electrode was used as a reference electrode. Performance of the electrodes was investigated by measuring the EMF of primary ion solution, which is prepared with a concentration range of 10−9 to 10−1 mol L−1 by serial dilutions. Selectivity values (KPotA,B) were evaluated using the ‘Fixed Interference Method’.24 The initial concentration for the interfering ions in FIM was 10−2 mol L−1.
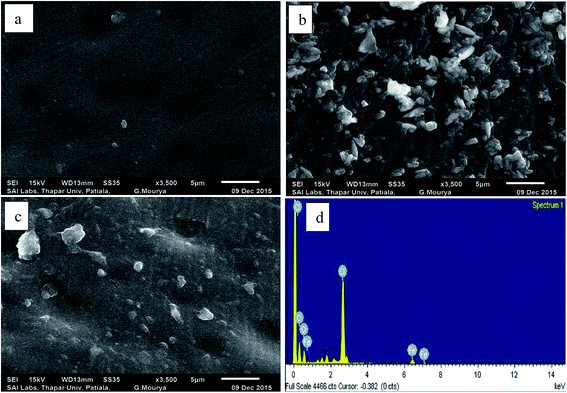
The UV-visible spectral studies were recorded on Analytic Jena Specord PC 205 spectrophotometer with a quartz cuvette (path length, 1 cm). 1H NMR spectra were recorded using a JEOL spectrometer operating at 400 MHz and 13C NMR spectra were recorded at 100 MHz. Surface morphology studies were carried out using a JSM-6510LV field emission scanning electron microscope. Elemental analysis of synthesized ionophore was done using Energy Dispersive X-ray (EDX) spectroscopy using INCA x-act Oxford instrument.
2.6 Computational details
Density functional theory (DFT) calculations were carried out with the GAUSSIAN 03W package. Full-unconstrained geometry optimization of (E)-3-((2-aminoethylimino)methyl)-4H-chromen-4-one (IFE) was carried out using B3LYP/6-31G level of theory while metal complexation studies were carried out using LAN2DZ method using basis sets B3LYP/6-31G. A solvent effect has been included in metal complexation studies through the use of IEFPCM model. Gas-phase structure was then used as starting point for further geometry optimization in the IEFPCM approach.3 Results and discussion
A new ionophore (IFE) based on chromen as the basic molecule was synthesized with an aliphatic chain containing amine and imine groups substituted at ortho position to the keto group of pyran ring. The molecule was targeted as an open-ended pseudo cyclic ring where two nitrogen atoms and the ethereal oxygen would form a pseudo cavity to host some transition metal ions. On the basis of hard–soft acid–base concept, N being a soft base would preferably capture transition metal ions as soft acids. This molecule was studied for its voltammetric, potentiometric and spectrophotometric characteristics supported with DFT calculations, to study its potential as a receptor molecule with a tendency to exhibit host–guest chemistry with target metal ions.3.1 Synthesis and characterization of IFE
Receptor IFE was synthesized by condensation reaction between the reactants 4-oxo chromene-3-carbaldehyde and ethane-1,2-diamine using chloroform as a solvent. The reaction was carried out at room temperature, with continuous stirring for 4 h (Fig. 1). The completion of the reaction i.e. formation of Schiff's base is indicated by the formation of yellow precipitate in the reaction mixture. The precipitates were filtered and washed thrice using methanol, having a yield of 92.05%. Mp ≥ 165 °C; 1H NMR (400 MHz, CDCl3–DMSO-d6) δ 2.97 (t, 2H, CH2), 3.44 (t, 2H, CH2), 5.11 (br, 2H, NH2), 6.87 (m, 2H, Ar-H), 7.37 (d, 1H, Ar-H), 7.59 (s, 1H, Ar-H), 7.77 (d, 1H, Ar-H), 8.43 (s, 1H, Schiff base); 13C NMR (100 MHz, CDCl3–DMSO-d6) δ 45.84, 56.25, 118.49, 121.29, 123.11, 125.09, 126.74, 130.52, 136.43, 149.17, 162.40, 181.26; CHN analysis: expected C: 66.65%, H: 5.59%, N: 12.96%, found C: 66.60%, H: 5.51%; N: 12.92%.3.2 UV-vis study
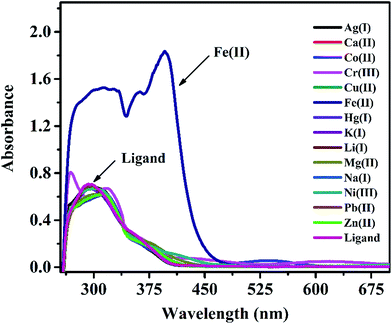
In a preliminary spectrophotometrical study, experiments were carried out with IFE on UV-vis spectrophotometer to know if it forms any complex with metal ions. UV-vis spectra of IFE (Fig. 2) were recorded in the presence of a number of metal ions like Cu2+, Ag+, Fe3+, Cd2+, Co2+, Cr3+, K+, Mg2+, Ca2+, Ni2+, Zn2+, Fe2+ in DMSO medium. As seen from the Fig. 2, the major absorption band of IFE was observed at 295 nm while a new peak appeared at 395 nm due to the interaction of Fe(II) by IFE, while no significant changes were observed with all the other metal ions. Due to this ability, we decided to incorporate IFE into a PVC membrane sensing element for monitoring the metal ion Fe(II).3.3 Factors affecting performance of the Cu2+ ion selective electrode
It is established that plasticizer which is used in the preparation of ion selective membrane should exhibit high lipophilicity, polarity, viscosity, high capacity to dissolve the substrate and adequate dielectric constant of the plasticizer. Thus, addition of plasticizer will improve the sensitivity and selectivity of the ion selective electrode.26
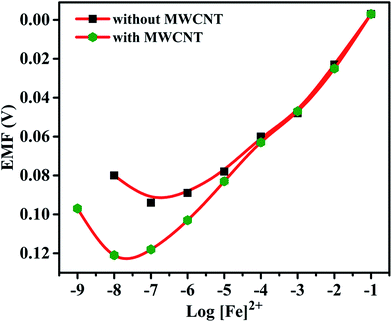
Effects of plasticizer on performance characteristics of the membrane electrode have also been studied. The use of plasticizers gives some permeable properties to the paste and may improve the mechanical stability of the sensor.27 It can be seen in Table 1 (no. 3, 6–8) that o-NPOE is more effective solvent mediator than DBA, DOS and DOP for the electrode due to its large dielectric constant.28,29 The high dielectric constant of o-NPOE was one of the reasons for low detection limit of the electrode as 1.0 × 10⁻⁷ mol L−1. Thus, o-NPOE was chosen as the best plasticizer for the working electrode. In the absence of NaTPB, the membrane did not follow a Nernstian response but a good Nernstian slope was observed with the presence of 2% NaTBP. The main function of the lipophilic salt is to enhance the ion selective membrane permselectivity (in order to enhance Nernstian response), to improve sensing selectivity (by defining the ratio of complexed to uncomplexed ionophore concentration in the membrane), and to reduce the bulk membrane resistance.30,31 Alternatively, a highly accessible surface area with a narrow distribution size, excellent electrical conductivity, and high stability of MWCNT attract the authors to explore the performance of the iron(II) electrode. As shown in Table 1 (no. 12) and represented in Fig. 3, the electrode doped with 1% MWCNT showed enhanced sensitivity observed by the lower detection limit, 2.5 × 10⁻⁸ mol L−1 compared with its analogue without MWCNT (no. 3).
 | (1) |
The selectivity coefficients of electrodes no. 3 and 12 are given in Table 2. For electrode no. 3, all the selectivity values are <1 except for Fe2+, while the values of all the interfering cations in case of electrode no. 12 are also less than one and much lower than electrode no. 3 for some cations indicating that these cations have a negligible effect on the functioning of proposed electrodes.
| Interfering ions | Log![[thin space (1/6-em)]](https://www.rsc.org/images/entities/char_2009.gif) KPotA,B KPotA,B |
|
|---|---|---|
| Electrode no. 3 without MWCNTs | Electrode no. 12 with MWCNTs (1%) | |
| Fe2+ | 0.00 | 0.00 |
| Ca2+ | −1.64 | −2.60 |
| Mg2+ | −2.45 | −2.69 |
| K+ | −2.61 | −2.00 |
| Cu2+ | −3.00 | −3.00 |
| Fe3+ | −4.00 | −4.33 |
| Cr3+ | −3.06 | −3.66 |
| Co2+ | −3.09 | −3.10 |
| Ni2+ | −1.20 | −1.60 |
| Zn2+ | −2.69 | −3.94 |
| Ag+ | −0.44 | −3.00 |
| Pb2+ | −1.17 | −1.88 |
3.4 Voltammetric discussion
In the cyclic voltammogram of IFE, there are three weak anodic peaks at −0.39 V, −0.12 V and 0.2 V, in addition to a relatively stronger peak at −1.0 V. The stronger peak is due to the supporting electrolyte using glassy carbon electrode as a working electrode. The potential was applied at a scan rate of 50 mV s−1. The anodic peaks identified in Fig. 5 as 1, 2 and 3 resulted from the anodic reactions. The most easily oxidizable species is lone pair on N atom of the terminal amine group which shows anodic peak at the lower applied potential i.e. at −0.3 V followed by the peaks at −0.1 V and +0.2 V respectively due to N atom of imine group and the oxygen atom of pyran ring. For the purpose of further characterization and applications of the ionophore in the anodic DPV, the peak maxima at −0.12 V has been chosen as a model peak.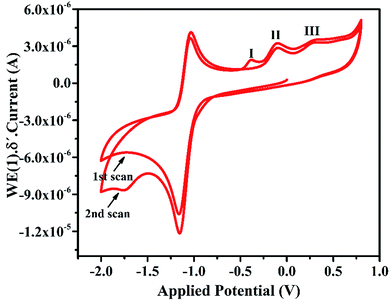 | ||
| Fig. 5 Cyclic voltammogram of 5 × 10⁻⁴ mol L−1 IFE at glassy carbon electrode in DMSO, 0.1 mol L−1 TBHP. Scan rate: 50 mVs−1. | ||
![[thin space (1/6-em)]](https://www.rsc.org/images/entities/char_2009.gif) :
:![[thin space (1/6-em)]](https://www.rsc.org/images/entities/char_2009.gif) 1. No further increase in current was noticed indicating 1
1. No further increase in current was noticed indicating 1![[thin space (1/6-em)]](https://www.rsc.org/images/entities/char_2009.gif) :
:![[thin space (1/6-em)]](https://www.rsc.org/images/entities/char_2009.gif) 1 stoichiometry of the complex with the fast and efficient response of the electrode without any lag in applied potential.
1 stoichiometry of the complex with the fast and efficient response of the electrode without any lag in applied potential.
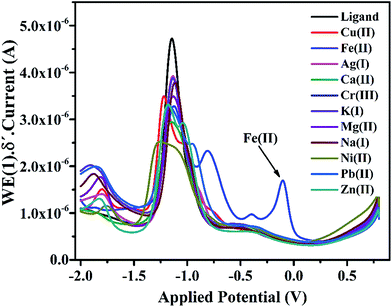
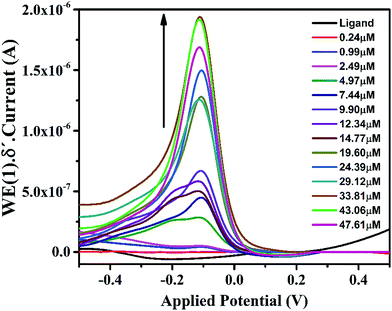
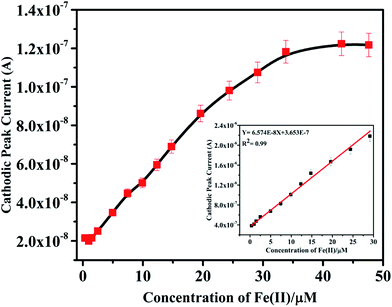
Further studies on the compound were carried out to seek its quantitative application by using standard calibration method. DPV of IFE were recorded with different concentrations of Fe(II). The plots of current magnitude plotted against different concentrations of Fe(II) are shown in (Fig. 8). The calibration curve is a linear straight line with a slope of 6.57 × 10⁻⁸ mol L−1 and a standard deviation of 1.85 × 10⁻⁹ mol L−1. Although another new peak was observed in presence of Fe(II) at −0.8 V but the peak at −0.1 V was selected for quantitative applications because of well-defined shape. It was observed that the current magnitude increased linearly with the concentration of metal ion. A good linearity was found in the concentration range of 9.9 × 10⁻⁷ mol L−1 to 2.9 × 10⁻⁵ mol L−1 Fe(II) with a correlation coefficient of 0.99. At a concentration higher than 2.9 × 10⁻⁵ mol L−1 deviation from the linearity occurred due to saturation at the electrode surface and detection limit of IFE was estimated as 6.13 × 10⁻⁸ mol L−1.
3.5 Theoretical calculations
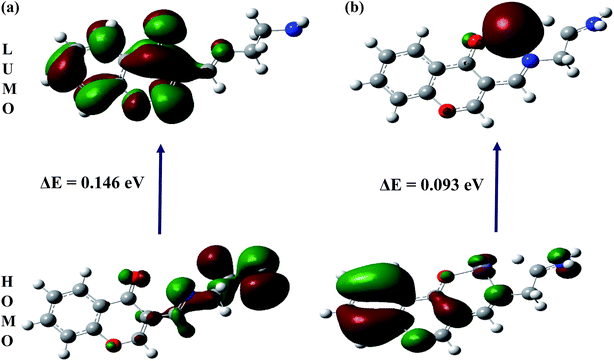
To better understand nature of the coordination of Fe(II) with IFE, energy-optimized structures of IFE and its corresponding Fe(II) complexes (Fig. 9) were obtained from density functional theory (DFT) calculations at the B3LYP level using 6-31G basis set for simple ionophore (IFE) and metal complexes using the Gaussian 03W software.The spatial distributions and orbital energies of highest occupied molecular orbital (HOMO) and lowest unoccupied molecular orbital (LUMO) of IFE and its complex IFE–Fe(II) were also determined (Fig. 10). The energy gap between HOMO and LUMO energy levels is an important parameter in determining the reactivity of the molecule.33 Quantitatively, the calculated values of energy of HOMOs and LUMOs are −0.210 eV and −0.063 eV for the free ligand (a) and −0.501 eV and −0.408 eV for the Fe(II) complex (b). The energy difference between the LUMO and HOMO is defined as the band gap energy (Eg), which can be calculated as
| Eg = ELUMO − EHOMO |
According to DFT calculations, the values of Eg in gaseous phase for the proposed free ligand and its Fe2+ complex are 0.146 eV and 0.093 eV, respectively, while during solvation process with DMSO, the Eg for IFE–Fe2+ complex alters to 0.102 eV. The results clearly indicate that the binding of Fe(II) to IFE lowered the HOMO–LUMO energy gap and stabilized the system through electron transfer. Thus, they show a favorable complexation according to proposed coordination.
The binding stoichiometry for IFE and Fe(II) was further analyzed by plotting the Job's plot (Fig. S7†). The Job's function AJob is calculated according to the equation AJob = (1 − X)A0 − A. The maximum absorbance at a molar fraction of 0.5 clearly reveals the formation of a Fe(II) complex in 1![[thin space (1/6-em)]](https://www.rsc.org/images/entities/char_2009.gif) :
:![[thin space (1/6-em)]](https://www.rsc.org/images/entities/char_2009.gif) 1 stoichiometry. In view of the experimental evidence, the 3-D molecular structure and charge transfer process occurred during the binding of Fe(II) by IFE. It was investigated by density functional theory (DFT) calculations by applying the B3LYP functional, and the basis sets 6-31G for Fe atom available in the computational code Gaussian 03W as shown in Fig. 9.
1 stoichiometry. In view of the experimental evidence, the 3-D molecular structure and charge transfer process occurred during the binding of Fe(II) by IFE. It was investigated by density functional theory (DFT) calculations by applying the B3LYP functional, and the basis sets 6-31G for Fe atom available in the computational code Gaussian 03W as shown in Fig. 9.
3.6 Analytical application
To evaluate the utility of this membrane electrode, potentiometric titration was carried out for the determination of end point. For this, 20 mL of 1 × 10⁻³ mol L−1 of Fe(II) was titrated against 1 × 10⁻² mol L−1 of K2Cr2O7 (Fig. 11). The titration plot was obtained in sigmoid shape and a sharp breakpoint exhibit a 1![[thin space (1/6-em)]](https://www.rsc.org/images/entities/char_2009.gif) :
:![[thin space (1/6-em)]](https://www.rsc.org/images/entities/char_2009.gif) 1 stoichiometry of the Fe(II) complex. After the end point, the potential response remains constant due to decrease in the concentration of Fe(II) ion. In order to examine the practical usefulness of proposed voltammetric and potentiometric sensor, these were employed in various real sample matrices such as a pharmaceutical samples and black tea. The results obtained from three replicate measurements given in Table 3 show that there is a satisfactory agreement between the results obtained using the Fe(II)-selective electrode and AAS.
1 stoichiometry of the Fe(II) complex. After the end point, the potential response remains constant due to decrease in the concentration of Fe(II) ion. In order to examine the practical usefulness of proposed voltammetric and potentiometric sensor, these were employed in various real sample matrices such as a pharmaceutical samples and black tea. The results obtained from three replicate measurements given in Table 3 show that there is a satisfactory agreement between the results obtained using the Fe(II)-selective electrode and AAS.
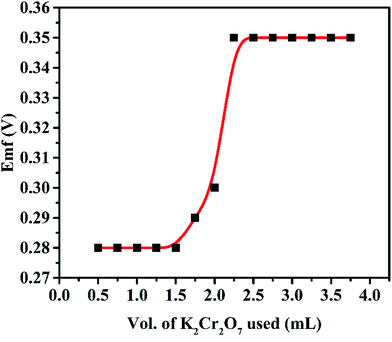 | ||
| Fig. 11 Potentiometric titration of 20 mL of Fe(II) (1 × 10⁻³ mol L−1) with K2Cr2O7 (1 × 10⁻² mol L−1). | ||
| Sample | Concentration (mol L−1) | |
|---|---|---|
| Proposed method | AAS method | |
| Multivitamin tablet | 9.2 × 10⁻⁴ (±3%) | 9.0 × 10⁻⁴ (±2%) |
| Ferrous sulphate tablet | 1.2 × 10⁻³ (±3%) | 1.2 × 10⁻³ (±2%) |
| Iron capsule | 1.3 × 10⁻² (±1%) | 1.2 × 10⁻² (±2%) |
| Black tea | 2.4 × 10⁻⁴ (±2%) | 2.5 × 10⁻⁴ (±3%) |
3.7 Comparison of performance characteristics with those of previously reported electrodes
When compared with other electrochemical methods, the proposed method for Fe(II) determination shows better selectivity, wide linear concentration range and lower detection limit. The performance characteristics of proposed electrodes were compared with previously reported electrodes for the determination of Fe(II)1,34–44 and are summarized in Table 4.| Ionophore | Electrode | Detection technique | Detection limit (mol L−1) | Ref. | |||||||||||||||||||||||||||||||||||||||||||||||||||||||||||||||||||||||||||||||||||||||||||||||
|---|---|---|---|---|---|---|---|---|---|---|---|---|---|---|---|---|---|---|---|---|---|---|---|---|---|---|---|---|---|---|---|---|---|---|---|---|---|---|---|---|---|---|---|---|---|---|---|---|---|---|---|---|---|---|---|---|---|---|---|---|---|---|---|---|---|---|---|---|---|---|---|---|---|---|---|---|---|---|---|---|---|---|---|---|---|---|---|---|---|---|---|---|---|---|---|---|---|---|---|
| a ISE = ion selective electrode.b CGE = coated graphite electrode.c HDME = hanging dropping mercury electrode. | |||||||||||||||||||||||||||||||||||||||||||||||||||||||||||||||||||||||||||||||||||||||||||||||||||
| 2,4,6-Tri(2-pyridyl)-1,3,5-triazine (TPTZ) | ISEa | Potentiometry | 4.0 × 10⁻⁷ | 34 | |||||||||||||||||||||||||||||||||||||||||||||||||||||||||||||||||||||||||||||||||||||||||||||||
| N-Phenylaza-15-crown-5 (NPA15C5) | ISE | Potentiometry | 7.5 × 10⁻⁷ | 35 | |||||||||||||||||||||||||||||||||||||||||||||||||||||||||||||||||||||||||||||||||||||||||||||||
| Chiral 2,6-bis-(carboxamide methyl ester)pyridine | ISE | Potentiometry | 4.0 × 10⁻⁶ | 36 | |||||||||||||||||||||||||||||||||||||||||||||||||||||||||||||||||||||||||||||||||||||||||||||||
| (E)-2-Acetyl-3-(butyl amino)-N-phenyl buten-2-thioamide | ISE | Potentiometry | 1.6 × 10⁻⁷ | 37 | |||||||||||||||||||||||||||||||||||||||||||||||||||||||||||||||||||||||||||||||||||||||||||||||
| 5,5′-(Propane-1,3-diyl-bis(sulfa-nediyl))bis(3-benzyl-4H-1,2,4-triazol-4-amine) | Carbon paste electrodes | Potentiometry | 1.0 × 10⁻⁷ | 1 | |||||||||||||||||||||||||||||||||||||||||||||||||||||||||||||||||||||||||||||||||||||||||||||||
| Dimethyliminocinnamyl linked rhodamine (rhodamine-dimethyliminocinnamyl) (RC) | CGE platinum electrodeb | Potentiometry, voltammetry | 7.43 × 10⁻⁸, 1.6 × 10⁻⁷ | 38 | |||||||||||||||||||||||||||||||||||||||||||||||||||||||||||||||||||||||||||||||||||||||||||||||
| New crown ether | ISE | Potentiometry | 6.7 × 10⁻⁷ | 39 | |||||||||||||||||||||||||||||||||||||||||||||||||||||||||||||||||||||||||||||||||||||||||||||||
| Iron polysaccharidic complexes | HDMEc | Voltammetry | 2.7 × 10⁻⁶ | 40 | |||||||||||||||||||||||||||||||||||||||||||||||||||||||||||||||||||||||||||||||||||||||||||||||
| 1,10-Phenanthroline, 2,2′-dipyridyl | Sol–gel electrode | Voltammetry | 4.0 × 10⁻⁶ | 41 | |||||||||||||||||||||||||||||||||||||||||||||||||||||||||||||||||||||||||||||||||||||||||||||||
| 8-Hydroxyquinoline | — | UV-visible | 4.2 × 10⁻⁷ | 42 | |||||||||||||||||||||||||||||||||||||||||||||||||||||||||||||||||||||||||||||||||||||||||||||||
| Benzimidazole and 4-diethylaminosalicylaldehyde | — | UV-visible | 1.2 × 10⁻⁶ | 43 | |||||||||||||||||||||||||||||||||||||||||||||||||||||||||||||||||||||||||||||||||||||||||||||||
| Imidazole derivative | — | UV-visible | 3.2 × 10⁻⁷ | 44 | |||||||||||||||||||||||||||||||||||||||||||||||||||||||||||||||||||||||||||||||||||||||||||||||
| (E)-3-((2-Aminoethylimino)methyl)-4H-chromen-4-one (IFE) | ISE, glassy carbon electrode | Potentiometry, voltammetry | 2.5 × 10⁻⁸, 6.13 × 10⁻⁸ | This work | |||||||||||||||||||||||||||||||||||||||||||||||||||||||||||||||||||||||||||||||||||||||||||||||
4 Conclusion
Theory and experiments on a novel potentiometric and voltammetric sensors are reported for the determination of Fe(II) based on newly synthesized ionophore (E)-3-((2-aminoethylimino)methyl)-4H-chromen-4-one (IFE). The performance of liquid membrane electrode improved with the addition of MWCNT in the membrane matrix exhibited the detection limit of 2.5 × 10⁻⁸ M. The analytical utility of the membrane electrode was validated by using it as indicator electrode and real life sample analysis for the determination of Fe(II). In addition, redox behavior of IFE was characterized by using the voltammetric technique. The chemical interaction of IFE with Fe2+ was supported by DFT studies on the ligand and the complex with the metal ion.Acknowledgements
Authors are thankful to Director, Thapar University, Patiala for providing research facilities. We are also grateful to the Sophisticated Analytical Instrumentation Lab (SAI) for SEM and EDX facilities. Authors are thankful to Dr Jasminder Singh for help in synthesis of compounds and Dr Manmohan Chhibber, Associate Professor at TU for helpful discussions.References
- R. F. Aglan, M. S. Rizk, G. G. Mohamed, A. H. El-Wahy and H. A. Mohamed, Am. J. Anal. Chem., 2014, 5, 140 CrossRef CAS.
- E. M. Hulburt and J. Rodman, Limnol. Oceanogr., 1963, 8, 263–269 CrossRef.
- J. P. Riley and R. Chester, Introduction to marine chemistry, Academic Press, London, New York, 1971 Search PubMed.
- J. H. Martin and S. Fitzwater, Nature, 1988, 331, 947–975 Search PubMed.
- J. H. Martin, R. M. Gordon and S. E. Fitzwater, Nature, 1990, 345, 156–158 CrossRef CAS.
- F. A. Cotton and G. Wilkinson, Advanced inorganic chemistry, John Wiley & Sons, New York, 1988 Search PubMed.
- A. Safavi and H. Abdollahi, Microchem. J., 1999, 63, 211–217 CrossRef CAS.
- Z. Zeng and R. A. Jewsbury, Analyst, 2000, 125, 1661–1665 RSC.
- M. Gallego, M. Garcia-Vargas and M. Valcarcel, Analyst, 1979, 104, 613–619 RSC.
- H. Kaasalainen, A. Stefansson and G. K. Druschel, Int. J. Environ. Anal. Chem., 2016, 96, 1074–1090 CrossRef CAS.
- D. Giokas, E. Paleologos, S. Tzouwara-Karayanni and M. Karayannis, J. Anal. At. Spectrom., 2001, 16, 521–526 RSC.
- J. K. Huber, Analyst, 1999, 124, 657–663 RSC.
- M. Murillo, Z. Benzo, E. Marcano, C. Gomez, A. Garaboto and C. Marin, J. Anal. At. Spectrom., 1999, 14, 815–820 RSC.
- W.-K. Oh, Y. S. Jeong, S. Kim and J. Jang, ACS Nano, 2012, 6, 8516–8524 CrossRef CAS PubMed.
- V. K. Gupta, A. K. Singh and L. K. Kumawat, Sens. Actuators, B, 2014, 204, 507–514 CrossRef CAS.
- I. Randrianjatovo-Gbalou, E. Girbal-Neuhauser and C.-E. Marcato-Romain, Anal. Biochem., 2016, 500, 12–14 CrossRef CAS PubMed.
- Y. Zhang, G.-M. Zeng, L. Tang, C.-G. Niu, Y. Pang, L.-J. Chen, C.-L. Feng and G.-H. Huang, Talanta, 2010, 83, 210–215 CrossRef CAS PubMed.
- I. Yilmaz, H. Temel and H. Alp, Polyhedron, 2008, 27, 125–132 CrossRef CAS.
- W. Al Zoubi and N. Al Mohanna, Spectrochim. Acta, Part A, 2014, 132, 854–870 CrossRef CAS PubMed.
- A. A. A. Aziz, J. Lumin., 2013, 143, 663–669 CrossRef.
- N. M. Hosny, M. A. Hussien, F. M. Radwan and N. Nawar, Spectrochim. Acta, Part A, 2014, 132, 121–129 CrossRef CAS PubMed.
- A. Kuwar, R. Patil, A. Singh, S. K. Sahoo, J. Marek and N. Singh, J. Mater. Chem. C, 2015, 3, 453–460 RSC.
- E. Bakker, P. Bühlmann and E. Pretsch, Chem. Rev., 1997, 97, 3083–3132 CrossRef CAS PubMed.
- Y. Umezawa, K. Umezawa and H. Sato, Pure Appl. Chem., 1995, 67, 507–518 CrossRef.
- T. Sokalski, A. Ceresa, M. Fibbioli, T. Zwickl, E. Bakker and E. Pretsch, Anal. Chem., 1999, 71, 1210–1214 CrossRef CAS.
- R. Eugster, T. Rosatzin, B. Rusterholz, B. Aebersold, U. Pedrazza, D. Rüegg, A. Schmid, U. E. Spichiger and W. Simon, Anal. Chim. Acta, 1994, 289, 1–13 CrossRef CAS.
- M. a. d. l. A. A. Pérez, L. P. Marín, J. C. Quintana and M. Yazdani-Pedram, Sens. Actuators, B, 2003, 89, 262–268 CrossRef.
- P. Bühlmann, E. Pretsch and E. Bakker, Chem. Rev., 1998, 98, 1593–1688 CrossRef.
- P. Bühlmann, S. Yajima, K. Tohda and Y. Umezawa, Electrochim. Acta, 1995, 40, 3021–3027 CrossRef.
- M. Telting-Diaz and E. Bakker, Anal. Chem., 2001, 73, 5582–5589 CrossRef CAS PubMed.
- T. Rosatzin, E. Bakker, K. Suzuki and W. Simon, Anal. Chim. Acta, 1993, 280, 197–208 CrossRef CAS.
- Y. Umezawa, P. Bühlmann, K. Umezawa, K. Tohda and S. Amemiya, Pure Appl. Chem., 2000, 72, 1851–2082 CrossRef CAS.
- G. Bereket, E. Hür and C. Öğretir, J. Mol. Struct.: THEOCHEM, 2002, 578, 79–88 CrossRef CAS.
- W. H. Mahmoud, Anal. Chim. Acta, 2001, 436, 199–206 CrossRef CAS.
- M. Aghaie, M. Giahi, H. Aghaie, M. Arvand, M. Pournaghdy and F. Yavari, Desalination, 2009, 247, 346–354 CrossRef CAS.
- M. Abounassif, M. Al-Omar, A. G. Amr and G. Mostafa, Drug Test. Anal., 2011, 3, 373–379 CrossRef CAS PubMed.
- M. A. Yazdely, M. A. Taher and S. Tajik, Anal. Bioanal. Electrochem., 2013, 5, 467–480 CAS.
- A. Kamal, N. Kumar, V. Bhalla, M. Kumar and R. K. Mahajan, Sens. Actuators, B, 2014, 190, 127–133 CrossRef CAS.
- G. Absalan, M. Arabi, R. Khalifeh, H. Sharghi and J. Tashkhourian, IEEE Sens. J., 2014, 14, 349–356 CrossRef CAS.
- D. Merli, A. Profumo and C. Dossi, J. Pharm. Anal., 2012, 2, 450–453 CrossRef CAS.
- N. Y. Stozhko, E. Morosanova, L. Kolyadina and Z. M. Azarova, J. Anal. Chem., 2004, 59, 865–870 CrossRef CAS.
- N. Lashgari, A. Badiei and G. M. Ziarani, J. Fluoresc., 2016, 26, 1885–1894 CrossRef CAS PubMed.
- Y. S. Kim, J. J. Lee, S. Y. Lee, T. G. Jo and C. Kim, RSC Adv., 2016, 6, 61505–61515 RSC.
- T. G. Jo, K. H. Bok, J. Han, M. H. Lim and C. Kim, Dyes Pigm., 2017, 139, 136–147 CrossRef CAS.
Footnote |
| † Electronic supplementary information (ESI) available. See DOI: 10.1039/c7ra00393e |
| This journal is © The Royal Society of Chemistry 2017 |


