 Open Access Article
Creative Commons Attribution 3.0 Unported Licence
Preparation and evaluation of modified cyanobacteria-derived activated carbon for H2 adsorption†
Jun Gao a,
Jing Xieb,
Xueyan Liua and
Hui Hu
 *a
*a
aSchool of Environmental Science & Engineering, Huazhong University of Science and Technology, Wuhan 430074, China. E-mail: huhhust@163.com; Fax: +86 2787792141; Tel: +86 2787792141
bFaculty of Materials Science and Chemistry, China University of Geosciences, Wuhan 430074, China
First published on 7th April 2017
Abstract
A series of porous carbon sorbents obtained by carbonization and activation by KOH/ZnCl2 of the abundant waste material cyanobacteria was utilized for the adsorption of H2. During experiments to determine the optimal activation parameters, the activation time had little effect, whereas the KOH/C and ZnCl2/C mass ratios and activation temperature had a significant impact on adsorption performance. Samples activated by KOH exhibited better adsorption characteristics (such as higher values of SBET, Vtotal, Vmicro, etc.) than those activated by ZnCl2. In particular, ACK-2-8, which had an SBET of 1951 m2 g−1, displayed H2 uptake capacities of nearly 17.3 mg g−1 at −196 °C and 1 bar. In addition, for evaluation of the H2 adsorption performance, N-doped and P-doped porous carbons were synthesized using HNO3, NH3·H2O and H3PO4, respectively, to modify the abovementioned cyanobacteria-derived activated carbon ACK-2-8, and exhibited H2 adsorption amounts that were 16.8%, 31.8%, and 45.7% higher, respectively, than those of undoped ACK-2-8. Furthermore, it was remarkable that P-doping in conjunction with a moderately high SBET enhanced the uptake of H2 by ACK-2-8-2, which had a smaller SBET than ACK-2-8-3 but the best uptake capacity of up to 25.2 mg g−1, and thereby showed that the relationship between the H2 adsorption capacity and SBET of these materials was scarcely linear and was therefore noticeably different from previously reported results for the uptake of H2 by other carbon sorbents. Hence, it is probable that the considerable H2 adsorption properties of the material with a moderate SBET have great potential applications for hydrogen capture or storage.
1 Introduction
Hydrogen, which is considered to be an environmentally friendly fuel, is also an energy vector that should be extensively used in the future.1,2 It is the molecule that delivers the largest amount of energy on combustion with oxygen, in which only water is generated. Moreover, it is nontoxic and its high flammability is counterbalanced by its ultrafast dissipation in the atmosphere in the event of a leakage.3 The main drawback of hydrogen arises from its very low density, which is only 90 g m−3 at 1 bar and 273 K.4 Storing the maximum amount of hydrogen in the smallest possible volume is thus a real challenge. On the other hand, high-performance energy storage systems have been extensively investigated in recent decades to meet the increasing energy demands of the world.5 Hydrogen storage is one of the most important technologies in energy storage.6,7 Thus, there is great interest in the development of suitable adsorbents for gas capture/storage that can be used for solving energy-related issues. Hydrogen storage can be achieved by adsorption, liquefaction, compression, or chemical bonding in the form of metal hydrides.8,9Recently, abundant research into porous materials including carbon materials,10–13 zeolites,14,15 metal–organic frameworks (MOFs),16–18 and covalent organic frameworks (COFs)19,20 has been widely undertaken. Among these, carbon materials have been extensively studied as candidates for hydrogen storage owing to their large surface area, well-developed pore structure, low cost, low mass density, and so on.21,22 In general, a large surface area and large micropore volume are essential for enhancing the uptake of hydrogen.23–26 Activated carbons based on carbon materials can be prepared from a large number of precursors, which include vegetable, mineral, and purely synthetic sources such as organic gels and polymers.4 However, from the viewpoint of sustainability, environment-friendliness, and continuous availability, biomass-based materials are more promising sources of carbon for porous carbons.5,27–31 Cyanobacteria are phototrophic bacteria that exist in several ecosystems across the planet and are key contributors to global photosynthesis.32 However, not all cyanobacteria are beneficial to the environment and human health; some cyanobacteria grow and expand too fast, contaminating freshwater and creating toxins.33 Owing to the abundance and accessibility of cyanobacteria, it is desirable to confirm the suitability of converting this form of biomass into active carbon for energy storage. Thus far as we know, few studies have attempted to use cyanobacteria as a precursor for activated carbon in materials science other than as supercapacitor electrodes.32 In this study, for use as low-cost, abundant and available carbon precursors, cyanobacteria (CB) obtained from Dianchi in Yunnan Province, China were prepared for precursors. As hydrogen adsorption performance requires very large surface areas and very narrow pores, activation by KOH is known to be among the best methods for obtaining carbon materials having such characteristics. Thus, cyanobacteria-based activated carbons prepared by activation by KOH and also other carbons prepared using ZnCl2 were used for comparison. As a number of studies have reported,34–37 the weight ratio of the activating agent to the precursor and the activation temperature have a great effect on the uptake of hydrogen. The influence of the activation parameters will be investigated in the following research.
The adsorption of H2 could be characterized as physisorption with weak van der Waals interaction forces. Much effort has been devoted to increasing the specific surface area because a highly porous structure is indispensable for a high adsorption capacity.38 Moreover, it is necessary to improve the adsorption efficiency and enhance the interactions between the gas and carbon material, which is of great importance for the adsorption performance of carbon materials. Heteroatom doping is widely used to modify carbon materials for efficient adsorption.39 For the adsorption of different gases, the presence of heteroatoms leads to a remarkable performance.5,38–41 Some studies suggest that the surface polarity created by the discrepancy in electronegativity between heteroatoms and carbon could enhance the interactions between gas molecules and the carbon surface.5,38 For the adsorption of hydrogen, Li et al. investigated the influence of doping nitrogen, sulfur, and phosphorus into activated carbons on the adsorption of H2, CH4 and CO2 gases, which exhibited a favorable effect on the adsorption of H2.38 In order to achieve further enhancements in adsorption efficiency, further modifications of cyanobacteria-derived activated carbon were performed by impregnation with HNO3, H3PO4, and NH3·H2O, respectively. The H2 adsorption properties were investigated systematically and the possible effects and causes were also discussed.
2 Experimental
2.1 Materials and reagents
Cyanobacteria (CB) obtained from Dianchi in Yunnan Province, China were subjected to a natural drying process for 72 h, crushed and systematically sieved to give particles with a size of 30 mesh. All chemicals were purchased from Sinopharm Chemical Reagent Co., Ltd. and were of analytical grade. Water was filtered and deionized with a Millipore Milli-Q system (Milford, MA, USA).2.2 Synthesis
Cyanobacteria-derived activated carbon (AC) was prepared by heating cyanobacteria to 400 °C at a ramp rate of 20 °C min−1 and allowing the product to dwell for 1 h in a tube furnace with N2 as flushing gas. By a subsequent activation process, a series of specific activated carbons were synthesized via the following method. AC (1 g) was first impregnated with a solution of KOH or ZnCl2 (50 mL) at predetermined KOH/C or ZnCl2/C mass ratios, and the mixture was shaken at 170 rpm at 25 °C for 24 h in a constant-temperature shaker and then dried at 105 °C for 24 h in a vacuum drying oven. The resulting dry materials were placed in a tubular furnace, followed by heating at a ramp rate of 20 °C min−1 to a predetermined activation temperature, which was maintained for 2 h. The heating process was conducted under protection by N2 flow. Finally, the activated carbon particles were washed using aq. HCl (1 mol L−1), followed by washing with deionized water until the pH value of the wash water was neutral, and the resulting samples were dried in a vacuum oven at 105 °C for 24 h. The cyanobacteria-derived activated carbons were denoted as ACK-X-Y or ACZ-X-Y, where X represents the KOH/C or ZnCl2/C mass ratio, respectively, and Y denotes the activation temperature in multiples of 100 °C.In turn, further modifications of the samples were carried out by adding ACK-2-8 to 50 mL of the corresponding 10 wt% solution of HNO3, H3PO4, or NH3·H2O, respectively, in a water bath at 60 °C for 3 h, followed by washing with distilled water until the wash water reached a neutral pH and drying at 105 °C for 24 h in a vacuum drying oven. These samples were respectively named as ACK-2-8-1, ACK-2-8-2 and ACK-2-8-3 for simplicity.
2.3 Characterization and analysis of the samples
A Diamond TG/DTA (thermogravimetric/differential thermal analysis) integrated thermal analyzer (PerkinElmer Instruments) was used to investigate the pyrolysis characteristics of the cyanobacteria. All the TGA tests were performed in high-purity nitrogen (99.99%) with a flow rate of 50 mL min−1. The test temperature ranged from room temperature to 800 °C at a heating rate of 20 °C min−1. The mass of the sample used in each experiment was 3.0 ± 0.1 mg. The elemental abundances of C, H, O, N and S were determined using a CHNS/O elemental analyzer (vario MICRO cube, Elementar). This analysis gave the mass percentages of carbon, hydrogen, nitrogen, and sulfur in the samples simultaneously, and the mass percentage of oxygen was determined by subtraction. A thermogravimetric analyzer (SDT Q600, TA Instruments) provided proximate analyses of the sample contents (that is, the moisture, volatile matter, fixed carbon, and ash contents of the material). An X-ray fluorescence spectrometer (Eagle III XRF, EDAX) was further employed for component analysis of the cyanobacteria ash. The surface functional groups of the samples were analyzed using the classic Boehm titration method.42 The acidic surface functional groups were quantified using a solution of NaHCO3, Na2CO3, and NaOH (total acidic groups), whereas the total basic surface functional groups were quantified using hydrochloric acid.43 Parallel control experiments were conducted without carbon.The physical parameters of the initial and modified AC samples, including their adsorption–desorption characteristics, BET surface area (SBET), total pore volume (Vtotal), micropore volume (Vmicro) and average pore size (![[D with combining macron]](https://www.rsc.org/images/entities/i_char_0044_0304.gif) ), were determined using an automatic specific surface area and porosity analyzer (JW-BK122W, JWGB Ltd.). The adsorbed volume of high-purity N2 was measured under different pressures at −196 °C. The SBET value was calculated using the Brunauer–Emmett–Teller method. The pore size distribution was computed using the Barrett–Joyner–Halenda method from the adsorption branch of the isotherm.44 The micropore volume (Vmicro) and micropore-specific surface area (Smicro) were determined using the t-plot method.43 All samples were characterized by microscopy techniques. Scanning electron microscopy (SEM) was performed using a Jeol JSM-6301F microscope. X-ray photoelectron spectroscopy (XPS) was carried out using a Thermo Scientific Al Kα source. A static gas adsorption instrument (NOVA 3200e, Quantachrome) was used to measure the adsorption of H2 in the pressure range of 0.01–1 bar at −196 °C.
), were determined using an automatic specific surface area and porosity analyzer (JW-BK122W, JWGB Ltd.). The adsorbed volume of high-purity N2 was measured under different pressures at −196 °C. The SBET value was calculated using the Brunauer–Emmett–Teller method. The pore size distribution was computed using the Barrett–Joyner–Halenda method from the adsorption branch of the isotherm.44 The micropore volume (Vmicro) and micropore-specific surface area (Smicro) were determined using the t-plot method.43 All samples were characterized by microscopy techniques. Scanning electron microscopy (SEM) was performed using a Jeol JSM-6301F microscope. X-ray photoelectron spectroscopy (XPS) was carried out using a Thermo Scientific Al Kα source. A static gas adsorption instrument (NOVA 3200e, Quantachrome) was used to measure the adsorption of H2 in the pressure range of 0.01–1 bar at −196 °C.
3 Results and discussion
3.1 Chemical composition and thermogravimetric analysis
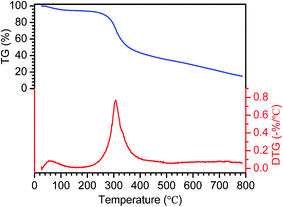
Regarding the characteristics of the cyanobacteria (CB) raw material, the results of proximate and ultimate analysis of the CB are shown in Table 1. As is observed, the mass percentages of carbon and oxygen reached 43.28% and 35.81%, respectively, whereas the moisture, volatile matter, fixed carbon, and ash contents of the material were 15.03%, 68.04%, 10.96% and 5.97%, respectively. The percentages of 43.28% C and 10.96% fixed carbon were indispensable for providing the original fundamental material framework of the modified ACs. In comparison with lignocellulosic materials,45 the higher oxygen content facilitated the formation of extensive porous architectures via the release of activated oxygen during the pyrolysis or carbonization process of CB. It can also be seen that the moisture content was much larger than those of wheat straw, rice straw or candlenut wood,45 which was ascribed to the characteristics of CB and the different preprocessing methods (only dried naturally). XRF experiments were performed on CB ash, and the corresponding component analysis is shown in Table S1 (ESI†). It is noticeable that Al2O3, P2O5, CaO, SiO2 and K2O were the main components (more than 80%) of all the ashes.TG/DTG experiments on CB were performed at a heating rate of 20 °C min−1 and the thermal decomposition was studied from ambient temperature to 800 °C, and the corresponding curves are shown in Fig. 1. It was demonstrated that the thermal decomposition of CB could be divided into three main stages. Stage I occurred in the low-temperature region (below 250 °C) and resulted in low mass loss (TG curves). It was found to be attributed to the evaporation of physically adsorbed water and light volatile compounds. Stage II, which covered the temperature range from 250 °C to 400 °C and exhibited a high mass loss percentage (approximately 50%), was ascribed to the decomposition or devolatilization of CB. The thermal degradation behavior in stage III, which was characterized by low mass loss, was probably due to the decomposition of carbonaceous materials retained in char residues. Overall, the mass losses of CB amounted to over 60% during stages I and II of the thermal decomposition process. The reason was that CB contained large amounts of volatile matter and moisture but less ash content. From the DTG curve, it could be observed that the sharp peak that appeared near 300 °C indicated the maximum mass loss rate, and then the mass loss rate practically remained unchanged with an increase in temperature above 400 °C. Therefore, this would be appropriate for selection of the carbonization temperature during the preparation of activated carbon.
3.2 Influence of activation parameters
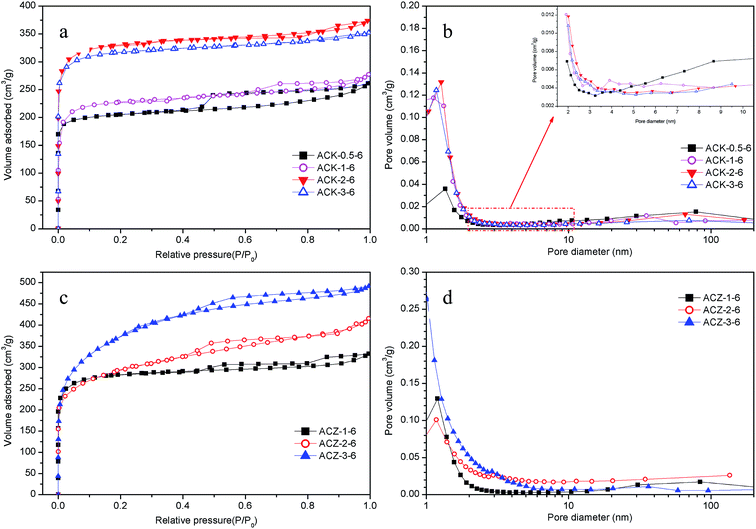
The parameters of the porous structure determined from the nitrogen adsorption isotherms and pore size distributions are important for adsorbents and could also differ considerably as the conditions used for the preparation of the activated carbon changed. Therefore, the influence of the activation parameters on the adsorption performance was evaluated using N2 adsorption/desorption isotherms (NADIs) and pore size distribution (PSD) experiments. Among all the various preparation conditions, the KOH/C or ZnCl2/C mass ratio, activation temperature, and activation time had a significant effect on activated carbons.46 To find the optimum activation time for the preparation of activated carbons, the results of preliminary experiments performed to determine the maximum BET surface areas using ACK-2-8 and ACZ-3-8, respectively, are presented in Fig. S1 (ESI†). The optimum activation time was confirmed to be 2 h, which was therefore used in the subsequent experiments.When the activation temperature and time were fixed at 600 °C and 2 h, respectively, the NADIs and PSD curves for some materials are presented in Fig. 2, and the corresponding parameters of the porous architectures are summarized in Table 2. In comparison with AC (Fig. S2 (ESI†)), the data for the activated counterparts ACK-X-6 and ACZ-X-6 all exhibited a steep increase, which indicated better absorption characteristics, i.e., SBET, Vtotal and Vmicro all displayed evident increases. The two kinds of sample with activation temperatures of 600 °C exhibited highly microporous structures with type I adsorption curves. The sharp increases in the adsorption curves at low relative pressures were indicative of the development of micro- and supermicropores. Specifically, the increase in the amount of N2 adsorbed by the samples with an increase in relative pressure exhibited a nearly linear relationship, with a hysteresis loop occurring at high relative pressures. This phenomenon implied the existence of a considerable number of mesopores, in which capillary condensation enabled the adsorption capacity to rise rapidly with respect to an increase in pressure.43
| Sample | SBET (m2 g−1) | Vtotal (cm3 g−1) | Vmicro (cm3 g−1) | ![[D with combining macron]](https://www.rsc.org/images/entities/i_char_0044_0304.gif) (nm) (nm) |
|---|---|---|---|---|
| ACK-0.5-6 | 644 | 0.404 | 0.312 | 4.81 |
| ACK-1-6 | 705 | 0.429 | 0.344 | 4.62 |
| ACK-2-6 | 1006 | 0.578 | 0.505 | 2.30 |
| ACK-3-6 | 970 | 0.545 | 0.454 | 2.23 |
| ACZ-1-6 | 901 | 0.514 | 0.428 | 2.28 |
| ACZ-2-6 | 996 | 0.640 | 0.496 | 2.31 |
| ACZ-3-6 | 1268 | 0.760 | 0.531 | 2.39 |
In addition, the amount of N2 adsorbed on activated carbon increased with an increase in the KOH/C or ZnCl2/C mass ratio (Fig. 2a and c). The maximum value was achieved at a KOH/C or ZnCl2/C mass ratio of 3, but a remarkable difference was observed in that the adsorbed amounts were nearly identical at KOH/C mass ratios of 2 and 3. Therefore, in the subsequent experiments KOH/C mass ratios of 2 and 3 and a ZnCl2/C mass ratio of 3 were utilized, respectively, to determine the optimum activation temperature.
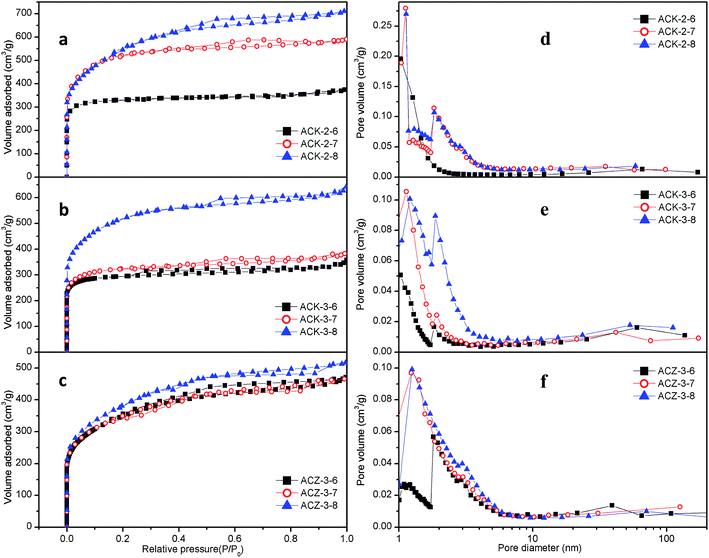
Similarly, the effect of the activation temperature on samples (denoted as ACK-2-Y, ACK-3-Y and ACZ-3-Y) was studied via N2 adsorption–desorption experiments, in which the activated carbon was prepared with KOH/C mass ratios of 2 and 3 or a ZnCl2/C mass ratio of 3 and an activation time of 2 h. The results are illustrated in Fig. 3, whereas the structural parameters are listed in Table 3. The NADIs and PSD curves almost all exhibited a type I nitrogen adsorption isotherm, which indicated the development of micro- and supermicropores at low relative pressures. The remarkable hysteresis loop that occurred at high relative pressures with some samples (i.e., ACK-2-7, ACK-2-8, and ACZ-3-8) provided evidence of the presence of some mesopores. For the materials activated by KOH (Fig. 3a–e), the amount of nitrogen adsorbed increased and reached a maximum at an activation temperature of 800 °C, whereas the volumes of micropores and mesopores underwent appreciable increases with an increase in activation temperature at KOH/C mass ratios of both 2 and 3. As can be clearly seen, samples with a KOH/C mass ratio of 2 achieved greater nitrogen adsorption performance than those with a KOH/C mass ratio of 3 at a certain activation temperature (Fig. 3a and b). For the samples activated by ZnCl2, the amount of nitrogen adsorbed first decreased in the activation temperature range of 600–700 °C and then increased with an increase in activation temperature from 700 °C to 800 °C (Fig. 3c and f). The optimal temperature was 800 °C, and the sample was denoted as ACZ-3-8.
| Sample | SBET (m2 g−1) | Vtotal (cm3 g−1) | Vmicro (cm3 g−1) | ![[D with combining macron]](https://www.rsc.org/images/entities/i_char_0044_0304.gif) (nm) (nm) |
|---|---|---|---|---|
| ACK-2-6 | 1006 | 0.578 | 0.505 | 2.30 |
| ACK-2-7 | 1694 | 0.887 | 0.700 | 2.10 |
| ACK-2-8 | 1951 | 1.092 | 0.756 | 2.27 |
| ACK-3-6 | 970 | 0.545 | 0.454 | 2.23 |
| ACK-3-7 | 1111 | 0.592 | 0.487 | 2.13 |
| ACK-3-8 | 1854 | 0.992 | 0.724 | 2.26 |
| ACZ-3-6 | 1268 | 0.760 | 0.531 | 2.39 |
| ACZ-3-7 | 1176 | 0.720 | 0.505 | 2.45 |
| ACZ-3-8 | 1310 | 0.798 | 0.547 | 2.49 |
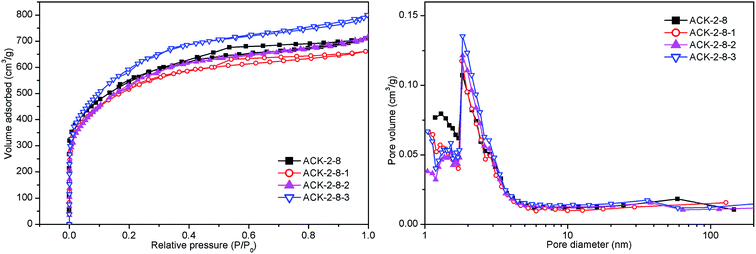
In order to obtain better pore structural parameters and greater adsorption of H2, further modified the activated carbons derived from cyanobacteria (denoted as ACK-2-8-1, ACK-2-8-2, and ACK-2-8-3, respectively) were characterized using the N2 adsorption–desorption method. The results shown in Fig. 4 and Table 4 imply that the other three samples exhibited type I nitrogen adsorption isotherms that were unexpectedly the same as that of ACK-2-8, and moreover the development of micro- and supermicropores at low relative pressures and some mesopores at higher relative pressures occurred for all the samples. It was easily found that ACK-2-8-3 exhibited the greatest adsorbed amount of N2 and the largest SBET of 2125 m2 g−1. The samples ACK-2-8-1, ACK-2-8-2 and ACK-2-8-3 on H2 adsorption would be advanced undergone succeeding study.
| Sample | SBET (m2 g−1) | Vtotal (cm3 g−1) | Vmicro (cm3 g−1) | ![[D with combining macron]](https://www.rsc.org/images/entities/i_char_0044_0304.gif) (nm) (nm) |
|---|---|---|---|---|
| ACK-2-8 | 1951 | 1.092 | 0.756 | 2.27 |
| ACK-2-8-1 | 1846 | 1.023 | 0.735 | 2.22 |
| ACK-2-8-2 | 1901 | 1.026 | 0.726 | 2.26 |
| ACK-2-8-3 | 2125 | 1.238 | 0.834 | 2.33 |
3.3 Analysis of the surface morphology and functional groups
Scanning electron microscopy (SEM) was used to investigate the morphology of the cyanobacteria-derived activated carbons that underwent carbonization alone (AC), activation by KOH (ACK-2-8) and activation by ZnCl2 (ACZ-3-8). As can be seen in Fig. 5, the morphology was influenced regardless of the activation reagent used. AC retained an irregular plate-like morphology with relatively smooth surfaces (Fig. 5a and b). After the activation process, the plate-like structure of AC was destroyed, and the porous carbons were composed of a variety of sheets with irregular shapes (Fig. 5c–f). These carbons contained uniform worm-like micropores with a random distribution, as illustrated by the SEM images. For the sample of ACK-2-8 (Fig. 5c and d), the carbon displayed an irregular worm-like structure that contained a considerable number of irregularly shaped pores of different sizes, which might be due to polymerization by KOH of the outer surface of AC when AC was impregnated with KOH via thermal treatment at high temperatures. In addition, KOH strongly etched and destroyed the plate-like morphology and the resulting activated carbon took the form of many small irregularly interconnected pores with pore walls. In comparison with ACK-2-8, ACZ-3-8 exhibited a sponge-like morphology and had wider pore sizes and fewer pores. This observation corresponded to the PSDs of the carbons deduced from the analysis of nitrogen sorption isotherms. The sponge-like morphology and wider pore size of ACZ-3-8 predicted that the H2 adsorption capacity would be greater in comparison with that of AC, which had a plate-like morphology with smooth surfaces. The interesting structure of ACK-2-8, with its irregular worm-like morphology and many small irregularly interconnected pores with pore walls, predicted that it would be expected to give the best H2 adsorption performance.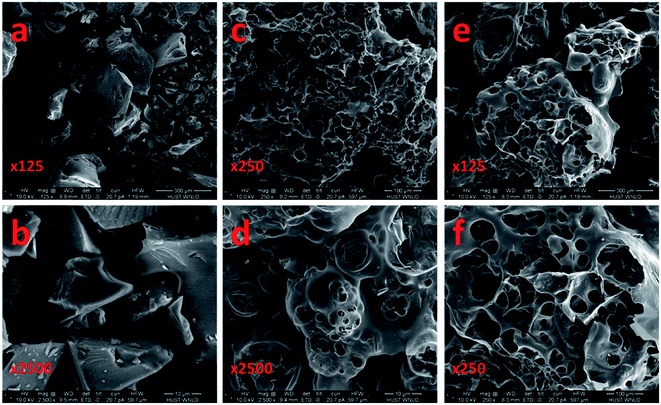 | ||
| Fig. 5 Scanning electron micrographs of samples of AC (a and b), ACK-2-8 (c and d) and ACZ-3-8 (e and f). | ||
To determine the reason for the subsequent adsorption of H2 on some cyanobacteria-derived activated carbons, the classic Boehm method was adopted to characterize the chemical properties of the adsorbent surface, and moreover X-ray photoelectron spectroscopy (XPS) was carried out to identify the nature of the nitrogen or phosphorus species that were impregnated into ACK-2-8 via modification with HNO3, H3PO4 and NH3·H2O, respectively. As can clearly be seen in Fig. S3 (ESI†), the surface functional groups on the adsorbents were mainly acidic groups except in the case of ACK-2-8-3, which after impregnation with ammonium hydroxide contained 2.7 times more basic groups than ACK-2-8. Acid groups were particularly rich in ACK-2-8-1 and were approximately 20% more abundant than in ACK-2-8. In comparison, ACK-2-8-2 displayed a moderate decrease in the number of acidic groups, and the number of basic groups scarcely varied with respect to ACK-2-8. The XPS spectra of the doped elements used to further modify the carbon material ACK-2-8 are illustrated in Fig. 6. The resulting N 1s spectra (Fig. 6a and c) and P 2p spectrum (Fig. 6b) proved that nitrogen and phosphorus were successfully integrated into the porous carbons in a systematic way. In the N 1s spectrum of ACK-2-8-1, three peaks were observed at 398.55 eV, 400.2 eV, and 401.1 eV, which corresponded to pyridinic N, pyrrolic/pyridonic N and graphitic N, respectively.47–49 However, pyrrolic N and pyridonic N species are difficult to distinguish within the range of accuracy of XPS measurements.5 The nitrogen species of ACK-2-8-3 were represented (Fig. 6c) by peaks at 398.55 and 400.2 eV, which were assigned to pyridinic N and pyrrolic/pyridonic N, respectively. Furthermore, the single peak observed at 133.1 eV in the P 2p spectrum of ACK-2-8-2 indicated that phosphorous was doped in the form of P–O.50
 | ||
| Fig. 6 XPS spectra of ACK-2-8 carbon materials with further modifications: (a) ACK-2-8-1, modified by HNO3, (b) ACK-2-8-2, modified by H3PO4, and (c) ACK-2-8-3, modified by NH3·H2O. | ||
3.4 Hydrogen adsorption performance
The adsorption of H2 was measured at −196 °C and pressures of up to 1 bar. The hydrogen adsorption isotherms and hydrogen uptake of cyanobacteria-derived activated carbon activated by KOH or ZnCl2 at 1 bar are shown in Fig. 7 and Table 5, respectively. On comparing all four samples indicated in Fig. 7, in general the adsorbents activated by KOH exhibited higher hydrogen uptake than ACZ-3-8. Moreover, it is noticeable that ACK-2-8 displayed the highest hydrogen uptake of 17.3 mg g−1, which was 49.1% higher than that of the sample of ACZ-3-8. This result was expected because ACK-2-8 also had the largest BET surface area. Furthermore, the relationship between the BET surface area and the hydrogen uptake, which is given in Fig. 7b, was close to a linear relation, as the solid line represented simple linear regression with a correlation coefficient of R2 = 0.9163. The strong correlation between the adsorption of H2 and the BET surface area demonstrated that the adsorption of H2 on cyanobacteria-derived carbons activated by KOH or ZnCl2 is mainly governed by their specific surface area, which was in accordance with previous research.5,8,38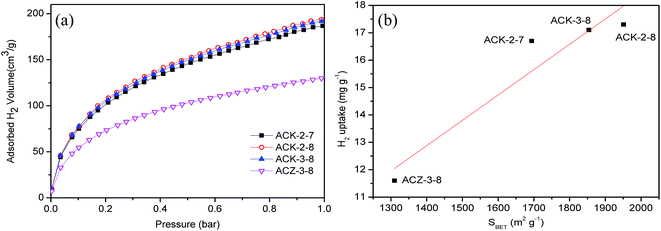 | ||
| Fig. 7 (a) Hydrogen adsorption isotherms at −196 °C and (b) relationship between the amount of H2 adsorbed (at −196 °C and 1 bar) and the BET surface area. | ||
| Sample | SBET (m2 g−1) | H2 uptake (mg g−1) | H2 uptake per SBET (mg m−2) | |
|---|---|---|---|---|
| This publication | ACZ-3-8 | 1310 | 11.6 | 0.0088 |
| ACK-3-8 | 1854 | 17.1 | 0.0092 | |
| ACK-2-7 | 1694 | 16.7 | 0.0099 | |
| ACK-2-8 | 1951 | 17.3 | 0.0089 | |
| ACK-2-8-1 | 1846 | 20.2 | 0.0109 | |
| ACK-2-8-2 | 1901 | 25.2 | 0.0133 | |
| ACK-2-8-3 | 2125 | 22.8 | 0.0107 | |
| Ref. | C-4 (ref. 8) | 3870 | 39 | 0.01 |
| P2 (ref. 31) | 1807 | <20 | <0.0111 | |
| Carbide-derived carbons10 | <3000 | 3–27 | <0.01 | |
| MOFS7 | 1132–4346 | 11.7–25.4 | <0.01 | |
| Zeolite-based carbons43 | 2254 | 22.7 | 0.0101 | |
| PC-2-800 (ref. 5) | 2919 | 27.1 | 0.0093 | |
| ACs28 | <2500 | <20 | 0.008 | |
| ACs3 | 2849 | <30 | <0.01 | |
| CAC44 | 1767–3711 | 19.2–32.1 | 0.0086 | |
| UCs45 | 1127.2 | 1.43 | 0.0013 | |
Similarly, Fig. 8 shows H2 adsorption isotherms measured at −196 °C for further modified cyanobacteria-derived activated carbons. In comparison to ACK-2-8, the H2 uptake at 1 bar increased in order from ACK-2-8-1 via ACK-2-8-3 to ACK-2-8-2, which represented the ACK-2-8 sample modified by HNO3, NH3·H2O and H3PO4, respectively. The H2 uptake at −196 °C and a pressure of 1 bar was found to reach the highest value of 25.2 mg g−1 for ACK-2-8-2, which was 45.7% higher than that for ACK-2-8 (Table 5). Nonetheless, it was remarkable that the SBET of ACK-2-8-2 was not the largest of all four samples, as the SBET of ACK-2-8-3 was 2125 m2 g−1. A weaker linear relationship was found between the adsorption of H2 and the SBET with a correlation coefficient R2 of only 0.0214, as shown in Fig. S4 (ESI†). According to the prior study of surface functional groups (Fig. S3†), it could be concluded that the presence of basic groups would inhibit the uptake of H2, whereas the amount of acidic surface groups might favor the adsorption of H2 to some extent. In comparison with the surface groups, the SBET should exert a much greater effect on the uptake of H2. Regarding the ACK-2-8-1 and ACK-2-8-3 samples, in addition to the sufficiently large SBET doping with nitrogen, as the XPS results showed, would favor the uptake of H2. This result was different from prior reports. Jiang et al.51 considered that doping with nitrogen had no obvious positive influence on the adsorption of hydrogen at 77 K. Xia et al.52 concluded that the effect of N doping on the uptake of hydrogen was only apparent when related to the surface area and pore volume associated with micropores rather than the total porosity. The differences were probably due to the different carbon precursors and doping methods used. Doping with phosphorus in ACK-2-8-2 promoted the adsorption of H2 in this study, which was in accordance with a previous investigation.38 Furthermore, when taking into account the uptake of H2 at the same time as the specific surface area of the material, it can clearly be seen from Table 5 that ACK-2-8-2 exhibited a noteworthy adsorption capacity of 25.2 mg g−1 with a modest SBET 1901 m2 g−1 and holds great potential for the adsorption of H2. In other words, ACK-2-8-2 displayed evidently superior hydrogen storage density (i.e., hydrogen uptake per surface area).
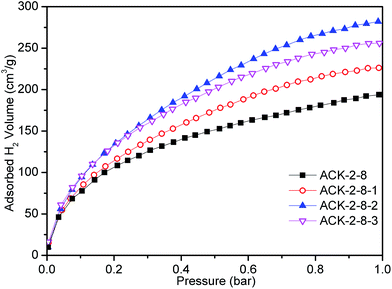 | ||
| Fig. 8 Hydrogen adsorption isotherms normalized to the adsorption capacity from 0 to 1 bar for different samples. | ||
4 Conclusions
Cyanobacteria, which are highly abundant waste materials, have been used as a cost-effective precursor to prepare a series of effective porous carbon sorbent materials by means of controlled activation with KOH/ZnCl2 and further modification by HNO3, H3PO4 and NH3·H2O, respectively. The resulting carbons activated by KOH exhibited larger amounts of micropores and mesopores and a larger specific surface area than those activated by ZnCl2, even with the optimal activation parameters, i.e., the KOH/C or ZnCl2/C mass ratio, activation temperature, and activation time. In particular, ACK-2-8, which had an SBET of 1951 m2 g−1, displayed H2 uptake capacities of nearly 17.3 mg g−1 at −196 °C and 1 bar. Moreover, we demonstrated controlled doping with nitrogen or phosphorus and achieved increases in H2 uptake via the use of moderate concentrations of HNO3, NH3·H2O and H3PO4, respectively. In comparison with the surface groups, the SBET should have a much greater effect on the uptake of H2. It was remarkable that the poor linear relationship between the adsorption of H2 and the SBET was very different from the results reported for other carbon sorbents used for the uptake of H2. Doping with phosphorus, in conjunction with a moderately large SBET, was very effective for increasing the amount of H2 adsorbed, with the result that the ACK-2-8-2 sample, which had an SBET of 1901 m2 g−1, exhibited the adsorption of the greatest amount of H2, namely, 25.2 mg g−1 at −196 °C and 1 bar, and displayed evidently superior hydrogen storage density. Therefore, the better H2 adsorption properties of this material with a moderate specific surface area hold great potential for hydrogen capture or storage in environmental and energy-related applications.Acknowledgements
This research was financially supported by the Research Fund for the Doctoral Program of Higher Education (20110142110065) and the Applied Basic Research Program of Wuhan, China (2015060101010068). The authors are grateful for the analytical support from the Analytical and Testing Center of Huazhong University of Science &Technology.References
- C. Robertson and R. Mokaya, Microporous Mesoporous Mater., 2013, 179, 151 CrossRef CAS.
- S. Schaefer, V. Fierro, M. T. Izquierdo and A. Celzard, Int. J. Hydrogen Energy, 2016, 41, 12146 CrossRef CAS.
- V. Fierro, A. Szczurek, C. Zlotea, J. F. Mareche, M. T. Izquierdo, A. Albiniak, M. Latroche, G. Furdin and A. Celzard, Carbon, 2010, 48, 1902 CrossRef CAS.
- W. Zhao, V. Fierro, N. Fernandez-Huerta, M. T. Izquierdo and A. Celzard, Int. J. Hydrogen Energy, 2012, 37, 14278 CrossRef CAS.
- Z. Q. Wang, L. X. Sun, F. Xu, H. Y. Zhou, X. J. Peng, D. L. Sun, J. C. Wang and Y. Du, Int. J. Hydrogen Energy, 2016, 41, 8489 CrossRef CAS.
- P. Moriarty and D. Honnery, Int. J. Hydrogen Energy, 2009, 34, 31 CrossRef CAS.
- J. L. C. Rowsell and O. M. Yaghi, J. Am. Chem. Soc., 2006, 128, 1304 CrossRef CAS PubMed.
- J. Choma, Ł. Osuchowski, M. Marszewski and M. Jaroniec, RSC Adv., 2014, 4, 14795 RSC.
- H. Wang, Q. Gao and J. Hu, J. Am. Chem. Soc., 2009, 131, 7016 CrossRef CAS PubMed.
- M. Sevilla and R. Mokaya, Energy Environ. Sci., 2014, 7, 1250 CAS.
- F. Cheng, J. Liang, J. Zhao, Z. Tao and J. Chen, Chem. Mater., 2008, 20, 1889 CrossRef CAS.
- M. T. Zheng, H. R. Zhang, Y. Xiao, H. W. Dong, Y. L. Liu, R. C. Xu, Y. K. Hu, B. Y. Deng, B. F. Lei and X. T. Liu, Mater. Lett., 2013, 109, 279 CrossRef CAS.
- C. Liu, Y. Chen, C. Z. Wu, S. T. Xu and H. M. Cheng, Carbon, 2010, 48, 452 CrossRef CAS.
- G. Yang, L. Zhou, X. Liu, X. Han and X. Bao, Microporous Mesoporous Mater., 2012, 161, 168 CrossRef CAS.
- K. H. Chung, Energy, 2010, 35, 2235 CrossRef CAS.
- A. G. Wong-Foy, A. J. Matzger and O. M. Yaghi, J. Am. Chem. Soc., 2006, 128, 3494 CrossRef CAS PubMed.
- Y. H. Hu and L. Zhang, Adv. Mater., 2010, 22, 117 CrossRef PubMed.
- J. W. Ren, N. M. Musyoka, H. W. Langmi, B. C. North, M. Mathe, X. D. Kang and S. J. Liao, Int. J. Hydrogen Energy, 2015, 40, 10542 CrossRef CAS.
- F. Gao, J. T. Sun and S. Meng, Nanoscale, 2015, 7, 6319 RSC.
- H. Furukawa and O. M. Yaghi, J. Am. Chem. Soc., 2009, 131, 8875 CrossRef CAS PubMed.
- M. Hirscher and B. Panella, J. Alloys Compd., 2005, 404–406, 399 CrossRef CAS.
- Q. Hu, Y. Lu and G. P. Meisner, J. Phys. Chem. C, 2008, 112, 1516 CAS.
- Z. Yang, Y. Xia and R. Mokaya, J. Am. Chem. Soc., 2007, 129, 1673 CrossRef CAS PubMed.
- E. Masika and R. Mokaya, J. Phys. Chem. C, 2012, 116, 25734 CAS.
- A. Pacuła and R. Mokaya, J. Phys. Chem. C, 2008, 112, 2764 Search PubMed.
- W. C. Xu, K. Takahashi, Y. Matsuo, Y. Hattori, M. Kumagi, S. Ishiyama, K. Kaneko and S. Iijima, Int. J. Hydrogen Energy, 2007, 32, 2504 CrossRef CAS.
- J. C. Wang, I. Senkovska, S. Kaskel and Q. Liu, Carbon, 2014, 75, 372 CrossRef CAS.
- Y. Sun and P. A. Webley, Chem. Eng. J., 2010, 162, 883 CrossRef CAS.
- M. Sevilla, A. B. Fuertes and R. Mokaya, Energy Environ. Sci., 2011, 4, 1400 CAS.
- L. Wei, M. Sevilla, A. B. Fuertes, R. Mokaya and G. Yushin, Adv. Energy Mater., 2011, 1, 356 CrossRef CAS.
- B. Hu, K. Wang, L. H. Wu, S. H. Yu, M. Antonietti and M. M. Titirici, Adv. Mater., 2010, 22, 813 CrossRef CAS PubMed.
- K. L. Wang, Y. H. Cao, X. M. Wang, Q. H. Fan, W. Gibbons, T. Johnson, B. Luo and Z. R. Gu, Energy, 2016, 94, 666 CrossRef CAS.
- D. J. Barrington and A. Ghadouani, Environ. Sci. Technol., 2008, 42, 8916 CrossRef CAS PubMed.
- D. Lozano-Castello, M. A. Lillo-Rodenas, D. Cazorla-Amoros and A. Linares-Solano, Carbon, 2001, 39, 741 CrossRef CAS.
- W. Zhao, V. Fierro, C. Zlotea, E. Aylon, M. T. Izquierdo, M. Latroche and A. Celzard, Int. J. Hydrogen Energy, 2011, 36, 5431 CrossRef CAS.
- D. Lozano-Castello, D. Cazorla-Amoros, A. Linares-Solano and D. F. Quinn, Carbon, 2002, 40, 989 CrossRef CAS.
- M. Armandi, B. Bonelli, K. Cho, R. Ryoo and E. Garrone, Int. J. Hydrogen Energy, 2011, 36, 7937 CrossRef CAS.
- D. Li, W. B. Li, J. S. Shi and F. W. Xin, RSC Adv., 2016, 6, 50138 RSC.
- J. P. Paraknowitsch and A. Thomas, Energy Environ. Sci., 2013, 6, 2839 CAS.
- X. Ma, M. Cao and C. Hu, J. Mater. Chem. A, 2013, 1, 913 CAS.
- B. Ashourirad, A. K. Sekizkardes, S. Altarawneh and H. M. ElKaderi, Chem. Mater., 2015, 27, 1349 CrossRef CAS.
- H. P. Boehm, Carbon, 1994, 32, 759 CrossRef CAS.
- H. Hu, X. Lu, F. Wang, J. J. He, J. Li and M. H. Fan, Carbon, 2011, 49, 2197 CrossRef CAS.
- M. S. Kim, J. B. Jeon and J. Y. Chang, J. Mater. Chem., 2012, 22, 20713 RSC.
- L. Deng, T. Zhang and D. F. Che, Fuel Process. Technol., 2013, 106, 712 CrossRef CAS.
- H. R. Wei, S. B. Deng, B. Y. Hu, Z. H. Chen, B. Wang, J. Huang and G. Yu, ChemSusChem, 2012, 5, 2354 CrossRef CAS PubMed.
- Y. J. Qiu, J. Yu, T. N. Shi, X. S. Zhou, X. D. Bai and J. Y. Huang, J. Power Sources, 2011, 196, 9862 CrossRef CAS.
- J. Yin, Y. J. Qiu and J. Yu, Electrochem. Commun., 2013, 30, 1 CrossRef CAS.
- F. Kapteijn, J. A. Moulijn, S. Matzner and H. P. Boehm, Carbon, 1999, 37, 1143 CrossRef CAS.
- C. H. Choi, S. H. Park and S. I. Woo, ACS Nano, 2012, 6, 7084 CrossRef CAS PubMed.
- J. H. Jiang, Q. M. Gao, Z. J. Zheng, K. S. Xia and J. Hu, Int. J. Hydrogen Energy, 2010, 35, 210 CrossRef CAS.
- Y. Xia, G. S. Walker, D. M. Grant and R. Mokaya, J. Am. Chem. Soc., 2009, 131, 16493 CrossRef CAS PubMed.
- J. J. Cai, L. J. Li, X. X. Lv, C. P. Yang and X. B. Zhao, ACS Appl. Mater. Interfaces, 2014, 6, 167 CAS.
- Z. Geng, C. M. Zhang, D. B. Wang, X. Y. Zhou and M. Cai, J. Energy Chem., 2015, 24, 1 CrossRef.
- J. J. Cai, M. D. Yang, Y. L. Xing and X. B. Zhao, Colloids Surf., A, 2014, 444, 240 CrossRef CAS.
Footnote |
| † Electronic supplementary information (ESI) available. See DOI: 10.1039/c6ra28660g |
| This journal is © The Royal Society of Chemistry 2017 |

