 Open Access Article
Creative Commons Attribution 3.0 Unported Licence
The impact of graphene nano-plates on the behavior of novel conducting polyazomethine nanocomposites
Mahmoud A. Hussein *ab,
Reda M. El-Shishtawyac and
Abdullah Y. Obaida
aDepartment of Chemistry, Faculty of Science, King Abdulaziz University, P.O. Box 80203, Jeddah, Saudi Arabia 21589. E-mail: mahhussein74@yahoo.com; mahmali@aun.edu.eg; maabdo@kau.edu.sa
bPolymer Chemistry Lab. 122, Chemistry Department, Faculty of Science, Assiut University, P.O. Box 71516, Assiut, Egypt
cDyeing, Printing and Textile Auxiliaries Department, Textile Research Division, National Research Centre, Dokki, Cairo, Egypt
First published on 3rd February 2017
Abstract
The aim of the current work was to synthesize a new series of polyazomethine/graphene nano-plate nanocomposites in the form of PAMs/GNPa–e. Different compositions were fabricated according to the percentage of GNP loading. The composites were formed in situ during the polymerization reaction for the formation of pure PAMs. The corresponding pre-monomer (1), aminothiazole monomer (2) and consequently, new conducting PAMs polymer were synthesized. The structures of these compounds were confirmed by elemental and spectral analyses, including FT-IR, 1H-NMR and 13C-NMR. The pure PAMs and PAMs/GNPa–e nanocomposites were characterized using available characterization techniques. X-ray diffraction (XRD), thermal analyses, conductivity tests and scanning electron microscopy (SEM) were also performed. Furthermore, a comparative study was carried out to demonstrate the role of GNP inclusion into the PAMs polymer matrix in the form of nanocomposites. Intense absorption peaks related to GNPs and pure PAMs were observed in the FT-IR spectra of our new PAMs/GNPa–e nanocomposites, and these peaks represent a good reference for the fabrication of such nanocomposites. The thermal degradation of pure PAMs and the PAMs/GNPa–e nanocomposites occurred in two steps. The degradation steps were dependent upon the nature of the desired nanocomposites, which was mainly related to the decomposition of the pure PAMs content. Moreover, SEM images offered more obvious evidence for the formation of the nanocomposites. In addition, an electrical conductivity test showed a complete change in the conductivity behavior of PAMs upon GNP loading, from a very poor state to semiconductor behavior in the PAMs/GNPa–e nanocomposites.
1. Introduction
Organic/inorganic nanocomposites and in particular, those involving a polymer matrix, have attracted wide attention in different fields, especially in the field of material science, towards the development new efficient materials with excellent properties such as low cost, low density and photoconductivity for electronics, in addition to many other fantastic properties reported in the literature.1–5 Recently, these nanocomposites have been used instead of steel, for example, due to their low specific weight and high strength. Much more attention has been given to polymer nanocomposites, perhaps due to their improved properties, as reported in the reinforcement of graphene with polymers.6–8 Several attempts have been made to reinforce inorganic particles with polymers at the nanoscale.9–11 More specifically, carbon nanotubes, graphene oxide and graphene nano-plates are considered to be the most important nano-materials, which exhibit a wide variety of properties in different fields of application. It is one of our main aims to study the effect of nano-fillers on polyazomethine chains, and to investigate graphene nano-plates (GNPs), which have electrical properties sufficient to completely change the conducting behaviors of any material, such as our synthesized polyazomethine. Besides that, GNPs and other nano-fillers such as CNTs have other exceptional properties, leading to new materials with excellent properties such as high specific surface areas, unique size distributions and tube structures in the case of CNTs. Such properties permit nano-fillers to be used in different industrial applications such as sensing, inorganic pollutant remediation, catalysis, solar cells, composites, medical applications, photonics and fuel cells.12–19 In the present work, a new series of polyazomethine/graphene nanocomposites of different compositions was synthesized. In situ nanocomposite formation was achieved during the polymerization for the preparation of PAMs. The new composites were characterized using characterization techniques including FT-IR spectroscopy measurements, thermal analyses (TGA, DTG and DTA), X-ray diffraction (XRD), conductivity tests, and scanning electron microscopy (SEM). Then, a comparative study was carried out to demonstrate the role of GNP inclusion in the polyazomethine polymer chains.2. Experimental
2.1. Chemicals, solvents and reagents
Diaryl ether and chloroacetyl chloride were purchased from Merck. Anhydrous aluminum chloride was purchased from Sigma-Aldrich. Absolute ethanol, carbon disulphide and concentrated hydrochloric acid were all purchased from BDH. Thiourea and sodium acetate were also purchased from BDH. All the above mentioned chemicals and reagents were used as received without any further purification. Furthermore, graphene nano-plates (GNPs) and terephthalaldehyde were also purchased from Sigma-Aldrich and were used as received.2.2. Preparation of monomer and pre-monomer
4,4′-Di(chloroacetyl)diaryl ether pre-monomer (1) as well as 4,4′-di(2′′-aminothiazol-4′′-yl)diaryl ether monomer (2) were prepared as previously reported in our previous studies as follows.20,21![[thin space (1/6-em)]](https://www.rsc.org/images/entities/char_2009.gif) :
:![[thin space (1/6-em)]](https://www.rsc.org/images/entities/char_2009.gif) 40 mmol. The whole mixture was cooled to 0 °C under constant stirring using an ice-bath. Simultaneously, 10.68 g (80 mmol) of aluminum chloride was added slowly to the mixture. The reaction was completed after 6 hours; then carbon disulfide was removed from the reaction mixture by evaporation. The residue was transferred into cold hydrochloric acid. A yellow precipitate was obtained and collected by filtration, and was then crystallized from ethanol. The product melting point was measured to be 103 °C and its yield was calculated at 82%.
40 mmol. The whole mixture was cooled to 0 °C under constant stirring using an ice-bath. Simultaneously, 10.68 g (80 mmol) of aluminum chloride was added slowly to the mixture. The reaction was completed after 6 hours; then carbon disulfide was removed from the reaction mixture by evaporation. The residue was transferred into cold hydrochloric acid. A yellow precipitate was obtained and collected by filtration, and was then crystallized from ethanol. The product melting point was measured to be 103 °C and its yield was calculated at 82%.2.3. Synthesis of polyazomethine conducting polymer
The new desired conducting polyazomethine polymer was synthesized using ideal polycondensation procedures as follows: a mixture of monomer (2) 0.732 g and terephthalaldehyde 0.268 g was suspended in 40 mL of absolute ethanol inside a three-necked flask under an inert nitrogen atmosphere. Drops of piperidine were added to the mixture at room temperature, and the mixture was stirred during each addition. After the additions were complete, the reaction mixture was heated to ∼80 °C with constant stirring for 10–12 hours. In the early stages of the reaction, the desired polymer product began to precipitate and the amount increased with increasing reaction time. The reaction was completed after 10–12 hours. A yellow solid was separated out, collected and washed with simple hot organic solvents during filtration. The new product then was dehydrated under reduced pressure (1 mmHg) at 70 °C for two days. Anal. calcd for C26H16N4S2O: C, 67.24; H, 3.45; N, 12.07; S, 13.79. Found: C, 65.80; H, 3.83; N, 13.05; S, 14.14. IR (ATR) ν cm−1: at 3080 (w, CH aromatic stretching), at 1610 (s, C![[double bond, length as m-dash]](https://www.rsc.org/images/entities/char_e001.gif) N azomethine group), at 1620–1590 cm−1 (m, phenylene rings), at 1255–1260 (s, ether bond), and at 750 (w, C–S carbon sulfur single bond). 1H-NMR (DMSO-d6, ppm): δ = 8.2–8.3 (s,s 2H, 2CH
N azomethine group), at 1620–1590 cm−1 (m, phenylene rings), at 1255–1260 (s, ether bond), and at 750 (w, C–S carbon sulfur single bond). 1H-NMR (DMSO-d6, ppm): δ = 8.2–8.3 (s,s 2H, 2CH![[double bond, length as m-dash]](https://www.rsc.org/images/entities/char_e001.gif) N azomethine), 7.73–7.55 (s,s, 2H, aromatic H thiazole ring) 8.1–7.87 and 7.18–6.92 (m, 12H, H of aromatic diaryl ether and H of p. pheneylene). 13C-NMR (DMSO-d6, ppm): δ = 175.2, 163, 159.4, 151.6, 136.9, 134.8, 133, 128.77, 127, 125.2, 118 and 110, in agreement with the submitted structure.
N azomethine), 7.73–7.55 (s,s, 2H, aromatic H thiazole ring) 8.1–7.87 and 7.18–6.92 (m, 12H, H of aromatic diaryl ether and H of p. pheneylene). 13C-NMR (DMSO-d6, ppm): δ = 175.2, 163, 159.4, 151.6, 136.9, 134.8, 133, 128.77, 127, 125.2, 118 and 110, in agreement with the submitted structure.
2.4. Synthesis of PAMs/GNPa–e nanocomposites
In a typical procedure, a new series of PAMs/GNPa–e was synthesized using an in situ polymerization procedure depending mainly on a solution polycondensation process. The polymerization process was carried out first at room temperature for 30 min. Then it was heated up to 80 °C under a nitrogen atmosphere for 12 hours and the remaining procedure was carried out in the same way as that for the synthesis of pure PAMs described above. The produced nanocomposites possessed a fixed weight and ratio of monomer (2) and terephthalaldehyde. Different loadings of GNPs were introduced (wt by wt%), with respect to the total weight of the aminothiazole monomer (2). GNP loadings of 2%, 5%, 10%, 20% and 30% were employed for each composite. The PAMs/GNPa–e nanocomposites were synthesized as follows: the calculated amounts of GNP nanoparticles were suspended into a mixture of monomer (2) 0.732 g and terephthalaldehyde 0.268 g in 40 mL of absolute ethanol. The whole mixture was ultrasonicated for 15 min. After that, drops of piperidine were added to the mixture and it was stirred during the addition. Simultaneously, a nitrogen atmosphere was allowed to flow over the reaction. Then, the reaction mixture was heated to ∼80 °C with constant stirring for 12–14 hours. The desired nanocomposites were separated out by filtration, washed with deionized water and hot ethanol in sequence, and then dried under vacuum at 70.0 °C for two days. Table 1 represents the suggested symbols and chemical compositions for pure PAMs and PAMs/GNPa–e.| Products | Monomer (1) (weight, g) | Terephthalaldehyde (weight, g) | GNP% (weight, g) |
|---|---|---|---|
| Pure PAMs | 0.732 g | 0.268 g | — |
| PAMs/GNPa | 0.732 g | 0.268 g | 2% (0.02) |
| PAMs/GNPb | 0.732 g | 0.268 g | 5% (0.05) |
| PAMs/GNPc | 0.732 g | 0.268 g | 10% (0.10) |
| PAMs/GNPd | 0.732 g | 0.268 g | 20% (0.20) |
| PAMs/GNPe | 0.732 g | 0.268 g | 30% (0.30) |
2.5. Identification and characterization techniques
The melting points of the pre-monomer (1) and monomer (2) were determined on a Gallen-kamp melting point apparatus with a digital thermometer. Elemental analysis (C, H, N) was performed on a CHN rapid analyzer. Fourier transform infrared (FT-IR) spectra were obtained using an ATR smart part technique in the wave number range 4000–400 cm−1 on a Nicolet-6700 Thermo Fisher Scientific FT-IR spectrophotometer. 1H-NMR and 13C-NMR spectra were recorded on a Bruker Advance 800 MHz using DMSO-d6 as a solvent. TMS was used as the interior reference. The X-ray diffractograms of the pure PAMs and PAMs/GNPa–e were collected using a Philips X-ray PW1710 diffractometer, and Ni-filtered CuKα radiation in the 2θ range from 10 to 80°. Thermal analyses (TGA, DTG and DTA) measurements were obtained on a TA 2000 thermal analyzer. All measurements were carried out in an air flow under the same conditions with a heating rate 10°C min−1. The morphological features of the pure PAMs and PAMs/GNP composites were imaged using SEM on a Jeol JSM-5400 LV instrument. Such SEM images were recorded using a Penta Z Z-50P Camera with Ilford film. The microscope was operated at an accelerating voltage of 15 kV and a 10 mm working distance from the carbon film. The electrical conductivity was measured using a conductivity cell. The samples were converted into compressed disks (under a pressure of up to 2 tons per cm2) of 1 cm in diameter and about 1–2 mm in thickness. Silver paste was used to coat the compressed disks on both sides. To test for ohmic contact, a Hioki LCR high tester 3531 was used, employing a two-probe method, as a function of temperature up to 900 K and frequency (10 kHz to 5 MHz).3. Results and discussion
3.1. Conducting PAMs synthesis and fabrication of PAMs/GNPa–e nanocomposites
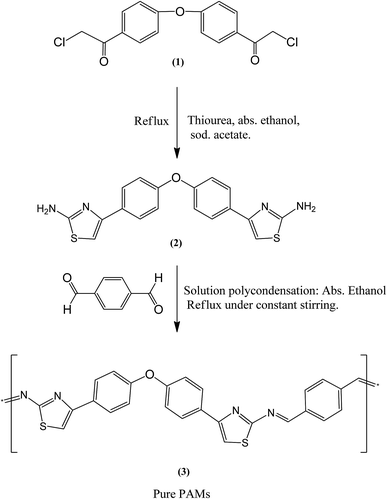
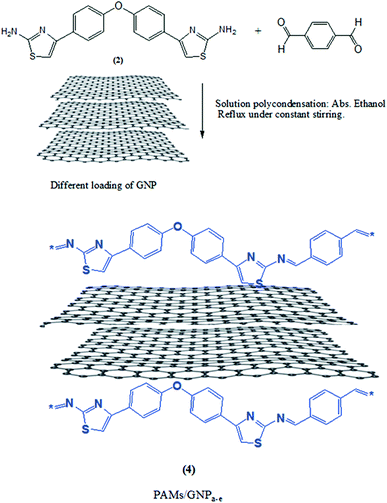
Experimentation led us to conclude that ethyl alcohol is the preferable solvent for the polymerization of PAMs. PAMs polymer is strong enough to be precipitated as a product when the polymerization process has started. A new conducting polyazomethine polymer based on diaryl ether was synthesized by the reaction of a thiazole based monomer (2) and terephthalaldehyde using a polycondensation method.21–23 Prior to the polymerization reaction, the 4,4′-di(chloroacetyl)diaryl ether pre-monomer (1) and the 4,4′-di(2′′-aminothiazol-4′′-yl)diaryl ether monomer (2) were prepared and their chemical structures were analyzed by obtaining both elemental and spectral data as reported in our previous studies.20,21 The synthetic route for the synthesis is given in Fig. 1. The chemical structure of this new conducting polymer was obtained using elemental analysis, FT-IR and NMR spectroscopy. The structure was confirmed by its corresponding FT-IR and NMR spectral data. FT-IR results obtained using an ATR technique show several major distinctive absorption peaks, including azomethine peaks, CH stretching of aromatics and C–O–C ether peaks. Moreover, the 1H-NMR, and 13C-NMR results show distinctive symmetrical peaks which are in agreement with the submitted structure as explained in the experimental section.During the synthesis of the designed products, the polymerization process was adjusted in order to optimize the fabrication process. In a typical procedure, a new series of PAMs/GNPa–e nanocomposites was fabricated by an in situ polymerization procedure.24 The fabrication procedures are similar to the earlier aforesaid procedures for PAMs. This fabrication method is mainly based on different loadings of GNPs in the presence of a fixed weight aminothiazole monomer (2) and terephthalaldehyde. The fabrication procedure begins at room temperature, followed by heating under a nitrogen atmosphere. Fig. 2 shows a schematic representation of this fabrication procedure.
3.2. Identification and characterization of PAMs/GNPa–e composites
As diverse identification and characterization techniques, FT-IR spectroscopy, wide angle XRD diffraction, TGA thermal analyses and SEM scanning electron microscopy were employed in order to identify and to characterize the structures of the fabricated PAMs/GNPa–e nanocomposites.The FT-IR results give clear evidence for the bonding interaction between PAMs and the PAMs/GNPa–e nanocomposites. FT-IR spectroscopy confirms that pure PAMs physically interacts with the PAMs/GNPa–e nanocomposites in the composite materials. This type of interaction is considered an important method of bonding between any polymer matrix and its imbedded nano-filler. The FT-IR spectroscopic analysis for pure PAMs and PAMs/GNPa–e nanocomposites formulations was performed between 4000 and 400 cm−1. Fig. 3 displays the FT-IR spectra for pure PAMs and the PAMs/GNPa–e nanocomposites. The spectrum in Fig. 3a shows intensive characteristic absorption peaks for pure PAMs. The peak at 1610 cm−1 is attributed to C![[double bond, length as m-dash]](https://www.rsc.org/images/entities/char_e001.gif) N in the azomethine groups. Another peak at around 1255–1260 cm−1 is assigned to C–O ether bonds. Furthermore, the peaks at 3080 cm−1 and 1620–1590 cm−1 are due to the CH stretching of aromatic, phenylene rings, while that at 750 cm−1 is due to C–S carbon sulfur single bonds.
N in the azomethine groups. Another peak at around 1255–1260 cm−1 is assigned to C–O ether bonds. Furthermore, the peaks at 3080 cm−1 and 1620–1590 cm−1 are due to the CH stretching of aromatic, phenylene rings, while that at 750 cm−1 is due to C–S carbon sulfur single bonds.
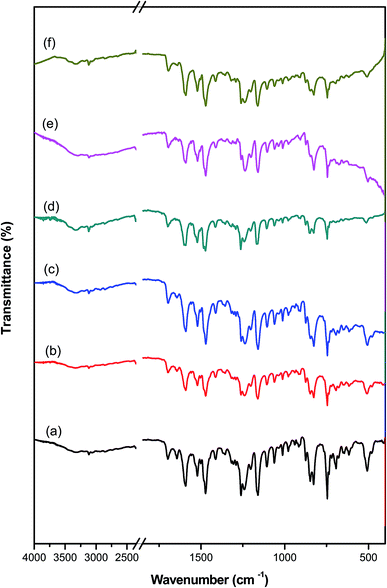 | ||
| Fig. 3 FT-IR spectra of pure polyazomethine and its nanocomposites: (a) pure PAMs, (b) PAMs/GNPa, (c) PAMs/GNPb, (d) PAMs/GNPc, (e) PAMs/GNPd and (f) PAMs/GNPf. | ||
Fig. 3b–e show the FT-IR results for PAMs/GNPa–e. The immersion of GNPs into the pure PAMs polymer matrix somewhat changes its IR spectrum. The nanocomposite formation was confirmed by FT-IR spectra (Fig. 3b–e). The spectra of our new nanocomposites show intensive absorption peaks related to GNPs.25–28 Furthermore, all of the adsorption peaks related to pure PAMs can be clearly observed in the spectra of the PAMs/GNPa–e nanocomposites as shown in Fig. 3b–e.
Fig. 4 shows the XRD diffraction patterns for pure PAMs and the fabricated PAMs/GNPa–e nanocomposites. The XRD patterns were obtained over the range of 2θ = 4–80°. The 2θ scan for pure PAMs shows three crystalline diffraction peaks. These three crystalline peaks appear at nearly 2θ = 18.8°, 20.0° and 72.5°, and are due to the higher degree of crystallinity and highly ordered crystal structure of this new conducting PAMs material. Moreover, the corresponding diffraction patterns show irregular halo peaks located within the range of 27.2–30.3° and at 2θ = 41.6°, indicating a minimal level of crystallinity. These diffraction peaks are considered to be intermediate between organized and unorganized interferences. These peaks are only revealed in the PAMs diffractogram. Furthermore, XRD diffraction patterns for the PAMs/GNPa–e nanocomposites with different GNP loading clearly indicate the formation of our targeted composite products. The previously mentioned patterns exhibit a slight overlap of the diffraction peaks, which corresponds to the PAMs and GNP loading ratios. The GNPs present a strong diffraction peak at around 2θ = 25.56° (002) characteristic of carbon-based materials, which corresponds to graphite planes. Two more tiny peaks are present at about 2θ = 44.27° and 2θ = 52.67°.29,30 All of the previously mentioned peaks can be clearly seen in the XRD pattern for the PAMs/GNPa–e nanocomposites, as shown in Fig. 4. Furthermore, no more organized and/or unorganized bands that may be related to another crystal structure, impurities and/or phases have been found in the diffractograms of our composites.
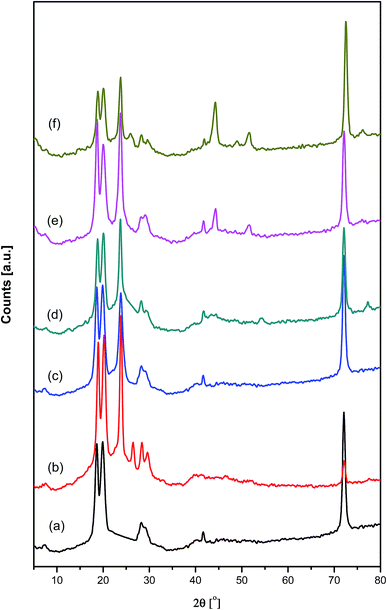 | ||
| Fig. 4 XRD diffraction patterns of pure polyazomethine and its nanocomposites: (a) pure PAMs, (b) PAMs/GNPa, (c) PAMs/GNPb, (d) PAMs/GNPc, (e) PAMs/GNPd and (f) PAMs/GNPf. | ||
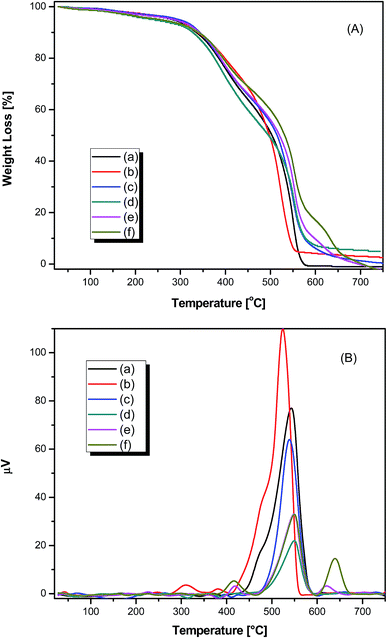
The thermal properties of pure PAMs and the PAMs/GNPa–e nanocomposites were probed using TGA, DTG and DTA in air with a 10 °C min−1 heating rate as illustrated in Fig. 5. The thermogravimetric (TG) curves of all samples exhibit the same pattern of decomposition and show a small weight-loss that almost finishes before 170 °C. Such behavior is due to the removal of moisture and attached solvents. The TG curves are given in Fig. 5a. The T10–T50 values represent the temperatures for variable % weight losses at 10%, 20%, 30%, 40% and 50% as illustrated in Table 2. The initial decomposition of these products occurs a few degrees before T10. For pure PAMs, the degradation mainly occurs in two steps. The first step starts at 272.19 °C and ends at 458.39 °C, whereas the second degradation step starts at 458.39 °C and ends at 748.66 °C. For the other composite PAMs/GNPa–e products, the degradation also occurs mainly in two steps. The average degradation rate for the first step is comparatively faster than that observed for the second step. The degradation steps are dependent upon the nature of the fabricated composites, and mainly involve the degradation of the polyazomethine polymer chains. Such degradation involves scission of azomethine bonds, as well as scission of ether linkages, followed by the release of loose concise chains depending on the type of composite material, leading to the formation of burnt carbon particles as final products.31–33 Upon closer look at the TG curves, it is easy to detect that the fast degradation step in all samples starts at temperatures higher than 300 °C, even for pure PAMs. Thus, it is quite acceptable to claim that these products are thermally stable up until quite high temperatures. The maximum composite degradation temperature (CDTmax) corresponds to the temperature at which the detected weight loss reaches its maximum. CDTmax can be easily detected from the DTA curves shown in Fig. 5b. CDTmax for all the samples are similar and appear in the same range of 538–555 °C, as illustrated in Table 2. All measured values are in agreement with the values obtained from the TGA and DTG curves. PAMs/GNPa shows the lowest CDTmax of all the fabricated samples (538 °C), while PAMs/GNPd,e shows the highest CDTmax (555 °C). The order of the CDTmax values is as follows: PAMs/GNPd,e > PAMs/GNPc > PAMs > PAMs/GNPb > PAMs/GNPa. The thermal stability of the fabricated products mainly depends on the amount of GNP that acts as reinforcements within the PAMs polymer matrix. This observation clearly appears at T50 and at all other temperatures for all composites except PAMs/GNPa.
| Products | CDTmaxa (°C) | Temperature (°C) for various percentage decompositionsb | ||||
|---|---|---|---|---|---|---|
| T10 | T20 | T30 | T40 | T50 | ||
| a Determined from DTA curves.b The values were determined by TGA at a heating rate of 10 °C min−1. | ||||||
| Pure PAMs | 545 | 332 | 380 | 418 | 465 | 503 |
| PAMs/GNPa | 538 | 340 | 400 | 450 | 475 | 505 |
| PAMs/GNPb | 542 | 341 | 388 | 423 | 468 | 510 |
| PAMs/GNPc | 554 | 340 | 388 | 425 | 470 | 512 |
| PAMs/GNPd | 555 | 348 | 396 | 438 | 490 | 528 |
| PAMs/GNPe | 555 | 350 | 400 | 445 | 500 | 534 |
One more obvious proof for the formation of the composites is their SEM characteristics, which were analyzed using scanning electron microscopy. The morphological aspects of the PAMs/GNPb and PAMs/GNPc nanocomposites as selected examples, were examined using a Jeol JSM-5400 LV SEM testing instrument. The SEM test is described in detail in the experimental part. Our main aim for this experiment is to show the morphological changes in the PAMs as a result of GNP insertion into its polymer matrix. The pure PAMs surface shows that it possesses a coral reef-like structure with micro-holes in the form of porous spongy shapes, as clearly observed in b. In the SEM images for PAMs/GNPb, the GNPs are inserted inside the polymer matrix and fill in some of its spongy tiny apertures. This can be seen in the low and high magnification images, × = 5000, 10![[thin space (1/6-em)]](https://www.rsc.org/images/entities/char_2009.gif) 000 (see Fig. 6a and b respectively). Moreover, the PAMs/GNPb images display the same features, with more stacking of GNPs over the coral reef structure indicating a higher GNP loading, × = 10
000 (see Fig. 6a and b respectively). Moreover, the PAMs/GNPb images display the same features, with more stacking of GNPs over the coral reef structure indicating a higher GNP loading, × = 10![[thin space (1/6-em)]](https://www.rsc.org/images/entities/char_2009.gif) 000 (Fig. 6c and d).
000 (Fig. 6c and d).
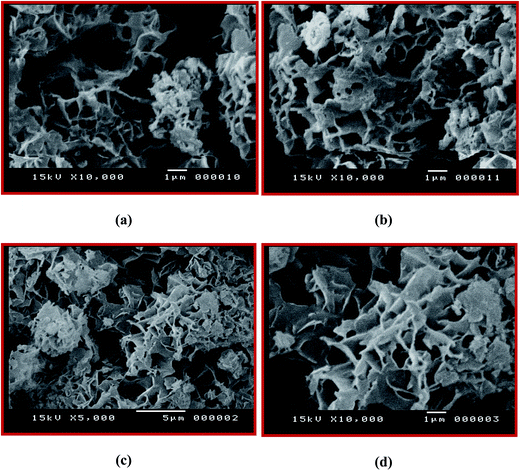 | ||
Fig. 6 SEM images of the PAMs/GNPb nanocomposite (a, × = 5000 and b, × = 10![[thin space (1/6-em)]](https://www.rsc.org/images/entities/char_2009.gif) 000) and PAMs/GNPc nanocomposite (c and d, × = 10 000) and PAMs/GNPc nanocomposite (c and d, × = 10![[thin space (1/6-em)]](https://www.rsc.org/images/entities/char_2009.gif) 000). 000). | ||
3.3. Conductivity measurements
The electrical conductivity of pure PAMs and the GNP-based nanocomposites PAMs/GNPa–e was measured as a function of temperature as shown in Fig. 7. In addition, the test was also performed over a wide range of frequencies, starting at 10 kHz and ending at 5 MHz, to probe the frequency dependence. This due attributed to the grain boundaries and mediator polarization at contacts of the tested materials such as polymers as well as polymer composites.34 In such types of materials, the conductivity is clearly dependent on the frequency at which the sample is measured. The data in Fig. 7 prove that all the measured samples show a significant increase in their conductivity values with a gradual increase in the applied frequency. The frequency dependence conductivity behavior of pure PAMs gives a poor ln![[thin space (1/6-em)]](https://www.rsc.org/images/entities/char_2009.gif) σ value in the range of 10−16 to 10−11 ohm−1 cm−1 over the applied frequency range. Almost the same ln
σ value in the range of 10−16 to 10−11 ohm−1 cm−1 over the applied frequency range. Almost the same ln![[thin space (1/6-em)]](https://www.rsc.org/images/entities/char_2009.gif) σ values are obtained for the PAMs/GNPa–e composites, except for PAMs/GNPe, which gives better value in the same range as semiconductors (10−7 ohm−1 cm−1). The results in Fig. 7a show that the ln
σ values are obtained for the PAMs/GNPa–e composites, except for PAMs/GNPe, which gives better value in the same range as semiconductors (10−7 ohm−1 cm−1). The results in Fig. 7a show that the ln![[thin space (1/6-em)]](https://www.rsc.org/images/entities/char_2009.gif) σ value remains constant while the temperature is increased to a certain limit, and then it somewhat comparatively increases. This is due to the prevalence of electron-phonon clashes because of their increase in free movement. This phenomenon is clearly observed at 10, 20 and 50 kHz. Similar observations are detected for all composite formulations as shown Fig. 7b–e, except for PAMs/GNPe, which gives an almost constant ln
σ value remains constant while the temperature is increased to a certain limit, and then it somewhat comparatively increases. This is due to the prevalence of electron-phonon clashes because of their increase in free movement. This phenomenon is clearly observed at 10, 20 and 50 kHz. Similar observations are detected for all composite formulations as shown Fig. 7b–e, except for PAMs/GNPe, which gives an almost constant ln![[thin space (1/6-em)]](https://www.rsc.org/images/entities/char_2009.gif) σ value at lower temperatures, and then shows a sharp increase when the temperature increases as shown in Fig. 7f. This observation is in agreement with semiconducting behavior. Such behavior is also observed at all applied frequency values for the PAMs/GNPe composite. The thermal stability observed previously in Fig. 5 and the data listed in Table 2 and the enhanced electrical conductivity shown in Fig. 7 indicate a mutual interaction between PAMs and the immersed GNPs. The close proximity of GNPs as an electron acceptor with PAMs as an electron donor in the nanocomposites would lead to charge transfer in the nanocomposites, resulting in enhanced electrical conductivity. Similar results have been reported for other graphene-based nanocomposites.35
σ value at lower temperatures, and then shows a sharp increase when the temperature increases as shown in Fig. 7f. This observation is in agreement with semiconducting behavior. Such behavior is also observed at all applied frequency values for the PAMs/GNPe composite. The thermal stability observed previously in Fig. 5 and the data listed in Table 2 and the enhanced electrical conductivity shown in Fig. 7 indicate a mutual interaction between PAMs and the immersed GNPs. The close proximity of GNPs as an electron acceptor with PAMs as an electron donor in the nanocomposites would lead to charge transfer in the nanocomposites, resulting in enhanced electrical conductivity. Similar results have been reported for other graphene-based nanocomposites.35
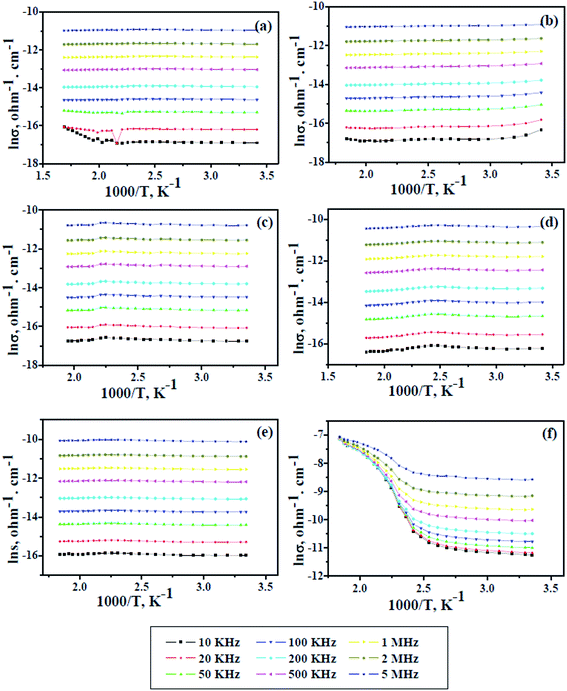 | ||
| Fig. 7 Conductivity and alternate of temperature for pure PAMs (a) and PAMs/GNPa–e nanocomposites (b–f) as a function of applied frequency. | ||
3.4. Dielectric constant and dielectric loss
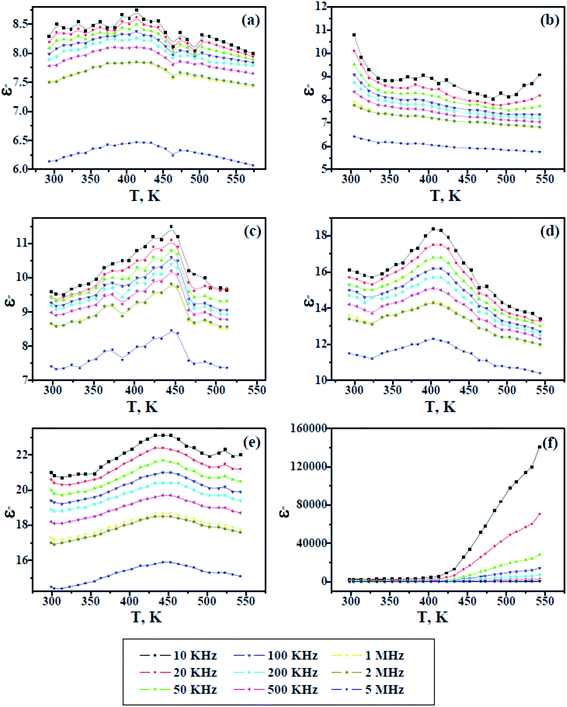
Fig. 8 and 9 show the change in the dielectric constant (ε′) and dielectric loss (ε′′) versus the temperature of PAMs and the PAMs/GNPa–e composites at constant frequencies. The values of ε′ and ε′′ inform us about the ability of the material to store and dissipate charge, respectively, when exposed to an electric filed. Two currents are induced in the material after being affected by an electric field: a conduction current, i.e. the presence of free electrons and a displacement current, i.e. the presence of bound charges. The bound charges contribute towards ε′, whereas the free electrons contribute towards ε′′. It can be generally observed in Fig. 8 and 9 that the trend of ε′ and ε′′ are similar and their values decrease with increasing frequency at all studied temperature values. This behavior is attributed to the irregularities of the induced dipoles as a consequence of their slow response to field variations at high frequencies.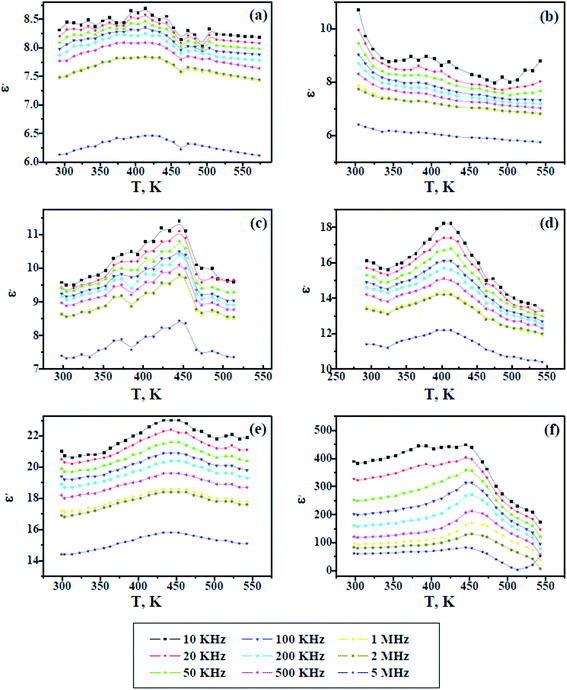 | ||
| Fig. 8 Dielectric constant versus temperature for pure PAMs (a) and PAMs/GNPa–e nanocomposites (b–f). | ||
On the other hand, the values of ε′ and ε′′ increase with increasing temperature up to a certain temperature range (400–480 K), which is believed to be related to the Tg values of the composites, after which the values ε′ and ε′′ start to decline upon further heating. This result reflects the fact that the molecular mobility of polymeric material at Tg or above, which at its maximum mobility, facilitates dipole orientation and thus increases the dielectric properties. Further heating above the observed Tg range results in lower values for ε′ and ε′′, indicating that higher temperatures cause excessive oscillation, leading to a disordering of the molecular dipoles in the material. In contrast to the other samples, the dielectric loss observed in Fig. 9f increases with increasing temperature, indicating the effectiveness of the GNP content in this sample. This is because the GNP content increases the conductivity by virtue of the induced conduction current, which gives rise to a higher dielectric loss upon increasing the temperature at lower frequencies.36–39
4. Conclusions
A new group of PAMs/GNPa–e nanocomposites was fabricated using an in situ polymerization technique. Monomer (2) was polymerized with terephthalaldehyde in the presence of dispersed GNPs at different loadings under a nitrogen atmosphere. Prior to the polymerization, the corresponding pre-monomer (1) monomer (2) and new PAMs were synthesized in moderate yields. The structures of this new polymer and the new products were identified and characterized using FT-IR spectroscopy, X-ray diffraction, thermal analyses, SEM microscopy and electrical conductivity characterization methods. Furthermore, a comparative study was conducted to show the impact of GNP inclusion inside the PAMs polymer matrix. The XRD and FT-IR measurements of our new PAMs/GNPa–e nanocomposites show intense absorption peaks related to GNP and pure PAMs, offering good evidence for the formation of our desired products. The pure PAMs and PAMs/GNPa–e nanocomposites demonstrate higher thermal stability, whereas their initial decompositions start at over 300 °C. The CDTmax values for all the products are similar and were detected in the range of 538–555 °C. The CDTmax values for PAMs/GNPd,e (555 °C) and PAMs/GNPa (538 °C) represent the highest and lowest values respectively. The pure PMAs surface exhibits a coral reef structure with micro-holes that have been blocked by GNPs during their immersion into the PAMs polymer matrix. This can be observed in the SEM images of PAMs/GNPb and PAMs/GNPc. The PAMs/GNPe nanocomposite exhibits the best conductivity value (10−7 ohm−1 cm−1), which lies in the same range as those of semiconductors.Acknowledgements
This project was funded by the Saudi Basic Industries Corporation (SABIC), and the Deanship of Scientific Research (DSR) at King Abdulaziz University, Jeddah, under grant no S/15/325/34. The authors, therefore, acknowledge with thanks SABIC and DSR for technical and financial support.References
- G. W. Peng, F. Qiu, V. V. Ginzburg, D. Jasnow and A. C. Balazs, Forming supramolecular networks from nanoscale rods in binary phase-separating mixtures, Science, 2000, 288, 1802–1804 CrossRef CAS PubMed.
- T. C. Merkel, B. D. Freeman, R. J. Spontak, Z. He, I. Pinnau, P. Meakin and A. J. Hill, Ultrapermeable, reverse-selective nanocomposite membranes, Science, 2002, 296, 519–522 CrossRef CAS PubMed.
- Y. Wang and N. Herron, X-Ray photoconductive nanocomposites, Science, 1996, 273, 632–634 CAS.
- Y. Chen, M. He, J. Peng, Y. Sun and Z. Liang, Structure and Growth Control of Organic-Inorganic Halide Perovskites for Optoelectronics: From Polycrystalline Films to Single Crystals, Adv. Sci., 2016, 3, 1500392 CrossRef PubMed.
- Z. Hu and G. Chen, Novel Nanocomposite Hydrogels Consisting of Layered Double Hydroxide with Ultrahigh Tensibility and Hierarchical Porous Structure at Low Inorganic Content, Adv. Mater., 2014, 26, 5950–5956 CrossRef CAS PubMed.
- A. K. Geim and K. S. Novoselov, The rise of graphene, Nat. Mater., 2007, 6, 183–191 CrossRef CAS PubMed.
- K. Xu, G. Chen and D. Qiu, Convenient construction of poly(3,4-ethylenedioxythiophene)-graphene pie-like structure with enhanced thermoelectric performance, J. Mater. Chem. A, 2013, 1, 12395–12399 CAS.
- C. Gao and G. Chen, Conducting polymer/carbon particle thermoelectric composites: emerging green energy materials, Compos. Sci. Technol., 2016, 124, 52–70 CrossRef CAS.
- M. Motomatsu, T. Takahashi, H. Y. Nie, W.-H. Mizutani and H. Tokumoto, Microstructure study of acrylic polymer-silica nanocomposite surface by scanning force microscopy, Polymer, 1997, 38, 177–182 CrossRef CAS.
- D. W. McCarthy, J. E. Mark, S. J. Clarson and D. W. Schaefer, Synthesis, structure, and properties of hybrid organic–inorganic composites based on polysiloxanes. II. Comparisons between poly(methylphenylsiloxane) and poly(dimethylsiloxane), and between titania and silica, J. Polym. Sci., Part B: Polym. Phys., 1998, 36, 1191–1200 CrossRef CAS.
- J. Wen and J. E. Mark, Precipitation of Silica-titania mixed-oxide fillers into poly(dimethylsiloxane) networks, Rubber Chem. Technol., 1994, 67, 806–819 CrossRef CAS.
- D. W. H. Fam, A. L. Palaniappan, A. I. Y. Tok, B. Liedberg and S. M. Moochhala, A review on technological aspects influencing commercialization of carbon nanotube sensors, Sens. Actuators, B, 2011, 157, 1–7 CrossRef CAS.
- M. Abdel Salam, S. A. Kosa and G. Al-Zhrani, Simultaneous Removal of Copper(II), Lead(II), Zinc(II) and Cadmium(II) from Aqueous Solutions by Multi-walled Carbon Nanotubes, C. R. Chim., 2012, 15, 398–408 CrossRef.
- A. E. Shanahan, J. A. Sullivan, M. McNamara and H. J. Byrne, Preparation and characterization of a composite of gold nanoparticles and single-walled carbon nanotubes and its potential for heterogeneous catalysis, New Carbon Mater., 2011, 26, 347–355 CrossRef CAS.
- Y. Zemen, S. C. Schulz, H. Trommler, S. T. Buschhorn, W. Bauhofer and K. Schulte, Comparison of new conductive adhesives based on silver and carbon nanotubes for solar cells interconnection, Sol. Energy Mater. Sol. Cells, 2013, 109, 155–159 CrossRef CAS.
- J. N. Coleman, U. Khan and W. J. Blau, Small but strong: a review of the mechanical properties of carbon nanotube–polymer composites, Carbon, 2006, 44, 1624–1652 CrossRef CAS.
- S. Peretz and O. Regev, Carbon nanotubes as nanocarriers in medicine, Curr. Opin. Colloid Interface Sci., 2012, 17, 360–368 CrossRef CAS.
- V. Sgobba and D. M. Guldi, Carbon nanotubes—electronic/electrochemical properties and application for nanoelectronics and photonics, Chem. Soc. Rev., 2009, 38, 165–184 RSC.
- Y.-C. Chiang and J.-R. Ciou, Effects of surface chemical states of carbon nanotubes supported Pt nanoparticles on performance of proton exchange membrane fuel cells, Int. J. Hydrogen Energy, 2011, 36, 6826–6831 CrossRef CAS.
- K. I. Aly, M. A. Abbady, S. A. Mahgoub and M. A. Hussein, Liquid crystalline polymers IX main chain thermotropic poly(azomethine-ether)s containing thiazole moiety linked with polymethylene spacers, eXPRESS Polym. Lett., 2007, 1, 197–207 CrossRef CAS.
- M. A. Abbady, K. I. Aly, S. A. Mahgoub and M. A. Hussein, New polymer syntheses: XV. Synthesis and characterization of new polyketoamine polymers containing ether or thioether linkages in the main chain, Polym. Int., 2005, 54, 1512–1523 CrossRef CAS.
- K. I. Aly and M. A. Hussein, Synthesis, Characterization and Corrosion Inhibitive Properties of New Thiazole Based Polyamides Containing Diarylidenecyclohexanone Moiety, Chin. J. Polym. Sci., 2015, 33, 1–13 CrossRef CAS.
- M. A. Abdel-Rahman and M. A. Hussein, Polyarylidene containing saturated silicon spacers in the polymers main chain, Des. Monomers Polym., 2013, 16, 377–388 CrossRef CAS.
- M. A. Gabal, M. A. Hussein and A. A. Hermas, Synthesis, Characterization and Electrical Conductivity of Polyaniline-Mn0.8Zn0.2Fe2O4 Nano-composites, Int. J. Electrochem. Sci., 2016, 11, 4526–4538 CrossRef CAS.
- M. A. Hussein, B. M. Abu-Zied and A. M. Asiri, The Role of Mixed Graphene/Carbon Nanotubes on the Coating Performance of G/CNTs/Epoxy Resin Nanocomposites, Int. J. Electrochem. Sci., 2016, 11, 7644–7659 CrossRef CAS.
- M. M. Rahman, M. A. Hussein, A. Alamry Kh, F. M. AlShehry and A. M. Asiri, Sensitive methanol sensor based on PMMA-G-CNTs nanocomposites deposited onto glassy carbon electrodes, Talanta, 2016, 150, 71–80 CrossRef CAS PubMed.
- M. Naebe, J. Wang, A. Amini, H. Khayyam, N. Hameed, L. H. LI, Y. Chen and B. Fox, Mechanical property and structure of covalent functionalised graphene/epoxy nanocomposites, Sci. Rep., 2014, 4, 4375 Search PubMed.
- A. T. Lawal, Synthesis and utilisation of graphene for fabrication of electro-chemical sensors, Talanta, 2015, 131, 424–443 CrossRef CAS PubMed.
- H. Wang, Y. Zhang, Y. Wang, H. Ma, B. Du and Q. Wei, Facile synthesis of cuprous oxide nanowires decorated graphene oxide nanosheets nanocomposites and its application in label-free electrochemical immunosensor, Biosens. Bioelectron., 2017, 87, 745–751 CrossRef CAS PubMed.
- Y. Ma, X. Li, W. Zhou, L. Yang and P. Wu, Reinforcement of graphene nanosheets on the microstructure and properties of Sn58Bi lead-free solder, Mater. Des., 2017, 113, 264–272 CrossRef CAS.
- M. A. Hussein, M. A. Abdel-Rahman and A. Geies, New Heteroaromatic Polyazomethines Containing Naphthyridine Moieties: Synthesis, Characterization, and Biological Screening, J. Appl. Polym. Sci., 2012, 126, 2–12 CrossRef CAS.
- A. Avci, M. Kamaci, I. Kaya and M. Yildirim, Synthesis of novel crosslinked poly(azomethine-urethane)s: photophysical and thermal properties, Mater. Chem. Phys., 2015, 163, 301–310 CrossRef CAS.
- L. Marin, V. Cozan, M. Bruma and V. C. Grigoras, Synthesis and thermal behaviour of new poly(azomethine-ether), Eur. Polym. J., 2006, 42, 1173–1182 CrossRef CAS.
- R. Patil, A. S. Roy, K. R. Anilkumar, K. M. Jadhav and S. Ekhelikar, Composites, Part B, 2012, 43, 3406–3411 CrossRef CAS.
- B. Song, J. I. Choi, Y. Zhu, Z. Geng, L. Zhang, Z. Lin, C.-C. Tuan, K.-S. Moon and C.-P. Wong, Molecular Level Study of Graphene Networks Functionalized with Phenylene Diamine Monomers for Supercapacitor Electrodes, Chem. Mater., 2016, 28, 9110–9121 CrossRef CAS.
- A. Gupta and V. Choudhary, Electromagnetic interference shielding behavior of poly(trimethylene terephthalate)/multi-walled carbon nanotube composites, Compos. Sci. Technol., 2011, 71, 1563–1568 CrossRef CAS.
- S. Cetiner, H. Karakas and R. Ciobanu, et al., Polymerization of pyrrole derivatives on polyacrylonitrile matrix, FTIR-ATR and dielectric spectroscopic characterization of composite thin films, Synth. Met., 2010, 160, 1189–1196 CrossRef CAS.
- V. Raja, A. K. Sharma and V. V. R. Narasimha, Impedance spectroscopic and dielectric analysis of PMMA-COP4VPNO polymer films, Mater. Lett., 2004, 58, 3242–3247 CrossRef CAS.
- V. S. Yadav, D. K. Sahu, Y. Singh, M. Kumar and D. C. Dhubkarya, Frequency and temperature dependence of dielectric properties of Pure Poly Vinylidene Fluoride (PVDF) thin films, AIP Conf. Proc., 2010, 1285, 267–278 CrossRef CAS.
| This journal is © The Royal Society of Chemistry 2017 |

