 Open Access Article
A novel Cu+-doped Li[Fe0.9Cu0.1Li0.1]PO4/C cathode material with enhanced electrochemical properties
Jian-Min Zhu a,
Tian Xia
 a,
Kang-Kang Yan
 a,
Wei-Jui Chang
 b,
Xue-Gang Chen
 a,
Ying Ye
 a and
Ping-Ping Zhang
 *a
*a
aOcean College, Zhejiang University, Zhoushan 316021, P. R. China. E-mail: marin011@163.com; Fax: +86-580-2092891; Tel: +86-580-2092129
bSchool of Earth and Environment, The University of Western Australia, Perth 6009, Australia
First published on 17th March 2017
Abstract
LiFePO4 is an effective battery material which has gained global focus. In this study, we prepared a novel Cu+-doped Li[Fe0.9Cu0.1Li0.1]PO4/C cathode material via a carbothermal reduction method using glucose as carbon source. X-ray diffraction (XRD) patterns and Rietveld refinement on the samples are consistent with the orthorhombic phase and showed that the substituting Cu+ ions and excess Li+ ions occupy the Fe sites. The micro-morphology of the samples indicates that Cu+ doping can decrease the particle size and maintain the crystal structure of LiFePO4/C. XP spectra confirmed that the surface oxidation states of Fe and Cu are +2 and +1, respectively. The as-prepared Li[Fe0.9Cu0.1Li0.1]PO4/C composite exhibits enhanced initial discharge capacity (148.8 mA h g−1) compared to the un-doped LiFePO4/C. The discharge capacity remains at 149.8 mA h g−1 after 50 cycles at a rate of 0.2C, which displayed an excellent cycling stability. Furthermore, the cyclic voltammetry (CV) and electrochemical impedance spectra (EIS) results showed that the Cu+-doped LiFePO4/C composite exhibits a higher lithium-ion diffusion coefficient and lower charge transfer resistance than the undoped counterparts. This study presents a novel Cu+-doped LiFePO4/C cathode material with enhanced electrochemical properties, which could be potentially applied as a battery material.
1. Introduction
Since the first discovery of LiFePO4 as a cathode material for lithium-ion batteries by Padhi et al.1 in 1997, the research of LiFePO4 has attracted global interest due to its advantages of low cost, long cycle life, high theoretical capacity of 170 mA h g−1 and environmentally friendly properties when compared with lithium nickel/manganese/cobalt-ion batteries.2,3 From the perspective of kinetics, though the increment resistance related much to the appearance of FePO4 phase, the LixFePO4 system shows a great rate capacity and cycling life, due to the coherency strain that suppresses phase separation and makes a single-phase transform at a very low overpotential.4–7 However, the application of LiFePO4 has been greatly limited by its low rate capacity at room temperature resulting from low lithium diffusion rate and electron conductivity.8,9 Tremendous efforts have been made to overcome this shortage, such as carbon coating,10 metal ion or oxide substitution,11–13 nano-size crystal particle refinement14 and so on. The coating by carbon materials such as acetylene black, carbon nanotubes, graphene, and glucose is a promising method to improve the conductivity.15 However, carbon coating will also decrease the volumetric energy density and tap density.16 Surface modification of LiFePO4 with metal ion substitutions, such as Cu2+, Mg2+, K+, and Na+ have been proven to be effective.11–13 Meanwhile, a suitable synthesis method, including solid state reaction,17 co-precipitation,18 microwave assisted syntheses,19 hydrothermal syntheses,20 solvothermal syntheses,21 carbothermal reduction method,22 along with optimized synthesis conditions should also gain attention to modifying the structure as well as electrochemical properties of the LiFePO4 cathode material. Lithium ion can only pass through one-dimensional curved channels through an anisotropic transport,23 indicating that every single atom should be put in order. Isovalent or aliovalent substitution will lead to lattice dislocation or vacancies, which can accelerate the lithium ion diffusion rate and consequently enhance both the electronic conductivity and phase transition.24–26In this study, we prepared a novel Cu+-doped Li[Fe0.9Cu0.1Li0.1]PO4/C cathode material via a carbothermal reduction method. Glucose was used as the carbon source because it can be used as a reducing agent. In addition, glucose can hinder the agglomeration of the products and control the particle size, which is important for its electrochemical performance.10 We characterized the structure, surface morphology, and chemical valances of the samples and evaluated their electrochemical performance.
2. Materials and methods
2.1. Preparation of LiFePO4/C and Cu+-doped LiFePO4/C
D-(+)-Glucose was obtained from Heifei Bomei Biotechnology Co. Ltd. (China). LiCH3COO, Cetyltrimethyl Ammonium Bromide (CTAB), Cu(CH3COO)2 and silicon (1–3 mm) were supplied by Shanghai Aladdin Industrial Corporation (China). FePO4·2H2O, ethanol, and NH4H2PO4 were purchased from Shanghai Sinopharm Chemical Reagent Co. Ltd. (China). All reagents were used without further purification.In a typical procedure, FePO4·2H2O, LiCH3COO, D-(+)-glucose, CTAB, and ethanol were mixed in stoichiometric proportions and were ground using a ball-milling (DROIDE, China, PM0.4L) method at 600 rpm for 12 h. The percentage dosage of CTAB was 2% of the final product. Then the samples were dried in a fuming cupboard for about 2 days to avoid the carbonization of glucose, and were ball milled again for 2 h without adding anhydrous ethanol. The obtained products were heated at 300 °C for 2 h, and 650 °C for 4 h under an argon atmosphere. Finally, we obtained LiFePO4/C composites, and the samples were named according to the percentage dosage of glucose, where glucose dosage of 10% and 20% indicate the sample name of LFP/G10 and LFP/G20, respectively.
The Cu+-doped LiFePO4/C composite was prepared by adding excess LiCH3COO, Cu(CH3COO)2, and NH4H2PO4 during ball-milling, while all other procedures were kept constant. The ratio of Li![[thin space (1/6-em)]](https://www.rsc.org/images/entities/char_2009.gif) :
:![[thin space (1/6-em)]](https://www.rsc.org/images/entities/char_2009.gif) Cu
Cu![[thin space (1/6-em)]](https://www.rsc.org/images/entities/char_2009.gif) :
:![[thin space (1/6-em)]](https://www.rsc.org/images/entities/char_2009.gif) Fe
Fe![[thin space (1/6-em)]](https://www.rsc.org/images/entities/char_2009.gif) :
:![[thin space (1/6-em)]](https://www.rsc.org/images/entities/char_2009.gif) P was 1.1
P was 1.1![[thin space (1/6-em)]](https://www.rsc.org/images/entities/char_2009.gif) :
:![[thin space (1/6-em)]](https://www.rsc.org/images/entities/char_2009.gif) 0.1
0.1![[thin space (1/6-em)]](https://www.rsc.org/images/entities/char_2009.gif) :
:![[thin space (1/6-em)]](https://www.rsc.org/images/entities/char_2009.gif) 0.9
0.9![[thin space (1/6-em)]](https://www.rsc.org/images/entities/char_2009.gif) :
:![[thin space (1/6-em)]](https://www.rsc.org/images/entities/char_2009.gif) 1, and the elemental composition of this composite is Li[Fe0.9Cu0.1Li0.1]PO4/C. The percentage dosages of glucose and CTAB were 10% and 2% of the final product, respectively. The obtained sample was named as LCu+FP/G10.
1, and the elemental composition of this composite is Li[Fe0.9Cu0.1Li0.1]PO4/C. The percentage dosages of glucose and CTAB were 10% and 2% of the final product, respectively. The obtained sample was named as LCu+FP/G10.
2.2. Characterizations
The crystal structure of the samples was determined by an X-ray diffractometer (XRD, D/max 2550, Rigaku, Japan) with Cu Kα radiation at a scan rate of 1° min−1. The micro-morphology was observed by a Field-Emission Scanning Electronic Microscope (FE-SEM, 650 FEG, Quanta, USA) at an accelerating voltage of 10–20 kV and Field-Emission Transmission Electronic Microscope (FE-TEM, 2100F, JEOL, Japan) at an accelerating voltage of 200 kV. The valence states of Fe and Cu were examined by an X-ray Photoelectron Spectroscopy (XPS, ESCLAB 250Xi, Thermo Scientific, England) with Al Ka (hv = 1486.6 eV) and 30 eV pass energy at a step size of 0.1 eV. The carbon content was determined by a carbon and sulfur analyzer (CS320, YANRUI, China).2.3. Electrochemical analysis
The electrochemical performance was evaluated in CR2430 coin type cells. The cathode films were prepared by dissolving 80 wt% as-prepared product and 15 wt% acetylene black in anhydrous ethanol under ultrasonic stirring. Then 5 wt% polytetrafluoroethylene (PTFE) was added to form a clay which was rolled into an 8 mm thick-film. The films were vacuum dried at 120 °C for 1.5 h and then the obtained product was transformed into an argon-filled glove box for 8 h. Li foil was used as the counter electrode with Celgard 2500 as the separator. The electrolyte was composed of ethylene carbonate and dimethyl carbonate with a volume ratio of 1![[thin space (1/6-em)]](https://www.rsc.org/images/entities/char_2009.gif) :
:![[thin space (1/6-em)]](https://www.rsc.org/images/entities/char_2009.gif) 2. The charge/discharge analysis was performed using a battery testing system (CT2001A, LAND, China) from 2.3 to 4.2 V at room temperature. The cyclic voltammetry (CV) and electrochemical impedance spectroscopy (EIS) measurements were performed on an electrochemical workstation (CHI660E, ChenHua, China).
2. The charge/discharge analysis was performed using a battery testing system (CT2001A, LAND, China) from 2.3 to 4.2 V at room temperature. The cyclic voltammetry (CV) and electrochemical impedance spectroscopy (EIS) measurements were performed on an electrochemical workstation (CHI660E, ChenHua, China).
3. Results and discussion
3.1. Characterizations of the samples
Fig. 1 shows the XRD patterns of the as-prepared samples. Silicon was artificially added to calculated the variation of diffraction peaks of the samples (the mass ratio between silicon and sample was 1![[thin space (1/6-em)]](https://www.rsc.org/images/entities/char_2009.gif) :
:![[thin space (1/6-em)]](https://www.rsc.org/images/entities/char_2009.gif) 4). All the diffraction peaks of the samples can be indexed as an orthorhombic phase with a Pmnb (62) space group (JC PDF#40-1499). It is indicated that we have successfully synthesized a Cu+-doped Li[Fe0.9Cu0.1Li0.1]PO4/C composite through a ball-milling method.
4). All the diffraction peaks of the samples can be indexed as an orthorhombic phase with a Pmnb (62) space group (JC PDF#40-1499). It is indicated that we have successfully synthesized a Cu+-doped Li[Fe0.9Cu0.1Li0.1]PO4/C composite through a ball-milling method.
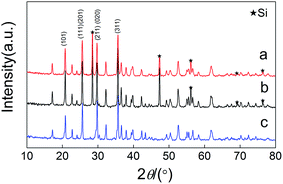 | ||
| Fig. 1 XRD patterns of (a) (LCu+FP/G10), (b) (LFP/G20) and (c) (LFP/G10). Si was artificially added as a reference material to normalize the diffraction peaks of the samples. | ||
After Cu+ doping, the XRD patterns exhibited slight changes due to the similar radiuses (90 pm) of Cu+ and Fe2+. Calculated from Rietveld refinement (FullProof: Version: July 2001), as shown in Table 1, all the samples show comparable lattice parameters. It is suggested that the doped Cu+ occupied the sites of Fe. The conductivity of LiFePO4 cathode is greatly limited because of the separation of FeO6 octahedron by PO4 tetrahedron and the hexagonal closest packing of oxygen that restricts the free diffusion of Li+.1 The Cu+-doping will cause lattice defection and enhance the free diffusion of Li+. On the other hand, the addition of excess Li+ ions into Fe sites can greatly increase the electrochemical conductivity.27
| a (Å) | b (Å) | c (Å) | V (Å3) | |
|---|---|---|---|---|
| PDF#40-1499 | 6.0189 | 10.3470 | 4.7039 | 293.00 |
| LFP/G10 | 6.0157 | 10.3408 | 4.7056 | 292.72 |
| LCu+FP/G10 | 6.0149 | 10.3392 | 4.7054 | 292.63 |
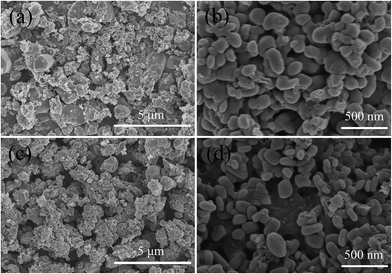
Fig. 2 shows the SEM images of the samples under different magnitudes. All the samples exhibit comparable surface morphologies. The obtained LFP/G10 is mainly composed of spherical particles with diameters ranging from 0.1 to 3 μm. The surface morphology LCu+FP/G10 demonstrates smaller particle size with a diameter of 0.05–0.2 μm. In addition, the Cu+-doped sample presents narrower particle size distribution. This result indicates that Cu+ doping can decrease the particle size as well as modify the surface morphology, which is potential for improving its electrochemical application as cathode materials.
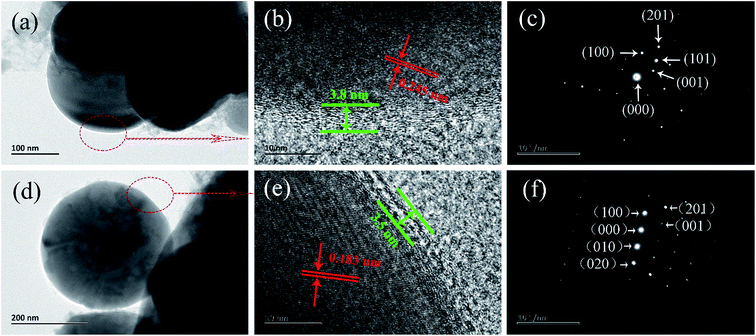
Fig. 3 shows the TEM, high-resolution TEM (HRTEM) and selected area electronic diffraction (SAED) images of LFP/G10 and LCu+FP/G10. Both the as-prepared samples were coated with a 3–4 nm transparent film of carbon layers. They also show identical lattice spacing of 0.245 nm and 0.183 nm, which are corresponding to the (101) and (201) crystal planes of the orthorhombic LiFePO4. It is suggested that the Cu+-doping didn't significantly change the crystal structure of LiFePO4. SAED images of the samples revealed the crystalline nature as predicted by XRD results. The LCu+FP/G10 sample with a shorter b-axis and uniform lattice spacing assures its better electrochemical performance than the un-doped sample, because the Li+ ions mainly diffuse along the b-axis in the orthorhombic LiFePO4.5 The coating of conductive carbon on the particles provides an effective diffusion path for electrons and decreases the particle size. Meanwhile, there were no Cu+-related peaks observed or any appreciable change of diffraction peaks in XRD patterns, indicating a quite low amount of impurities.
3.2. XPS studies
XP spectra were applied to testify the surface oxidation states of Fe and Cu in the Cu+-doped composite. Fig. 4 shows the binding energy of Fe 2p, Cu 2p spectrum and the kinetic energy of Auger Cu LMM spectrum calibrated by assigning the C 1s peak to 284.9 eV. The Fe 2p spectrum consists of Fe 2p3/2 and Fe 2p1/2 components and each component contains a main peak and a related shake-up satellite resulted from spin–orbit coupling.28 The binding energy and kinetic energy position of the main peak closely related to the valence of Fe and Cu. In the standard sample of Fe3O4,29 the Fe 2p3/2 spectrum consists of nine peaks, where 708.3, 709.3, and 710.4 eV binding energies are associated with Fe2+ valence state and the peaks at 710.2, 711.3, 712.4, and 713.6 eV relate to the Fe3+ valence state. For a Fe2+ ion in LiFePO4 sample,28 the Fe 2p3/2 and Fe 2p1/2 main peaks are located at 710.5 eV (explained by multiple effects, rather than the presence of Fe3+ ion) and 724 eV, respectively. For a Fe3+ ion, the FePO4 sample28 shows a higher binding energy at 712.5 eV for Fe 2p3/2 and 726 eV for Fe 2p1/2, on the premise of C 1s at 284.6 eV. Fig. 4a shows four peaks at the binding energies of 709.88, 710.18, 710.58, and 710.78 (main peak) eV for Fe 2p3/2 and 724 eV for Fe 2p1/2, which are related to Fe2+ valence state. The slightly shifting to a higher binding energy than Fe3O4 mainly results from the higher electronegativity of phosphorus for forming the bonds Fe–O–P than Fe–O–Fe.29The XP spectrum of Cu 2p is composed of two mean peaks at about 932.8 eV (Cu+ or Cu0) and 935.3 eV (Cu2+) with a characteristic shake-up satellite at 938–945 eV and 958–965 eV, on the premise of C 1s at 284.9 eV.30 Many authors use the presence of the strong characteristic shake-up satellite to indicate the presence of Cu2+.31,32 Auger Cu LMM spectra with larger chemical shift were also collected to identify the valence of Cu, where the Wagner plot indicates the presence of Cu+ at a kinetic energy of 916.8 eV, Cu0 at 918.6 eV, and Cu2+ at 917.7 eV.33,34 Fig. 4b shows a main peak at the binding energy of 932.58 eV and a wake shake-up satellite at 938–945 eV and 958–965 eV that associated with Cu+ or Cu0. Meanwhile, Fig. 4c exhibits the main peak at kinetic energy at 916.8 eV that related to Cu+. These results indicate that the Fe3+ and Cu2+ in the raw materials have been reduced to Fe2+ and Cu+ during sample preparation.
3.3. Cyclic voltammetry
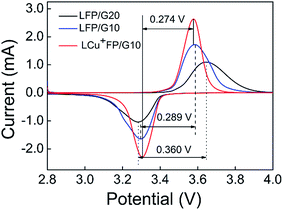
Fig. 5 shows the CV curves of the as-prepared samples at a potential range of 2.8–4.0 V and a scan rate of 0.1 mV s−1 vs. Li+/Li at room temperature. All the samples exhibit a charge voltage peak at around 3.5–3.6 V and a discharge voltage peak at around 3.2–3.3 V, corresponding to the insertion and extraction of Li+ ions in the LixFePO4 system, respectively. The symmetry of charge–discharge peaks demonstrates the delithiation/lithiation reversibility of the as-prepared active materials and the voltage space between charge–discharge peaks indicates the polarization degree of the electrode.35 The charge–discharge potential space of the LCu+FP/G10 sample is lower and the redox intensity is higher than other samples, indicating improved kinetic properties and accelerated lithium ion diffusion, which enhance the reaction reversibility and electrochemical properties of the electrode. The CV results testified that Cu+ doping can enhance the lithium ion diffusion kinetics and related electrochemical properties.3.4. EIS measurements
EIS was performed with an AC voltage amplitude of 5 mV and a scanning frequency range of 0.1 Hz to 100 kHz to further explore the effect of Cu+ doping on the cell impedance. As shown in Fig. 6a, an intercept is observed in high frequencies along with a semicircle and a straight line in middle and low frequencies, respectively. The ohmic resistance (Rs) of the cell including electrode and electrolyte resistance corresponds to the intercept observed in the high-frequency region at the Z′ axis. The charge transfer resistance (Rct) occurring at the electrode/electrolyte interface attributes to the semicircle diameter at the Z′ axis.4,5,36 The straight line in the low-frequency range is known as Warburg impedance (Zw), which is associated with the diffusion of the lithium ions between electrode active material and electrolyte. The exchange current density (io) indicates the polarization and reversibility of the electrode. The lithium-ion diffusion coefficient (DLi+) was calculated using the following equation:
 | (1) |
| Z = Rs + Rct + σwω−1/2 | (2) |
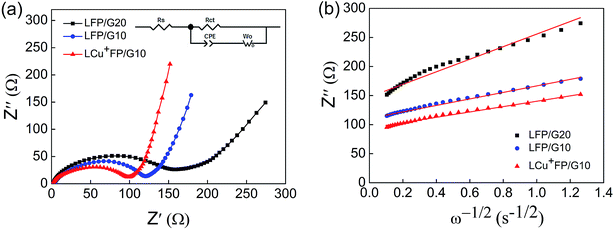 | ||
| Fig. 6 (a) EIS and the equivalent circuit of the as-prepared samples and (b) relationship plot between Z′ and the reciprocal square root of frequency (ω−1/2) in the low-frequency region. | ||
The exchange current density (io) was calculated using the following equation:
 | (3) |
The EIS parameters of equivalent circuit calculated using eqn (1)–(3) are recorded and shown in Table 2. Fig. 6b shows the relationship between Z′ and the reciprocal square root of frequency (ω−1/2) in the low-frequency region. The LCu+FP/G10 sample exhibits the highest lithium-ion diffusion coefficient (DLi+) (1.18 × 10⁻¹⁴ cm2 s−1) and the lowest charge transfer resistance (Rct) (98.62 Ω) among all the samples. This result indicates that Cu+ doping improved the electronic conductivity and electrochemical performance of LiFePO4 cathode material.
| Sample | Rs (Ω) | Rct (Ω) | σw (Ω cm s−1) | DLi+ (cm2 s−1) | io (mA cm−2) |
|---|---|---|---|---|---|
| LFP/G20 | 1.37 | 159.90 | 106.24 | 2.51 × 10⁻¹⁵ | 1.61 × 10⁻⁴ |
| LFP/G10 | 3.08 | 120.90 | 55.19 | 9.29 × 10⁻¹⁵ | 2.12 × 10⁻⁴ |
| LCu+FP/G10 | 0.32 | 98.62 | 48.89 | 1.18 × 10⁻¹⁴ | 2.60 × 10⁻⁴ |
3.5. Discharge capacity and cycle performance
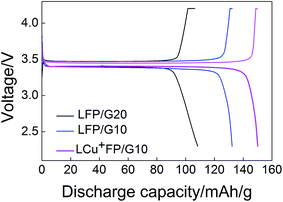
Fig. 7 presents the initial charge–discharge curves of the samples at a rate of 0.2C between 2.2 V and 4.2 V at room temperature. Table 3 lists the carbon content of the samples. Carbon coating can increase the conductivity, but it also can decrease the volumetric energy density and tap density.16 The initial discharge capacity of LFP/G20 (105.2 mA h g−1) is smaller than that of LFP/G10 (130.8 mA h g−1), indicating that with 15 wt% acetylene black taking into account, the addition of 10% D-(+)-glucose of theoretical product had an obvious advantage over 20% to enhance the electrochemical properties of samples. The LCu+FP/G10 shows the highest initial discharge capacity 148.8 mA h g−1 at 0.2C, consistent with the statement that the doping of Cu+ and excess Li+ ions in the Fe sites can enhance the electrochemical capacity of the samples.| Samples | LFP/G20 | LFP/G10 | LCu+FP/G10 |
|---|---|---|---|
| Carbon content (wt%) | 4.98 | 2.54 | 2.48 |
| Initial discharge capacity (mA h g−1) at 0.2C | 105.2 | 130.8 | 148.8 |
The cycle performance of the samples is shown in Fig. 8. All the samples showed excellent reversible cycle performances. Fig. 8a presents the cycle performance of the samples for 5 cycles at a rate of 0.2C, 0.5C, 1C, and 2C, respectively. Fig. 8b presents the performance at a 0.2C rate for 50 cycles. The initial discharge capacities of the modified sample LCu+FP/G10 exceeded that of LFP/G10 which was also higher than that of LFP/G20 at all discharge rates. After 50 cycles, the LCu+FP/G10 sample remained a high discharge capacity of 149.8 mA h g−1, meanwhile, the LFP/G10 and LFP/G20 samples also raised to 132.4 mA h g−1 and 111.2 mA h g−1, respectively. Lithium ion can only pass through one-dimensional, curved channels through an anisotropic transport,23 meaning that every single atom should be put in order. Cu+ ions substitution will lead to lattice misfit and vacancies on the lithium site, thus accelerate the lithium ion diffusion and enhance both the electronic conductivity and phase transition. All the results showed an excellent cycling stability of the three samples while the modified sample LCu+FP/G10 displayed an obvious enhancement concerning about the initial discharge capacity at all discharge rates.
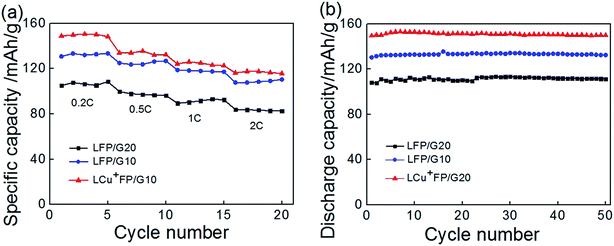 | ||
| Fig. 8 (a) Cycle performance of the samples at a rate of 0.2C, 0.5C, 1C, 2C, and (b) cycle performance of the samples at a rate of 0.2C. | ||
The SEM images of the LCu+FP/G10 sample after 50 charge/discharge cycles were performed to examine the areal loading of the active material and the corresponding electrolyte in a cell, as shown in Fig. 9. The coin-cell was disassembled inside the glove box to avoid the redox reaction of the active electrode material, then the active electrode material was washed with ethanol and stood still for 30 min. Comparing with the obtained SEM images of the areal loading of the active material and the corresponding electrolyte before (Fig. 9b) and after cycling (Fig. 9c), it can be seen that the morphologies of as-prepared cathode dispersed homogeneously in carbon stays intact after 50 charge/discharge cycles.
 | ||
| Fig. 9 SEM images of (a) the original LCu+FP/G10 sample, (b) the electrode before cycling, and (c) the electrode after cycling. | ||
4. Conclusions
In summary, we prepared a novel Cu+-doped Li[Fe0.9Cu0.1Li0.1]PO4/C cathode material via a carbothermal reduction process using glucose as carbon source. The XRD patterns, SEM, TEM, and XP spectra showed that we have synthesized an orthorhombic phase Cu+-doped Li[Fe0.9Cu0.1Li0.1]PO4/C composite with Cu+ and Li+ ions partly occupied the Fe sites. The Cu+-doped Li[Fe0.9Cu0.1Li0.1]PO4/C composite delivered the best initial discharge capacities at rates of 0.2C, 0.5C, 1C, and 2C (148.8, 133.9, 124.2, and 116.2 mA h g−1, respectively). The electrochemical capacity remains 149.8 mA h g−1 after 50 cycles at a rate of 0.2C, showing an excellent cycling stability. Based on the CV and EIS results, the Cu+ doping decreased the charge transfer resistance (Rct) of the sample. The lithium-ion diffusion coefficient (DLi+) of the Cu+-doped composite is the highest among all the as-prepared samples because Cu+ and some Li+ ions occupied the Fe site of LiFePO4 composite. The enhanced electrochemical property of Cu+-doped Li[Fe0.9Cu0.1Li0.1]PO4/C material makes it a potential efficient battery material.References
- A. K. Padhi, K. S. Nanjundaswamy and J. B. Goodenough, J. Electrochem. Soc., 1997, 144, 1188–1194 CrossRef CAS.
- Y. G. Wang, P. He and H. S. Zhou, Energy Environ. Sci., 2011, 4, 805–817 CAS.
- W. J. Zhang, J. Power Sources, 2011, 196, 2962–2970 CrossRef CAS.
- F. Gao and Z. Y. Tang, Electrochim. Acta, 2008, 53, 5071–5075 CrossRef CAS.
- D. A. Cogswell and M. Z. Bazant, ACS Nano, 2012, 6, 2215–2225 CrossRef CAS PubMed.
- R. Malik, F. Zhou and G. Ceder, Nat. Mater., 2011, 10, 587–590 CrossRef CAS PubMed.
- P. Bai, D. A. Cogswell and M. Z. Bazant, Nano Lett., 2011, 11, 4890–4896 CrossRef CAS PubMed.
- Z. H. Li, D. M. Zhang and F. X. Yang, J. Mater. Sci., 2009, 44, 2435–2443 CrossRef CAS.
- L. X. Yuan, Z. H. Wang, W. X. Zhang, X. L. Hu, J. T. Chen, Y. H. Huang and J. B. Goodenough, Energy Environ. Sci., 2011, 4, 269–284 CAS.
- L. Ren, X. E. Li, F. F. Wang and Y. Han, Rare Met., 2015, 34, 731–737 CrossRef CAS.
- N. Jayaprakash and N. Kalaiselvi, Electrochem. Commun., 2007, 9, 620–628 CrossRef CAS.
- A. R. Madram, R. Daneshtalab and M. R. Sovizi, RSC Adv., 2016, 6, 101477–101484 RSC.
- Y. C. Li, J. H. Hao, G. W. Geng, Y. F. Wang, X. K. Shang, C. C. Yang and B. J. Li, RSC Adv., 2015, 5, 68681–68687 RSC.
- M. Nie, Y. F. Xia, Z. B. Wang, F. D. Yu, Y. Zhang, J. Wu and B. Wu, Ceram. Int., 2015, 41, 15185–15192 CrossRef CAS.
- D. Zhao, Y. L. Feng, Y. G. Wang and Y. Y. Xia, Electrochim. Acta, 2013, 88, 632–638 CrossRef CAS.
- J. J. Wang and X. L. Sun, Energy Environ. Sci., 2012, 5, 5163–5185 CAS.
- S. Suriyakumar, M. Kanagaraj, N. Angulakshmi, M. Kathiresan, K. S. Nahm, M. Walkowiak, K. Wasinski, P. Polrolniczak and A. M. Stephan, RSC Adv., 2016, 6, 97180–97186 RSC.
- P. P. Zhu, Z. Y. Yang, P. Zeng, J. Zhong, J. Yu and J. X. Cai, RSC Adv., 2015, 5, 107293–107298 RSC.
- J. Lim, J. Gim, J. Song, D. T. Nguyen, S. Kim, J. Jo, V. Mathew and J. Kim, J. Power Sources, 2016, 304, 354–359 CrossRef CAS.
- G. J. Liu, B. Wang, L. Wang, Y. H. Yuan and D. L. Wang, RSC Adv., 2016, 6, 7129–7138 RSC.
- X. F. Liu, J. Q. Huang, Q. Zhang, X. Y. Liu, H. J. Peng, W. C. Zhu and F. Wei, J. Mater. Chem., 2012, 22, 18908–18914 RSC.
- Y. M. Hu, G. H. Wang, C. Z. Liu, S. L. Chou, M. Y. Zhu, H. M. Jin, W. X. Li and Y. Li, Ceram. Int., 2016, 42, 11422–11428 CrossRef CAS.
- M. S. Islam, D. J. Driscoll, C. A. J. Fisher and P. R. Slater, Chem. Mater., 2005, 17, 5085–5092 CrossRef CAS.
- N. Meethong, H. Y. S. Huang, S. A. Speakman, W. C. Carter and Y. M. Chiang, Adv. Funct. Mater., 2007, 17, 1115–1123 CrossRef CAS.
- S. Upreti, N. A. Chernova, J. Xiao, J. K. Miller, O. V. Yakubovich, J. Cabana, C. P. Grey, V. L. Chevrier, G. Ceder, J. L. Musfeldt and M. S. Whittingham, Chem. Mater., 2012, 24, 166–173 CrossRef CAS.
- F. Omenya, N. A. Chernova, Q. Wang, R. B. Zhang and M. S. Whittingham, Chem. Mater., 2013, 25, 2691–2699 CrossRef CAS.
- S. S. Zhang, J. L. Allen, K. Xu and T. R. Jow, J. Power Sources, 2005, 147, 234–240 CrossRef CAS.
- R. Dedryvere, M. Maccario, L. Croguennec, F. Le Cras, C. Delmas and D. Gonbeau, Chem. Mater., 2008, 20, 7164–7170 CrossRef CAS.
- A. P. Grosvenor, B. A. Kobe, M. C. Biesinger and N. S. McIntyre, Surf. Interface Anal., 2004, 36, 1564–1574 CrossRef CAS.
- F. Severino, J. L. Brito, J. Laine, J. L. G. Fierro and A. L. Agudo, J. Catal., 1998, 177, 82–95 CrossRef CAS.
- S. Poulston, P. M. Parlett, P. Stone and M. Bowker, Surf. Interface Anal., 1996, 24, 811–820 CrossRef CAS.
- L. Kundakovic and M. Flytzani-Stephanopoulos, Appl. Catal., A, 1998, 171, 13–29 CrossRef CAS.
- E. S. Shpiro, W. Grunert, R. W. Joyner and G. N. Baeva, Catal. Lett., 1994, 24, 159–169 CrossRef CAS.
- G. Moretti, F. Filippone and M. Satta, Surf. Interface Anal., 2001, 31, 249–254 CrossRef CAS.
- X. Qin, J. M. Wang, J. Xie, F. Z. Li, L. Wen and X. H. Wang, Phys. Chem. Chem. Phys., 2012, 14, 2669–2677 RSC.
- J. J. Yang and J. S. Tse, J. Phys. Chem. A, 2011, 115, 13045–13049 CrossRef CAS PubMed.
| This journal is © The Royal Society of Chemistry 2017 |

