 Open Access Article
Creative Commons Attribution 3.0 Unported Licence
A simple colorimetric and fluorescent probe with high selectivity towards cysteine over homocysteine and glutathione†
Jing Guoa,
Ziyu Kuaib,
Zhixiang Zhangc,
Qingbiao Yang *a,
Yaming Shan*b and
Yaoxian Lia
aCollege of Chemistry, Jilin University, Changchun 130021, P. R. China. E-mail: yangqb@jlu.edu.cn; Fax: +86-431-88499576; Tel: +86-431-88499576
bNational Engineering Laboratory for AIDS Vaccine, College of Life Sciences, Jilin University, Changchun 130021, P. R. China. E-mail: shanym@jlu.edu.cn; Fax: +86-431-85167751; Tel: +86-431-89228979
cInstitute of Theoretical Chemistry, Jilin University, Changchun 130021, P. R. China
First published on 29th March 2017
Abstract
A novel fluorescent probe (AQDA) based on quinizarin is designed and synthesized. Owing to a nucleophilic addition and a specific intramolecular cyclization reaction, the probe displays high selectivity towards cysteine (Cys) relative to other natural amino acids. The maximum fluorescent intensity is 30-fold that of the initial value in the presence of 5.0 equiv. Cys, and its detection limit is 0.158 μM. The recognition mechanism is further confirmed through mass spectroscopy and proton nuclear magnetic resonance titration. Simultaneously, the fluorescence enhancement mechanism is characterized by theoretical calculations, and experimental data are consistent with the theoretical results. Finally, the cellular imaging experiment verifies that AQDA possesses the capacity to detect endogenous Cys in living cells.
Introduction
Biological thiols, such as cysteine (Cys), homocysteine (Hcy) and glutathione (GSH), are components of numerous peptides. These thiols play crucial roles in multiple physiological processes.1 Recently, numerous investigations have demonstrated that many syndromes, such as liver damage, skin lesions, hair depigmentation or slow growth in children, are related to abnormal cysteine levels.2 Moreover, high Hcy levels in blood serum are associated with hip fractures and cardiovascular diseases.3 GSH, an important antioxidant in eukaryotic cells, maintains the internal redox environment and protects organelles from reactive oxygen species (ROS).4 Thus, the detection of biological thiols has become a significant method to diagnose certain diseases. Several analytical strategies for the detection of thiols have been proposed,5–9 including high-performance liquid chromatography,5 capillary electrophoresis,6 mass spectrometry,7 colorimetric assays8 and electrochemical methods.9 However, despite the advantages of these methods, such as low detection limits, good reproducibility and high accuracy, they exhibit numerous drawbacks, such as high cost, complicated pretreatment and difficulty to apply in vivo.Owing to real-time sensing and ease of operation, fluorescent sensors have been widely developed in the past few years.10 For biothiols, design strategies are based on certain reactions between recognition groups and testing samples, inducing considerable changes on the fluorescence quantum yield during the recognition process.11 The reaction mechanisms include Michael addition,12 cyclization reaction with aldehyde,13 cleavage reaction of disulfide bonds14 and others.15 However, due to the similar structure and reactivity of biological thiols, many probes cannot discriminate Cys, Hcy and GSH.16 Recently, several sensors that can distinguish Cys/Hcy from GSH have been designed and synthesized.17 And probes specific response to Cys have also been proposed.18 However, these sensors have apparent defects and limitations, such as sophisticated synthesis, and applying them in biological systems is difficult. In addition, they require high equivalents (20 to 100) of Cys to achieve maximal fluorescent response. In order to overcome these obstacles, Chen et al.19 based on the research of Strongin et al.18a confirmed that sensors with two acrylate moieties possess superior selectivity towards Cys compared with the single acrylate-containing analogue.
Inspired by the pioneering work, a novel quinizarin-based probe (AQDA) bearing two acrylate moieties is developed. The probe exhibits outstanding sensitivity and selectivity towards Cys. The synthesis and sensor mechanism of AQDA is shown in Scheme 1. As the terminal olefin is an effective target for cysteine, the first step is nucleophilic addition. Then, owing to high reactivity of Cys and electrophilicity of the carbonyl, the amino of Cys easily combines with carbonyl and forms a lactam ring. Thus, in the second step, AQDA is decomposed into quinizarin and lactam rings. With the departure of acrylate moiety, the energy gap between the highest occupied molecular orbital (HOMO) and lowest unoccupied molecular orbital (LUMO) is narrowed, and a strong orange fluorescence is emitted. However, on account of the instability of eight-membered ring lactams or steric hindrance of tripeptide, no evidence of similar reaction processes were obtained for Hcy or GSH. Therefore, AQDA could discriminate Cys from other amino acids, including Hcy/GSH. In addition, the maximal fluorescent response is achieved in the presence of 5.0 equiv. Cys, and only 20% organic solvent is sufficient for in the detection.
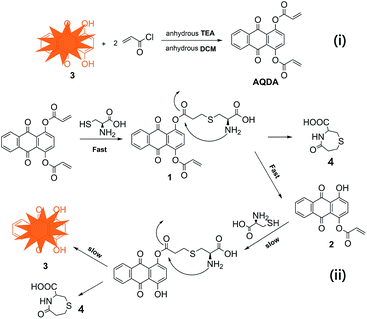 | ||
| Scheme 1 i) Synthesis of sensors AQDA. Reagents and conditions: anhydrous TEA, DCM, ice-water bath, 5 h. (ii) Sensor mechanism of ratiometric fluorescent probe AQDA for Cys. | ||
Experimental
Materials and instrumentations
All reagents were purchased from J&K or Sigma-Aldrich Chemical Co. and used without further purification. Solvents were dried according to standard procedures. Deionized water was used to prepare HEPES buffer and amino-acid (TLC). 1H and 13C NMR spectra were taken on a Bruker AV-400 MHz spectrometer with CDCl3 solutions and tetramethylsilane (TMS) as the internal standard. Mass spectra were measured on the ESI mode with an Agilent1290-microTOF Q II instrument. UV-vis spectra were obtained on Hitachi U-3010 spectrometer (1 cm quartz cell) and fluorescent measurements were recorded on a HitachiF-4500 spectrometer (1 cm quartz cell). The pH was measured on a Mettler-Toledo Instruments DELTA 320 corrected by commercial standard solution. Fluorescence microscopy (Olympus IX71-F22FL inversion lens) was applied in cellular imaging. All tests were performed at 298.0 ± 0.2 K.Synthesis of 9,10-anthraquinone-1,4-diyl diacrylate (AQDA)
Quinizarin (1.20 g, 5 mmol) was dissolved in 50 mL anhydrous dichloromethane in an ice-water bath. Then anhydrous trimethylamine (1.67 mL, 12 mmol) was slowly added to the solutions. After stirred 10 min, a solution of acryloyl chloride (8.20 mL, 20 mmol) in 10 mL anhydrous dichloromethane was added to the above mixture via syringe dropwise in 30 min. Five hours later, the reaction was quenched with 5 mL water. The resulting solvent was removed under reduced pressure and the crude mixture was treated with 200 mL water. Then, the residue was filtered to remove the salt and organic acids. Finally, the precipitate was dried in a vacuum oven at 50 °C. The residues were without any further purification. 1H NMR (400 MHz, CDCl3, ppm): δ 8.16 (d, J = 3.5 Hz, 2H), 7.74 (m, 2H), 7.50 (s, 2H), 6.73 (d, J = 17.3 Hz, 2H), 6.50 (dd, J = 17.2, 10.5 Hz, 2H), 6.17 (d, J = 10.4 Hz, 2H); 13C NMR (101 MHz, CDCl3, ppm): δ 181.47, 164.27, 148.09, 134.12, 133.47, 133.32, 130.97, 127.51, 126.97, 126.28 (Fig. S1†); HRMS (ESI-TOF) calcd for C20H14O6+ [M + H]+: 349.0707; found, 349.0699 (Fig. S2†).General absorption and fluorescence spectra measurements
AQDA was dissolved in acetonitrile at 5 × 10⁻³ M and stored in the fridge. The amino-acid (His, Ala, Asn, Asp, Gln, Arg, Glu, Met, Phe, Trp, Lys, Ser, Hcy, GSH, Cys) stocks were all in aqueous solution (HEPES buffer, 20 mM, pH = 7.4) at 1.0 × 10⁻² M for absorption and fluorescence spectra analyses. Then suck up 1 mL AQDA stock solution into the pipette, dilute to 500 mL with a mixture of acetonitrile–water (2![[thin space (1/6-em)]](https://www.rsc.org/images/entities/char_2009.gif) :
:![[thin space (1/6-em)]](https://www.rsc.org/images/entities/char_2009.gif) 8, v/v) buffer at pH = 7.4 (HEPES, 20 mM). The resulting solution was shaken violently. For all of the fluorescence testing, the concentration of fluorescent probe AQDA was 1.0 × 10⁻⁵ M and the excitation wavelength of fluorescence spectra was at 470 nm, the slit was 5 nm/5 nm. Meanwhile dilute 1 mL stock to 100 mL with the used mixture solution. We obtained 5.0 × 10⁻⁵ M AQDA, which was applied in the absorption spectra analyses.
8, v/v) buffer at pH = 7.4 (HEPES, 20 mM). The resulting solution was shaken violently. For all of the fluorescence testing, the concentration of fluorescent probe AQDA was 1.0 × 10⁻⁵ M and the excitation wavelength of fluorescence spectra was at 470 nm, the slit was 5 nm/5 nm. Meanwhile dilute 1 mL stock to 100 mL with the used mixture solution. We obtained 5.0 × 10⁻⁵ M AQDA, which was applied in the absorption spectra analyses.
Theoretical calculation
All of the calculations were carried through Gaussian09 program package.20 Geometry optimization was carried out with DFT (density functional theory) method. The solvent effect of acetonitrile was taken into account as the polarizable continuum model (PCM).21Cell culture and cell imaging
According to the previous procedure,1b,18g HeLa cells were cultured in Dulbecco's Modified Eagle Medium (DMEM) with 10% (v/v) Fetal Bovine Serum (FBS) in a humidified atmosphere of 5% CO2 at 37 °C. Before cellular imaging, HeLa cells were seeded in 24-well plates and allowed to grow for 24 h. In the next day, some cells were pre-treated with the DL-buthionine sulfoximine (1 mM, BSO, an inhibitor of the GSH) in HEPES buffer (20 mM, pH = 7.4) for 3 h at 37 °C. And parts of cells were incubated with N-ethylmaleimide (5 mM, NEM, a thiol-blocking agent) for 30 min under the same condition. Then the culture medium was washed with the HEPES buffer three times in order to remove the residual BSO or NEM. Next AQDA (20 μM) was added to the 24-well plates and the cells were incubated for another 30 min. After most of the fluorescence sensor successfully immersed into cells, the culture medium was washed with HEPES buffer again and the fluorescence images were carried out by the fluorescent microscope (Olympus IX71-F22FL inversion lens).Results and discussion
Naked eye recognition of Cys, Hcy and GSH
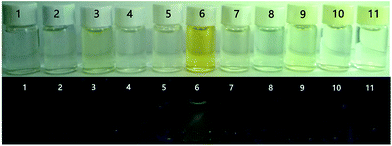
The synthesis of AQDA is a one-step reaction. Given the similarity of the structures of biothiols, numerous fluorescent probes cannot discriminate Cys, Hcy and GSH. However, AQDA can specifically recognize Cys. As shown in Fig. 1, 10 amino acids (including His, Hcy, Asp, Gln, Cys, Arg, Met, GSH (500 equiv.), Trp and Ser) were used in the selectivity experiments under sunlight and illumination with a 365 nm UV lamp. An obvious colorimetric and fluorescence change was observed only when Cys (5.0 equiv.) was added to the buffer solution. Other samples (50.0 equiv.) exhibited no noticeable change visible to the naked eye.UV-vis absorption spectrum
The UV-vis spectral changes of AQDA (50 μM) treated with different amino acids in the ACN–HEPES buffer (pH = 7.4, 2![[thin space (1/6-em)]](https://www.rsc.org/images/entities/char_2009.gif) :
:![[thin space (1/6-em)]](https://www.rsc.org/images/entities/char_2009.gif) 8, v/v) were shown in Fig. S3.† The sensor showed an absorption band at 340 nm in the absence of Cys. With the addition of Cys (5.0 equiv.), the absorption band at 340 nm decreased in UV-vis spectra. Moreover, a new band emerged at 470 nm, indicating that a certain chemical reaction occurred at the terminal olefin of the probe. In addition, an obvious color change from colorless to orange was also observed (Fig. 1). Other interferential amino acids (50 equiv.), including His, Ala, Asn, Asp, Gln, Arg, Glu, Met, Phe, Trp, Tyr, Lys, Ser, Hcy and GSH, just slightly affected the intensity of the absorption spectra.
8, v/v) were shown in Fig. S3.† The sensor showed an absorption band at 340 nm in the absence of Cys. With the addition of Cys (5.0 equiv.), the absorption band at 340 nm decreased in UV-vis spectra. Moreover, a new band emerged at 470 nm, indicating that a certain chemical reaction occurred at the terminal olefin of the probe. In addition, an obvious color change from colorless to orange was also observed (Fig. 1). Other interferential amino acids (50 equiv.), including His, Ala, Asn, Asp, Gln, Arg, Glu, Met, Phe, Trp, Tyr, Lys, Ser, Hcy and GSH, just slightly affected the intensity of the absorption spectra.
These results further confirmed that AQDA exhibits selectivity towards Cys in the UV-vis absorption spectra.
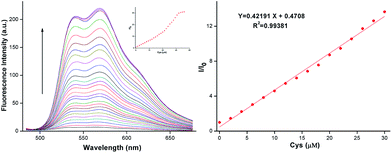
Fluorescence spectra titration
We then investigated the concentration dependent response of AQDA towards Cys in the fluorescence spectra. During Cys titration with the probe, a new emission band at 565 nm was increasing remarkably. The increasing of Cys induced a nearly 30-fold variation in the fluorescence ratio (I/I0) at 565 nm. When the concentration of Cys reached 50 μM, the fluorescence reached the maximum. A calibration graph was obtained wherein the formula (I/I0 − 1) was used to obtain the Y-axis coordinate values, while the Cys concentration was used to obtain the X-axis coordinate values. The graph illustrated an excellent linear relationship in the range of 0–30.0 μM, with coefficient R2 = 0.99381 (Fig. 2). This result implied that AQDA can quantitatively analyze cysteine.The detection limit of AQDA for Cys was calculated according to the following formula:
| DL = 3σ/k, |
Fluorescence interference and competition experiments
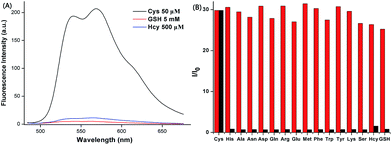
The anti-interference of the probe is a highly significant index for the evaluation of fluorescence sensor performance. Therefore, in selectivity experiments, 16 kinds of natural amino acids, including His, Ala, Asn, Asp, Gln, Arg, Glu, Met, Phe, Trp, Tyr, Lys, Ser, Hcy, GSH (500.0 equiv.) and Cys (5.0 equiv.) were added to the ACN–HEPES buffer solution (20 mM, pH = 7.4, 2![[thin space (1/6-em)]](https://www.rsc.org/images/entities/char_2009.gif) :
:![[thin space (1/6-em)]](https://www.rsc.org/images/entities/char_2009.gif) 8, v/v), containing 10 μM AQDA. As shown in Fig. 3a and S4,† a strong fluorescence emission peak was observed at 565 nm (λex = 470 nm) only in the presence of Cys. Other amino acids (50 equiv.), including Hcy and GSH only slightly affected the intensity of fluorescence.
8, v/v), containing 10 μM AQDA. As shown in Fig. 3a and S4,† a strong fluorescence emission peak was observed at 565 nm (λex = 470 nm) only in the presence of Cys. Other amino acids (50 equiv.), including Hcy and GSH only slightly affected the intensity of fluorescence.
A significant feature of AQDA is its high selectivity towards Cys over other competitive amino acids. The variation in fluorescence spectra of AQDA (10 μM) induced by Cys (5.0 equiv.) and other competing amino acids (50 equiv.; including His, Ala, Asn, Asp, Gln, Arg, Glu, Met, Phe, Trp, Tyr, Lys, Ser, Hcy and GSH) in ACN–HEPES buffer (20 mM, pH = 7.4, 2![[thin space (1/6-em)]](https://www.rsc.org/images/entities/char_2009.gif) :
:![[thin space (1/6-em)]](https://www.rsc.org/images/entities/char_2009.gif) 8, v/v) are shown in Fig. S4.† We can draw the conclusion that in the presence of other analytes, even Hcy, GSH had no evident influence on Cys detection. Based on the interference and competition experiments, a histogram (Fig. 3b) was plotted so that we could more intuitively observe the high sensitivity and selectivity of AQDA.
8, v/v) are shown in Fig. S4.† We can draw the conclusion that in the presence of other analytes, even Hcy, GSH had no evident influence on Cys detection. Based on the interference and competition experiments, a histogram (Fig. 3b) was plotted so that we could more intuitively observe the high sensitivity and selectivity of AQDA.
Reaction time on sensing Cys
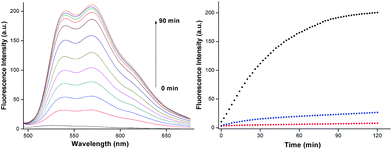
Response time is one of the most significant parameters for many reaction fluorescence probes. To investigate the reaction time of AQDA towards Cys (5 equiv.) at 25 °C, we studied the time-dependent fluorescence changes and found that the fluorescence intensity of AQDA at 565 nm increased to the top in 90 min (shown in Fig. 4). The response time is not fast compared with those of other reports.18d,23 However, most of the other fluorescence probes require large amounts of thiols, many of which exceed 20 equiv.18e or 100 equiv.24 Next, we compared the reaction time among Cys, Hcy (50 equiv.) and GSH (500 equiv.). No significant increase was observed over a long period of time (2 h) when Hcy or GSH was added. The result showed that the reactivity of Cys is higher than that of Hcy/GSH.pH effect
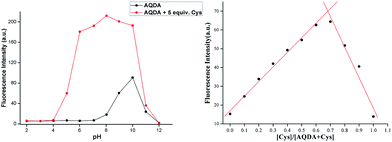
Cys is a type of acidic amino acid that exists in neutral or slightly acidic environment. In alkaline aqueous systems, Cys can easily combine with another Cys to form cystine. This requires the as-obtained probes can keep stable under acidic conditions. However, several fluorescence probes based on fluorophores, such as rhodamine, are unstable in acidic systems. Quinizarin, also known as Solvent Orange 86, is a common organic dye that emits strong fluorescence at pH value of less than 10.0. When the pH exceeds this level, the solution turns from orange to purple with strong fluorescence quenching.The fluorescence intensity of AQDA (10 μM) towards Cys (5 equiv.) in a series of solutions with different pH values was investigated. As shown in Fig. 5, when pH value increased from 2.00 to 4.01, the emission intensity was weak regardless of the presence or absence of Cys in a mixed system (ACN–HEPES = 2![[thin space (1/6-em)]](https://www.rsc.org/images/entities/char_2009.gif) :
:![[thin space (1/6-em)]](https://www.rsc.org/images/entities/char_2009.gif) 8, v/v). With the increasing of pH, the fluorescence emission of AQDA enhanced remarkably. As pH level of the solution reached 6.03, the peak of the fluorescence spectra at 565 nm was fairly constant. Fluorescence signals were higher in the pH range of 6.03–8.02 compared with those in the other pH levels. Given that ester group is unstable in alkaline aqueous systems, AQDA could be partially hydrolyzed. Once the probe was decomposed into compound 3, a fluorescence emission emerged even if cysteine was in absence. Moreover, strong fluorescence quenching was also observed (pH values higher than 10). As the physiological environment is slightly alkaline, pH = 7.4 was selected as one of the experiment parameters.
8, v/v). With the increasing of pH, the fluorescence emission of AQDA enhanced remarkably. As pH level of the solution reached 6.03, the peak of the fluorescence spectra at 565 nm was fairly constant. Fluorescence signals were higher in the pH range of 6.03–8.02 compared with those in the other pH levels. Given that ester group is unstable in alkaline aqueous systems, AQDA could be partially hydrolyzed. Once the probe was decomposed into compound 3, a fluorescence emission emerged even if cysteine was in absence. Moreover, strong fluorescence quenching was also observed (pH values higher than 10). As the physiological environment is slightly alkaline, pH = 7.4 was selected as one of the experiment parameters.
Recognition mechanism and theoretical calculations
The fluorescence quenching of AQDA might result from the low-lying n–π* transition related to the attachment of α, β-unsaturated ester to the fluorophore. Due to the probe via conjugate addition binding with Cys, the conjugation effect of the dye molecule was improved, with a significant red shift in the absorption spectra. Meanwhile, high reactivity of Cys induced the lactam ring formation and ester bond fracturing with decreasing in energy gaps. Thus, the absorption band of the UV spectra shifted from 340 nm to 470 nm, and a strong fluorescence was emitted. The reaction intermediates and end product were captured by mass spectroscopy (Fig. S5†). We observed the following peaks at m/z: 470.4, 416.4, 241.0, and 176.0, corresponding to [compound 1 + H]+, [compound 2 + H]+, [compound 3 + H]+ and [compound 4 + H]+, respectively. On the basis of these results, a tentatively conclude was drawn that the conjugate addition reaction on the acrylate moieties did not occur simultaneously. Furthermore, according to the liquid chromatography-mass spectrometry results, the reactivity of AQDA is higher than that of compound 2. Thus, the fluorescence intensity of AQDA is linearly related to Cys under low concentration condition. In order to obtain the details of the reaction, a Job's plot was shown in Fig. 5. The maximum fluorescent intensity at 565 nm was twice of that of AQDA, indicating the 1![[thin space (1/6-em)]](https://www.rsc.org/images/entities/char_2009.gif) :
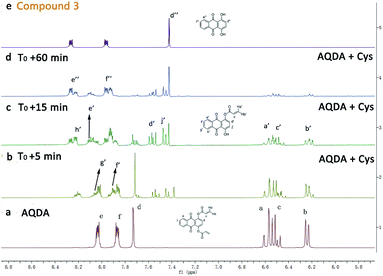
:![[thin space (1/6-em)]](https://www.rsc.org/images/entities/char_2009.gif) 2 stoichiometry for the reaction between AQDA and Cys. Then we compared the fluorescence spectra of the end product and that of compound 3 (Fig. S6†). The fluorescence emission peaks of quinizarin were in accordance with the end-product. Based on the above evidence, the recognition mechanism of Cys was sketched out in Scheme 1. Finally, the mechanism was further confirmed through the 1H NMR titration experiments (Fig. 6). With the addition of 5.0 equiv. of Cys to AQDA in d6-DMSO/D2O (6
2 stoichiometry for the reaction between AQDA and Cys. Then we compared the fluorescence spectra of the end product and that of compound 3 (Fig. S6†). The fluorescence emission peaks of quinizarin were in accordance with the end-product. Based on the above evidence, the recognition mechanism of Cys was sketched out in Scheme 1. Finally, the mechanism was further confirmed through the 1H NMR titration experiments (Fig. 6). With the addition of 5.0 equiv. of Cys to AQDA in d6-DMSO/D2O (6![[thin space (1/6-em)]](https://www.rsc.org/images/entities/char_2009.gif) :
:![[thin space (1/6-em)]](https://www.rsc.org/images/entities/char_2009.gif) 1, v/v), signals corresponding to terminal olefins (Ha, Hb and Hc) began to decrease, indicating that the conjugate addition occurred. And, two obvious proton signals (Hd′ and Hj′) emerged, suggesting the cleavage of the ester bond. Moreover, it was clear that the recognition processes could be divided two steps. With the continuous extension of reaction time, the characteristic signals (Ha, Hb and Hc) virtually disappeared completely, and the signals belonging to the intermediate (Hd′ and Hj′) were weakened as well. Finally, the characteristic signals corresponding to compound 3 (Hd′′, He′′ and Hf′′) appeared, and the majority of the probe transformed into quinizarin in approximately 60 min.
1, v/v), signals corresponding to terminal olefins (Ha, Hb and Hc) began to decrease, indicating that the conjugate addition occurred. And, two obvious proton signals (Hd′ and Hj′) emerged, suggesting the cleavage of the ester bond. Moreover, it was clear that the recognition processes could be divided two steps. With the continuous extension of reaction time, the characteristic signals (Ha, Hb and Hc) virtually disappeared completely, and the signals belonging to the intermediate (Hd′ and Hj′) were weakened as well. Finally, the characteristic signals corresponding to compound 3 (Hd′′, He′′ and Hf′′) appeared, and the majority of the probe transformed into quinizarin in approximately 60 min.
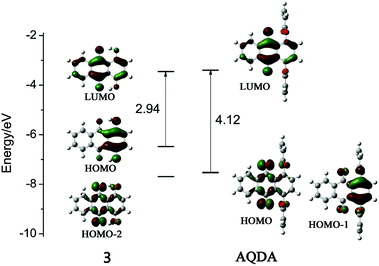
For investigation of the fluorescence mechanism of quinizarin and AQDA, theoretical calculations that depend on time-dependent density functional theory (DFT/TD-DFT) methods were utilized. B3LYP was chosen as functional and 6-311+G(d) was adopted as basis set. All of the optimization and spectrum simulation were calculated under Gaussian 09 program package. The ground and first excited state of compound 3 and AQDA were both optimized, and their simulated absorption and fluorescence spectra are in agreement with the experimental results, as listed in Table 2 (shown in ESI†). For both of them, there were trivial structural variation between the ground and the first excited state. Therefore, the distributions of molecular orbitals shown in Fig. 7 were not affected by steric effects. However, the order of occupied orbitals was influenced by electronic effects. For example, HOMO (HOMO-2) in compound 3 corresponded to HOMO-1 (HOMO) in AQDA, and the energy gap between HOMO and LUMO increased because the substitution of acrylic group decreased the HOMO level, subsequently leading to the degeneration of HOMO and HOMO-1.
For quinizarin, a strong absorption band at 485 nm corresponding to HOMO → LUMO (π → π*) transition was detected. A simulated fluorescence emission peak with high oscillator strength was also found at 572 nm. On the contrary, the strong peak (354 nm) for AQDA was attributed to three transitions. The maximum absorption peak (422 nm), which corresponded to the first excitation (HOMO → LUMO, n → π*) was too weak for detection. According to the Kasha rule,25 no fluorescence emission was observed, as indicated by our calculation (479 nm, f = 0.0004).
Cellular imaging
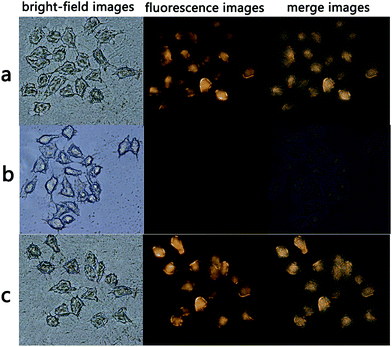
AQDA displayed high selectivity towards Cys compared with Hcy/GSH and other amino acids. According to a previous research,26 the intracellular concentrations of GSH and Cys are 1–10 mM and 30–200 μM, respectively. In addition, the interference of Hcy can be disregarded in cellular imaging, because the total Hcy intracellular concentration is markedly lower than that of Cys.27 Thus, AQDA might be an applicable fluorescence sensor for intracellular Cys detection. A fluorescence imaging experiment was conducted in HeLa cells, as shown in Fig. 8a. Strong fluorescence emitted from the cytoplasmic matrix was observed, demonstrating that the probe had successfully immersed into the cells.The substance that induced fluorescence enhancement was then identified. HeLa cells were pretreated with N-ethylmaleimide (NEM) for 30 min and then incubated with AQDA (20 μM) for another 30 min. As shown in Fig. 8b, no fluorescence signal was detected. As N-ethylmaleimide is a well-known thiol blocking reagent, and intracellular thiols are believed to be related to this phenomenon. It has been proved that AQDA can recognize Cys even in the presence of high GSH concentration in vitro. A tentative conclusion was drawn that the intracellular cysteine induced changes of the fluorescence. Finally, BSO (DL-buthionine sulfoximine, a sulfoximine that reduces GSH levels) was used to pretreat HeLa cells for 3 h prior to the incubation of the cells with AQDA. Fluorescence emission remained strong (Fig. 8c). On the basis of these results, we concluded that AQDA can detect endogenous Cys. In other words, the sensor can be a useful instrument to monitor Cys in living cells.
Conclusion
A novel fluorescent probe AQDA was developed through a one-step reaction, which exhibited colorimetric and ratiometric fluorescence response towards cysteine even at high concentrations of homocysteine or glutathione. A nearly 30-fold variation of the fluorescence ratio (I/I0) at 565 nm was observed in the presence of 5.0 equiv. Cys. Furthermore, with the addition of Cys, an obvious visual change from colorless to orange was observed. Then, through ESI-MS analysis and 1H NMR titration, the recognition mechanism was further confirmed. Moreover, the theoretical calculations results were consistent with the experiment data. Finally, we used HeLa cells to perform cellular imaging. The results of the survey performed on living cells indicated that AQDA has the capacity to detect endogenous Cys.Acknowledgements
We thank the National Natural Science Foundation of China (no. 21174052), the Natural Science Foundation of Jilin Province of China (no. 20160101311JC) and Scientific Frontier and Interdisciplinary Innovation Project Funding of Jilin University (no. 2013ZY16) for their generous financial support.Notes and references
- (a) Z. A. Wood, E. Schrder, J. R. Harris and L. B. Poole, Trends Biochem. Sci., 2003, 28, 32 CrossRef CAS PubMed; (b) J. Yin, Y. Kwon, D. Kim, D. Lee, G. Kim, Y. Hu, J. Ryu and J. Yoon, J. Am. Chem. Soc., 2014, 136, 5351 CrossRef CAS PubMed.
- (a) Y. Wang, J. Zheng, Z. Zhang, C. Yuan and D. Fu, Colloids Surf., A, 2009, 342, 102 CrossRef CAS; (b) N. Zhang, F. Qu, H. Luo and N. Li, Biosens. Bioelectron., 2013, 42, 214 CrossRef CAS PubMed; (c) S. Shahrokhian, Anal. Chem., 2001, 73, 5972 CrossRef CAS PubMed.
- (a) R. R. McLean, P. F. Jacques, J. Selhub, K. L. Tucker, E. J. Samelson, K. E. Broe, M. T. Hannan, L. A. Cupples and D. P. Kiel, N. Engl. J. Med., 2004, 350, 2042 CrossRef CAS PubMed; (b) J. B. van Meurs, R. A. Dhonukshe-Rutten, S. M. Pluijm, M. van der Klift, R. de Jonge, J. Lindemans, L. C. de Groot, A. Hofman, J. C. Witteman, J. P. van Leeuwen, M. M. Breteler, P. Lips, H. A. Pols and A. G. Uitterlinden, N. Engl. J. Med., 2004, 350, 2033 CrossRef CAS PubMed.
- D. M. Townsend, K. D. Tew and H. Tapiero, Biomed. Pharmacother., 2003, 57, 145 CrossRef CAS.
- (a) A. Ivanov, I. Nazimov and L. Baratova, J. Chromatogr. A, 2000, 870, 433 CrossRef CAS PubMed; (b) A. Ivanov, I. Nazimov and L. Baratova, J. Chromatogr. A, 2000, 895, 157 CrossRef CAS PubMed.
- O. Nekrassova, N. Lawrence and R. Compton, Talanta, 2003, 60, 1085 CrossRef CAS PubMed.
- (a) A. P. Vellasco, R. Haddad, M. N. Eberlin and N. F. Höehr, Analyst, 2002, 127, 1050 RSC; (b) K. Xu, Y. Zhang, B. Tang, J. Laskin, P. J. Roach and H. Chen, Anal. Chem., 2010, 82, 6926 CrossRef CAS PubMed.
- (a) J. Zhu, I. Dhimitruka and D. Pei, Org. Lett., 2004, 6, 3809 CrossRef CAS PubMed; (b) Y. Guo, S. Shao, J. Xu, Y. Shi and S. Jiang, Tetrahedron Lett., 2004, 45, 6477 CrossRef CAS; (c) J. V. Ros-Lis, B. García, D. Jiménez, R. Martínez-Máñez, F. Sancenón, J. Soto, F. Gonzalvo and M. C. Valldecabres, J. Am. Chem. Soc., 2004, 126, 4064 CrossRef CAS PubMed.
- P. T. Lee, J. E. Thomson, A. Karina, C. Salter, C. Johnston, S. G. Davies and R. G. Compton, Analyst, 2015, 140, 236 RSC.
- (a) F. Huo, J. Kang, C. Yin, Y. Zhang and J. Chao, Sens. Actuators, B, 2015, 207, 139 CrossRef CAS; (b) H. Lv, X. Yang, Y. Zhong, Y. Guo, Z. Li and H. Li, Anal. Chem., 2014, 86, 1800 CrossRef CAS PubMed.
- L. Niu, Y. Chen, H. Zheng, L. Wu, C. Tung and Q. Yang, Chem. Soc. Rev., 2015, 44, 6143 RSC.
- (a) G. Kim, K. Lee, H. Kwon and H. Kim, Org. Lett., 2011, 13, 2799 CrossRef CAS PubMed; (b) H. Jung, K. Ko, G. Kim, A. Lee, Y. Na, C. Kang, J. Lee and J. Kim, Org. Lett., 2011, 13, 1498 CrossRef CAS PubMed; (c) H. Kwon, K. Lee and H. Kim, Chem. Commun., 2011, 47, 1773 RSC.
- (a) M. Hu, J. Fan, H. Li, K. Song, S. Wang, G. Cheng and X. Peng, Org. Biomol. Chem., 2011, 9, 980 RSC; (b) J. Mei, Y. Wang, J. Tong, J. Wang, A. Qin, J. Sun and B. Tang, Chem.–Eur. J., 2013, 19, 613 CrossRef CAS PubMed; (c) F. Kong, R. Liu, R. Chu, X. Wang, K. Xu and B. Tang, Chem. Commun., 2013, 49, 9176 RSC.
- (a) H. Maeda, H. Matsuno, M. Ushida, K. Katayama, K. Saeki and N. Itoh, Angew. Chem., Int. Ed., 2005, 117, 2982 CrossRef; (b) S. Yan, C. Chi, L. Chung, W. Kin and C. Ming, Chem.–Eur. J., 2010, 16, 3308 CrossRef PubMed; (c) J. Lee, C. Lim, Y. Tian, J. Han and B. Cho, J. Am. Chem. Soc., 2010, 132, 1216 CrossRef CAS PubMed.
- (a) M. Zhang, M. Yu, F. Li, M. Zhu, M. Li, Y. Gao, L. Li, Z. Liu, J. Zhang, D. Zhang, T. Yi and C. Huang, J. Am. Chem. Soc., 2007, 129, 10322 CrossRef CAS PubMed; (b) Y. Shi, J. Yao, Y. Duan, Q. Mi, J. Chen, Q. Xu, G. Gou, Y. Zhou and J. Zhang, Bioorg. Med. Chem. Lett., 2013, 23, 2538 CrossRef CAS PubMed; (c) L. Niu, Y. Guan, Y. Chen, L. Wu, C. Tung and Q. Yang, J. Am. Chem. Soc., 2012, 134, 18928 CrossRef CAS PubMed; (d) J. Liu, Y. Sun, Y. Huo, H. Zhang, L. Wang, P. Zhang, D. Song, Y. Shi and W. Guo, J. Am. Chem. Soc., 2014, 136, 574 CrossRef CAS PubMed; (e) F. Wang, L. Zhou, C. Zhao, R. Wang, Q. Fei, S. Luo, Z. Guo, H. Tian and W. Zhu, Chem. Sci., 2015, 6, 2584 RSC.
- (a) X. Li, S. Qian, Q. He, B. Yang, J. Li and Y. Hu, Org. Biomol. Chem., 2010, 8, 3627 RSC; (b) M. Wei, P. Yin, Y. Shen, L. Zhang, J. Deng, S. Xue, H. Li, B. Guo, Y. Zhang and S. Yao, Chem. Commun., 2013, 49, 4640 RSC; (c) X. Wei, X. Yang, Y. Feng, N. Peng, H. Yu, M. Zhu, X. Xi, Q. Guo and X. Meng, Sens. Actuators, B, 2016, 231, 285 CrossRef CAS; (d) Y. Liao, P. Venkatesan, L. Wei and S. Wu, Sens. Actuators, B, 2016, 232, 732 CrossRef CAS.
- (a) X. Liu, N. Xi, S. Liu, Y. Ma, H. Yang, H. Li, J. He, Q. Zhao, F. Li and W. Huang, J. Mater. Chem., 2012, 22, 7894 RSC; (b) P. Wang, J. Liu, X. Lv, Y. Liu, Y. Zhao and W. Guo, Org. Lett., 2012, 14, 520 CrossRef CAS PubMed; (c) P. Das, A. K. Mandal, N. B. Chandar, M. Baidya, H. B. Bhatt, B. Ganguly, S. K. Ghosh and A. Das, Chem.–Eur. J., 2012, 18, 15382 CrossRef CAS PubMed; (d) L. Yuan, W. Lin, Y. Xie, S. Zhu and S. Zhao, Chem.–Eur. J., 2012, 18, 14520 CrossRef CAS PubMed; (e) M. D. Hammers and M. D. Pluth, Anal. Chem., 2014, 86, 7135 CrossRef CAS PubMed; (f) J. Liu, Y. Q. Sun, H. Zhang, Y. Huo, Y. Shi and W. Guo, Chem. Sci., 2014, 5, 3183 RSC.
- (a) X. Yang, Y. Guo and R. M. Strongin, Angew. Chem., Int. Ed., 2011, 50, 10690 CrossRef CAS PubMed; (b) Z. Guo, S. Nam, S. Park and J. Yoon, Chem. Sci., 2012, 3, 2760 RSC; (c) X. Dai, Q. Wu, P. Wang, J. Tian, Y. Xu, S. Wang, J. Miao and B. Zhao, Biosens. Bioelectron., 2014, 59, 35 CrossRef CAS PubMed; (d) B. Zhu, B. Guo, Y. Zhao, B. Zhang and B. Du, Biosens. Bioelectron., 2014, 55, 72 CrossRef CAS PubMed; (e) Y. Liu, S. Zhang, X. Lv, Y. Sun, J. Liu and W. Guo, Analyst, 2014, 139, 4081 RSC; (f) C. Zhao, X. Li and F. Wang, Chem.–Asian J., 2014, 9, 1777 CrossRef CAS PubMed; (g) M. Tian, F. Guo, Y. Sun, W. Zhang, F. Miao, Y. Liu, G. Song, C. Ho, X. Yu, J. Sun and W. Wong, Org. Biomol. Chem., 2014, 12, 6128 RSC.
- H. Wang, G. Zhou, H. Gai and X. Chen, Chem. Commun., 2012, 48, 8341 RSC.
- M. J. Frisch, G. W. Trucks, H. B. Schlegel, G. E. Scuseria, M. A. Robb, J. R. Cheeseman, V. G. Zakrzewski, J. A. Montgomery Jr, R. E. Stratmann, J. C. Burant, S. Dapprich, J. M. Millam, A. D. Daniels, K. N. Kudin, M. C. Strain, O. Farkas, J. Tomasi, V. Barone, M. Cossi, R. Cammi, B. Mennucci, C. Pomelli, C. Adamo, S. Clifford, J. Ochterski, G. A. Petersson, P. Y. Ayala, Q. Cui, K. Morokuma, D. K. Malick, A. D. Rabuck, K. Raghavachari, J. B. Foresman, J. Cioslowski, J. V. Ortiz, B. B. Stefanov, G. Liu, A. Liashenko, P. Piskorz, I. Komaromi, R. Gomperts, R. L. Martin, D. J. Fox, T. Keith, M. A. Al-Laham, C. Y. Peng, A. Nanayakkara, C. Gonzalez, M. Challacombe, P. M. W. Gill, B. G. Johnson, W. Chen, M. W. Wong, J. L. Andres, M. Head-Gordon, E. S. Replogle and J. A. Pople, Gaussian 09, Gaussian, Inc, Wallingford CT, 2009 Search PubMed.
- A. T. Bens, J. Ern, K. Kuldova, H. P. Trommsdorff and C. Kryschi, J. Lumin., 2001, 94, 51 CrossRef.
- S. Lim, D. Yoon, D. Ha, J. Ahn, D. Kim, H. Kown, H. Ha and H. Kim, Sens. Actuators, B, 2013, 188, 111 CrossRef CAS.
- X. Yang, Q. Huang, Y. Zhong, Z. Li, H. Li, M. Lowry, J. O. Escobedo and R. M. Strongin, Chem. Sci., 2014, 5, 2177 RSC.
- L. Niu, Q. Yang, H. Zheng, Y. Chen, L. Wu, C. Tung and Q. Yang, RSC Adv., 2015, 5, 3959 RSC.
- M. Kasha, Discuss. Faraday Soc., 1950, 9, 14 RSC.
- F. Q. Schafer and G. R. Buettner, Free Radicals Biol. Med., 2001, 30, 1191 CrossRef CAS PubMed.
- O. Rusin, N. N. St Luce, R. A. Agbaria, J. O. Escobedo, S. Jiang, I. M. Warner, F. B. Dawan, K. Lian and R. M. Strongin, J. Am. Chem. Soc., 2004, 126, 438 CrossRef CAS PubMed.
Footnote |
| † Electronic supplementary information (ESI) available: Supplementary figures and methods. See DOI: 10.1039/c6ra28829d |
| This journal is © The Royal Society of Chemistry 2017 |

