 Open Access Article
Creative Commons Attribution 3.0 Unported Licence
Effect of annealing atmosphere on quaternary chalcogenide-based counter electrodes in dye-sensitized solar cell performance: synthesis of Cu2FeSnS4 and Cu2CdSnS4 nanoparticles by thermal decomposition process†
Krishnaiah Mokurala * and
Sudhanshu Mallick*
Department of Metallurgical Engineering & Materials Science, Indian Institute of Technology Bombay, Mumbai-400076, India. E-mail: krishrama33@gmail.com; mallick@iitb.ac.in; Fax: +91 2225726975; Tel: +91 2225767641
First published on 7th March 2017
Abstract
The synthesis of stoichiometrically controlled quaternary chalcogenide nanoparticles through a simple, eco-friendly process is still a great challenge. Herein, earth-abundant quaternary chalcogenide nanoparticles, Cu2FeSnS4 (CFTS) and Cu2CdSnS4 (CCdTS), were synthesized via the thermal decomposition of metal precursors. The prepared CFTS and CCdTS films were used as alternative counter electrodes (CEs) in dye-sensitized solar cells (DSSCs). The effects of the annealing atmosphere on morphology, elemental composition, electrical properties and electrochemical catalytic activity of the CFTS and CCdTS films were investigated. Energy dispersive spectroscopy, Hall measurements, cyclic voltammetry, and electrochemical impedance spectroscopy analysis demonstrate that the sulfurized CFTS and CCdTS-based CEs are more efficient for tri-iodide reduction as compared to the N2-annealed CFTS and CCdTS-based CEs. The photoconversion efficiencies (PCEs) of DSSCs fabricated with sulfurized, annealed in N2 atmosphere CFTS and CCdTS as CEs are found to 7.36 ± 0.00%, 5.78 ± 0.12% and 7.12 ± 0.08%, 5.30 ± 0.00% respectively, while the DSSCs fabricated with conventional Pt-based CEs show an efficiency of 8.15 ± 0.09%. These results indicate that the annealing atmosphere of the CEs has an impact on the DSSCs performance.
1. Introduction
Solar energy is a renewable energy source that can meet the global energy demands in future and can emerge as an alternative to the traditional non-renewable fossil resources.1,2 Dye-sensitized solar cells (DSSCs) are promising alternative photovoltaic devices, owing to their low fabrication cost, reasonable photoconversion efficiency (PCE) and ability to work under low light conditions as compared to other solar cells (thin film solar cells, silicon solar cells).1–4 Recently, considerable efforts have been made in the direction of optimization of DSSCs components (photoanode, electrolyte and counter electrode (CE)), to enhance the performance of the device.2–8 The CE plays an important role in the performance of DSSCs.2,5 The electrochemical catalytic activity of CEs determines the rate of conversion of I3−/I−, which also helps in the regeneration of the dye.2,5 The most commonly used CE in DSSCs is Pt due to its high conductivity and superior electrochemical catalytic activity.2 However, the scarcity of Pt and its high cost restrict the large-scale commercial application of DSSCs.2Numerous materials such as carbon, conducting polymers, alloys, and inorganic materials have been used as a substitute for Pt-CE.2,6–12 Among the inorganic materials, earth-abundant quaternary chalcogenides such as Cu2FeSnS4 (CFTS), Cu2CoSnS4 (CCoTS), Cu2CdSnS4 (CCdTS), Cu2ZnSnSe4 (CZTSe), and Cu2ZnSnS4 (CZTS) have shown similar electrochemical catalytic activity to Pt and have been explored as a CE materials in DSSCs.12–18 Previously, a solvothermally prepared CCdTS based CE for DSSCs demonstrated a PCE of 4%.16 Spray pyrolysis and solvothermally prepared CFTS based CEs for DSSCs have shown efficiencies of 8% and, 7.1% respectively.12,18 However, the effect of the sulfurization on the electrical and electrochemical catalytic activities of CFTS and CCdTS films and its impact on DSSCs performance has not yet been reported.
CCdTS and CFTS nanoparticles have been synthesized by various techniques such as high-temperature solid-state reaction processes,19,20 solvothermal processes,12,16 spray pyrolysis,18,21 RF magnetron sputtering,22 hot injection,17,23,24 etc. However, the synthesis of nanocrystalline, earth-abundant quaternary chalcogenides with precise control over stoichiometry is still a challenge for research groups. Among all the synthesis processes, the thermal decomposition process has been reported as a simple route for the synthesis of quaternary chalcogenides at low temperature in a short time (1 h) to obtain crystalline nanoparticles.14,25
In this study, we report the synthesis of CCdTS and CFTS nanoparticles by the thermal decomposition process, which requires low temperature (300 °C) and short processing time (1 h) to get crystalline nanoparticles. The effects of the annealing atmosphere on the electrical and electrochemical catalytic activities of the prepared films are studied. Sulfurized CFTS and CCdTS films show better electrocatalytic activity as compared to N2 annealed CFTS and CCdTS films. DSSCs fabricated with sulfurized CEs demonstrate a higher PCE as compared to CEs based on films annealed in N2 atmosphere.
2. Experimental details
2.1 Synthesis of quaternary chalcogenide nanomaterials and fabrication of the counter electrodes
The experimental procedure for the synthesis of nanomaterials via the thermal decomposition process has been reported elsewhere.14 The raw materials used in the synthesis of chalcogenide nanomaterials are given in the ESI.† In brief, the stoichiometric ratios of 2![[thin space (1/6-em)]](https://www.rsc.org/images/entities/char_2009.gif) :
:![[thin space (1/6-em)]](https://www.rsc.org/images/entities/char_2009.gif) 1
1![[thin space (1/6-em)]](https://www.rsc.org/images/entities/char_2009.gif) :
:![[thin space (1/6-em)]](https://www.rsc.org/images/entities/char_2009.gif) 1
1![[thin space (1/6-em)]](https://www.rsc.org/images/entities/char_2009.gif) :
:![[thin space (1/6-em)]](https://www.rsc.org/images/entities/char_2009.gif) 4: for Cu
4: for Cu![[thin space (1/6-em)]](https://www.rsc.org/images/entities/char_2009.gif) :
:![[thin space (1/6-em)]](https://www.rsc.org/images/entities/char_2009.gif) Fe
Fe![[thin space (1/6-em)]](https://www.rsc.org/images/entities/char_2009.gif) :
:![[thin space (1/6-em)]](https://www.rsc.org/images/entities/char_2009.gif) Sn
Sn![[thin space (1/6-em)]](https://www.rsc.org/images/entities/char_2009.gif) :
:![[thin space (1/6-em)]](https://www.rsc.org/images/entities/char_2009.gif) S of precursor salts were taken in a polypropylene (PP) bottle along with ethanol and zirconia grinding media. The precursor mix was then transferred to a crucible, which was kept in a tubular furnace. The synthesis was carried out at different temperatures, ranging from 300 °C to 500 °C for 1 h in N2 atmosphere to study the phase formation of CFTS nanoparticles. Cadmium dihydrate was used as a Cd source instead of iron(III) nitrate nonahydrate; the same experimental procedure (as for CFTS) was repeated, for the synthesis of CCdTS nanoparticles. The nanoparticles, prepared at 350 °C for 1 h, were dispersed in organic solvent (hexanethiol) to make stable inks. The prepared stable CFTS/CCdTS inks were coated on soda lime glass (SLG) and fluorine-doped tin oxide (FTO, TEC 8, Pilkington) substrates in a fume hood by using the doctor blade technique for the formation of the films. The prepared films were annealed in N2 atmosphere and sulfurized (sulfurization process was carried out in the presence of sulfur powder (100 mg) in an inert (N2) atmosphere) at 525 °C for 30 min. For convenience, sulfurized CFTS and CCdTS films are denoted as S–CFTS and S–CCdTS, and films annealed in N2 atmosphere are represented as N–CFTS and N–CCdTS.
S of precursor salts were taken in a polypropylene (PP) bottle along with ethanol and zirconia grinding media. The precursor mix was then transferred to a crucible, which was kept in a tubular furnace. The synthesis was carried out at different temperatures, ranging from 300 °C to 500 °C for 1 h in N2 atmosphere to study the phase formation of CFTS nanoparticles. Cadmium dihydrate was used as a Cd source instead of iron(III) nitrate nonahydrate; the same experimental procedure (as for CFTS) was repeated, for the synthesis of CCdTS nanoparticles. The nanoparticles, prepared at 350 °C for 1 h, were dispersed in organic solvent (hexanethiol) to make stable inks. The prepared stable CFTS/CCdTS inks were coated on soda lime glass (SLG) and fluorine-doped tin oxide (FTO, TEC 8, Pilkington) substrates in a fume hood by using the doctor blade technique for the formation of the films. The prepared films were annealed in N2 atmosphere and sulfurized (sulfurization process was carried out in the presence of sulfur powder (100 mg) in an inert (N2) atmosphere) at 525 °C for 30 min. For convenience, sulfurized CFTS and CCdTS films are denoted as S–CFTS and S–CCdTS, and films annealed in N2 atmosphere are represented as N–CFTS and N–CCdTS.
2.2 Assembly of DSSCs
The detailed fabrication steps for the photoanode (TiO2), the electrolyte composition used for DSSCs and their assembly are reported in the ESI.† DSSCs were fabricated using the dye-sensitized TiO2 films as photoanodes and S–CCdTS, S–CFTS, N–CFTS and N–CCdTS based CEs were prepared, respectively. Surlyn spacer (60 μm) was sandwiched between the electrodes, which maintained a constant spacing between them. The electrolyte was injected into the gap between the electrodes. For comparative studies, DSSCs were also fabricated with sputtered Pt-based CEs.2.3 Characterization
The crystallinity of the as-prepared CCdTS and CFTS nanoparticles and annealed films were characterized by using X-ray diffraction (XRD) (PANalytical X-ray diffractometer) and Raman spectroscopy (HORIBA, HR800). The particle sizes and shapes of the synthesized nanoparticles were examined by a field emission gun transmission electron microscope (FEG-TEM, JEM-7210F). The morphologies of fabricated CCdTS and CFTS films were analyzed using a field emission gun-scanning electron microscope (FEG-SEM, JSM-7600F). Elemental analysis of synthesized nanoparticles and annealed films was conducted using energy dispersive spectroscopy (EDS) attached to a FEG-SEM. Electrical properties of the CCdTS and CFTS films coated on soda lime glass (SLG) substrate were estimated by using Hall effect measurements in a magnetic field strength of 0.67 T at room temperature (Lake Shore, Model 8404 AC/DC). Silver paste was applied at the corner of square shaped CCdTS and CFTS films (7 mm × 7 mm) for making electrical contact for Hall measurements. Electrocatalytic activities of prepared films were studied using cyclic voltammetry. Cyclic voltammetry measurements were carried out using a three-electrode system in an iodide/triiodide electrolyte solution at a scan rate of 50 mV s−1 (in the potential range from −1 to 1.8 V). The electrolyte was comprised of 0.1 M LiI, 0.05 M I2, 1 M LiClO4 and acetonitrile. Pt wire was used as the CE, Ag/AgCl was used as the reference electrode and the prepared S–CFTS, S–CCdTS, N–CCdTS and N–CFTS films were used as the working electrodes. Current density–voltage (J–V) characteristics of fabricated DSSCs were recorded using a Keithley 2420 source meter (Keithley Instruments, Inc.) under illumination (90 mW cm2). The incident photon to current efficiency (IPCE) of DSSCs was measured in the wavelength range from 300–800 nm using a xenon lamp (Bentham PVE300). Electrochemical impedance spectroscopy (EIS) of the symmetric cells of the CEs were measured over a frequency range from 1 MHz to 0.1 Hz with an amplitude of 10 mV by using PGSTAT (AUTOLAB 302N). Tafel polarization of the symmetric cell was performed at a scan rate of 50 mV s−1 to verify the electrocatalytic activity of the CE through its exchange current density.3. Results and discussion
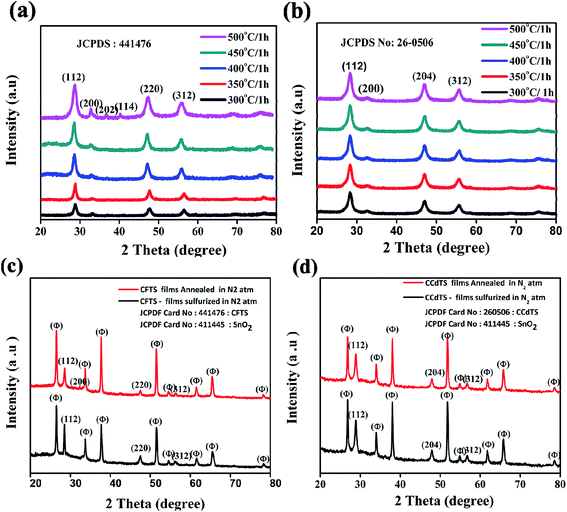
XRD patterns of CFTS and CCdTS nanoparticles synthesized at different temperatures ranging from 300 °C to 500 °C for 1 h are shown in Fig. 1a and b. All the diffraction peaks in Fig. 1a and b are in good agreement with their standard crystal structure patterns for CFTS (JCPDS no. 44-1476) and CCdTS for (JCPDS no. 26-0506), respectively. The average crystallite sizes of CFTS and CCdTS nanoparticles prepared at different temperatures for 1 h were calculated by using the Scherrer formula.The obtained crystallite sizes of the synthesized nanoparticles are summarized in Table S1 in ESI.† The crystallite size of CCdTS nanoparticles increased from 6 nm to 23 nm with the increase in the temperature from 300 °C to 500 °C. Similarly, the increase in the crystallite size of CFTS nanoparticles was observed with the increase in the temperature. The XRD patterns of prepared films show additional peaks (θ) along with main phases, which are attributed to the FTO substrate (SnO2: JCPDS no. 411445, Fig. 1c and d). However, XRD characterization is insufficient to distinguish the crystal structure of CCdTS and CFTS from their secondary phases (Cu2SnS3, CdS, and FeS), due to their similar XRD patterns. Raman spectroscopy measurements were performed to further confirm the single phase formation of the as-prepared nanoparticles and annealed films.
Raman spectra of the prepared nanoparticles (300 °C for 1 h) and annealed films are shown in Fig. 2. The peak at 317 cm−1 belongs to the CFTS crystal structure (Fig. 2a) and the peaks at 329 cm−1 and 281 cm−1 correspond to the CCdTS phase (Fig. 2b). The peaks at 317 cm−1 and 329 cm−1 are attributed to the symmetric vibrational motion of the sulfur atoms in CFTS and CCdTS, respectively.16,19,20,23,26 The peak at 281 cm−1 is ascribed to the vibrations of the Cd atoms and S atoms with some contribution from the Cu atoms in the CCdTS lattice.19,20,26 The absence of peaks at 293 cm−1 (FeS), 318 cm−1 (Cu2SnS3) and 305 cm−1 (CdS) shows the formation of single phase CCdTS and CFTS synthesized nanoparticles and their respective annealed films.19,20,23,26,27 The obtained values are in good agreement with the literature reported values.19,20,26
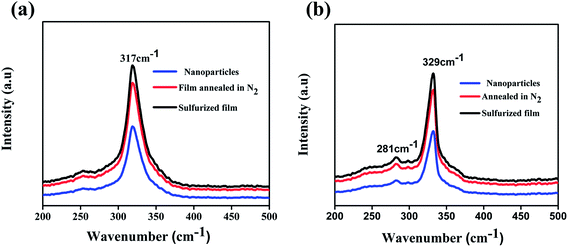 | ||
| Fig. 2 Raman spectra of (a) CFTS, (b) CCdTS nanoparticles synthesized at 300 °C for 1 h and films annealed at 525 °C for 30 min respectively. | ||
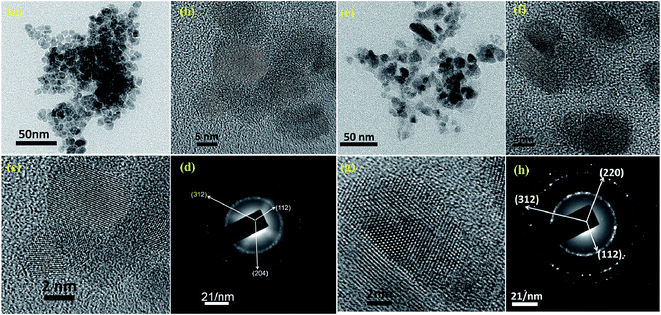
Bright field FEG-TEM images of CCdTS and CFTS nanoparticles synthesized at 300 °C for 1 h are shown in Fig. 3. Synthesized CCdTS nanoparticles are spherical in shape and have a size of approximately 6–9 nm (Fig. 3a and b). The synthesized CFTS nanoparticles are equiaxed, with sizes of approximately 8–12 nm (Fig. 3e and f). The morphologies of CFTS and CCdTS nanoparticles prepared by thermal decomposition are similar to the nanoparticles synthesized by using wet chemical processes.12,16,17,23,24 HR-TEM images of CCdTS and CFTS nanoparticles show the clear lattice planes, which indicate the crystallinity of synthesized nanoparticles (Fig. 3c and g, respectively). The selected area electron diffraction (SAED) confirms the polycrystalline nature of synthesized CCdTS and CFTS nanoparticles (Fig. 3d and h). Diffraction rings are indexed to the (112), (204) and (312) planes, which correspond to the stannite CCdTS crystal structure (Fig. 3d). Similarly, (112), (220) and (312) planes (Fig. 3h) are matched to the stannite CFTS crystal structure. The XRD, Raman, and FEG-TEM analysis confirm the crystallinity of CCdTS and CFTS nanoparticles prepared at 300 °C for 1 h.
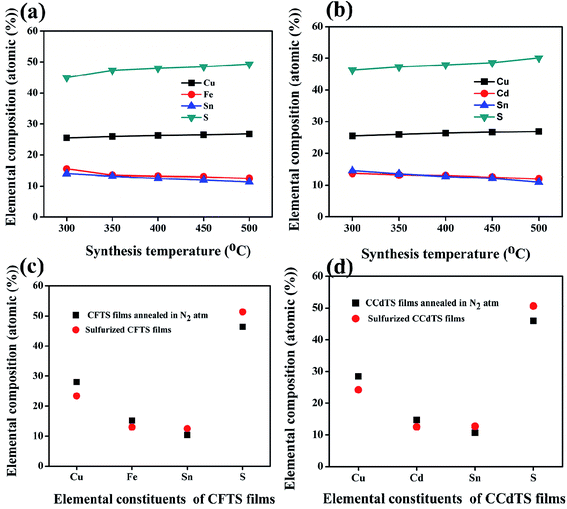
The average elemental compositions (atomic weight%) of synthesized CFTS and CCdTS nanoparticles and films annealed in different atmospheres were measured by using EDS. The obtained results are shown in Fig. 4 (also see the raw data in Tables S2–S5†). Fe-rich, Sn-rich, and S-deficient CFTS nanoparticles were obtained via low-temperature synthesis, while Cd-rich, Sn-rich, and S-deficient CCdTS nanoparticles were obtained (Fig. 4a and b). Excess Cu, Sn-deficiency and the appropriate ratio of Fe and S were noticed for CFTS nanoparticles, while Cu-rich, Sn-deficiency, and the desired ratio of Cd and S were obtained for CCdTS nanoparticles synthesized at high temperature. Similarly, Cu-rich, and Sn and S-deficiencies were observed in both films (N–CCdTS and N–CFTS) annealed in the N2 atmosphere, while the desired stoichiometric ratio was observed for sulfurized films (Fig. 4c and d). The deficiencies of Sn and S in both films (N–CCdTS, N–CFTS) annealed in N2 atmosphere are due to the evaporation of Sn and S from the film at high temperature.28,29
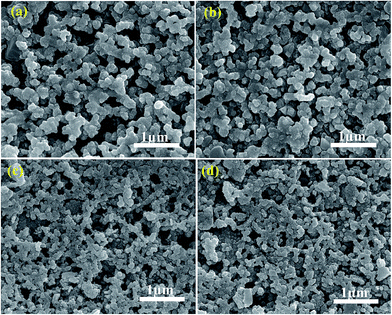
Surface features of films annealed in N2 atmosphere and sulfurized film are shown in Fig. 5. The larger grain sizes are observed in N–CCdTS and N–CFTS films (Fig. 5a and b), compared to the S–CCdTS, S–CFTS films (Fig. 5c and d). The larger grain sizes in films annealed under nitrogen might be due to the Cu-rich phase, which is consistent with a previous report.30
The electrical properties of all CCdTS and CFTS films were evaluated by using Hall measurements and are given in Table 1. Hall measurements confirm the P-type conductivity of CFTS and CCdTS films. The resistivities of sulfurized CFTS and CCdTS films are smaller than those of the films annealed in N2 atmosphere. The mobility of sulfurized films is higher than that of the films annealed in N2 atm. The higher resistivity, the lower mobility of CCdTS film is due to changes in morphology and deviation in the stoichiometric ratio of CFTS films.12,31 The deficiency of S and Sn creates elementary defects (sulfur vacancy (VS) and tin vacancy (VSn)) in the prepared films, which can trap electrons, thus increasing the resistivity of the films.31,32 The obtained electrical properties of CCdTS and CFTS films are similar to the reported values.12,18,33
| Parameters | N–CFTS | N–CCdTS | S–CFTS | S–CCdTS |
|---|---|---|---|---|
| Type of conductivity | P | P | P | P |
| Mobility (cm2 V−1 s−1) | 1.7 | 1.2 | 4.5 | 3.2 |
| Carrier concentration (cm−3) | 3 × 10¹⁷ | 2.5 × 10¹⁷ | 3.3 × 10¹⁷ | 2.7 × 10¹⁷ |
| Resistivity (Ω cm) | 0.56 | 0.98 | 2 × 10⁻² | 7 × 10⁻² |
It is essential to evaluate the electrochemical catalytic activity of synthesized materials for their substitution as alternative electrocatalyst materials for CEs in DSSCs. Cyclic voltammetry measurements of prepared films show two pairs of redox peaks (Fig. 6a), which indicate that synthesized materials can act as electrocatalysts for the reduction of I3− to I−. The redox pair at a lower potential is ascribed to the reaction of I3−/I−, which is responsible for the regeneration of the dye in DSSCs.12 However, the redox pair at higher potential corresponds to the reaction of I2/I3− (Fig. 6a). The electrochemical catalytic parameters such as cathodic current density (Ipc1) and peak-to-peak separation (Epp) of the redox pair at lower potentials are the key parameters for determining the electrocatalytic activity of prepared CEs.12,18 The electrochemical catalytic parameters (Ipc1, Epp) of different CEs obtained from the cyclic voltammogram (CV) curves are given in Table 2 (Fig. 6a). From the CV analysis, the higher Ipc1 values and lower Epp values of S–CFCTS-CE and S–CFTS-CE indicate a better electrocatalytic activity for the reduction of I3− ions in the electrolyte solution, compared to N–CFTS-CE and N–CCdTS-CE, but inferior activity to that of Pt-CE. According to the literature, the elemental compositions,12,31,34 morphologies,35,36 electrical conductivities,12,37–39 crystal structures,40 secondary phases,41 and specific surface areas12,42–44 of CE materials affect the electrochemical catalytic parameters. The higher electrocatalytic activity of S–CFTS-CEs and S–CCdTS-CEs as compared to N–CFTS-CE and N–CCdTS-CE might be due to the variation in elemental composition (Fig. 4c and d), morphology (Fig. 5) and electrical conductivity (Table 1).
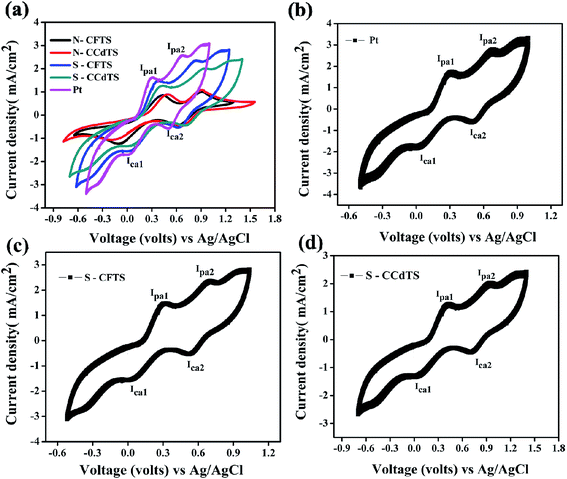 | ||
| Fig. 6 Cyclic voltammogram curves of (a) different CEs (Pt, N–CCdTS, N–CFTS, S–CCdTS, and S–CFTS) (b) 100 cycles for Pt-CE, (c) 100 cycles for S–CCdTS-CE and (d) 100 cycles for S–CFTS-CE. | ||
| CEs | Ica1 (mA cm−2) | Ipa1 (mA cm−2) | Epp (meV) | D × 10−6 (cm2 s−1) | k0 × 10−4 (cm s−1) | Ψ × 10−9 (mol cm−3) |
|---|---|---|---|---|---|---|
| Pt | 1.68 | 1.61 | 280 | 6.2 | 6.0 | 2.06 |
| S–CFTS | 1.52 | 1.47 | 328 | 5.2 | 5.5 | 1.85 |
| S–CCdTS | 1.30 | 1.27 | 367 | 3.8 | 4.7 | 1.58 |
| N–CFTS | 1.25 | 0.85 | 527 | 3.2 | 4.2 | 1.50 |
| N–CCdTS | 1.09 | 0.90 | 638 | 2.4 | 3.7 | 1.24 |
Stability assessment of CEs is an important issue for practical application of the DSSCs.45 According to the reported literature, successive CV scanning, EIS scanning, long-term stability, dark and illuminated current–voltage testing and the removal rate of the films (mechanical stability) are used to examine the preliminary stability of various CEs.45–50 Herein, mechanical stability (adhesion of CEs to substrates (FTO)), chemical stability (inert)/dissolution studies and successive CV scanning of CEs are reported for stability assessment of CEs. Adhesion between CE/FTO interfaces influence the performance of DSSCs and the device lifetime.45 The adhesion test was performed by using an ultrasonicator. The S–CCdTS-CE and S–CFTS-CE were immersed in ethanol and subjected to ultrasonication for 1 h. These CEs were periodically observed after 15 min. As observed from Fig. S1 and S2 (see, ESI†), no major changes were noticed in both the CEs after 1 h. This indicates that the CEs are mechanically stable (well adherent to the FTO substrate). S–CFTS-CE and S–CCdTS-CE were immersed in iodine based electrolyte for 14 days to study the dissolution of prepared CEs (Fig. S3†). These CEs were periodically observed after 7 days. The CEs did not dissolve in electrolyte, even after 14 days, indicating that these CEs are stable (inert) in iodine-based electrolyte (Fig. S4 and S5†). Cyclic voltammetry was carried out for 100 consecutive cycles at 50 mV s−1 scan rate to confirm the stability of S–CCdTS-CE and S–CFTS-CE in the iodide based (I3−/I−) electrolyte system. The CV curves of S–CCdTS and S–CFTS-CEs (after 100 cycles) were found to be analogous to that of Pt-CE (Fig. 6b–d). The unchanged shape of the CV curves and nearly constant current density demonstrate the electrochemical stability of the S–CCdTS-CE and S–CFTS-CE in the iodide based electrolyte. The adhesion test, dissolution studies and successive CV scanning of CEs indicate that prepared CEs are quite stable in iodide based electrolyte. However, the aging study of DSSCs fabricated with these CEs (S–CFTS-CE and S–CCdTS-CE) and symmetric cells of CEs under illumination conditions (60 °C, 1 sun) is important for practical application.45 The aging studies of DSSCs with these CEs are in progress.
To further support the electrocatalytic activity of prepared CEs, the adsorption quantity (Ψ) and diffusion coefficient (DI3−) of I3− ions in the electrolyte, and electrochemical rate constant (k0) of I3−/I− reaction were calculated for the prepared CEs. The Ψ, DI3− and k0 values of I3− ions for different CEs were estimated using the following equations,12,37,39,51 and the obtained results are listed in Table 2.
| Ipc1 = [(nF)2vΨ]/RT | (1) |
| Ipc1 = Kn3/2A(DI3−)1/2v1/2C | (2) |
| θ = 0.299 × v1/2 | (3) |
| k0 = θ((ΠDnvF)/RT)1/2 | (4) |
The estimated Ψ value of I3− ions for S–CFTS-CE, S–CCdTS-CE was found to be larger than that of N–CFTS-CE, N–CCdTS-CE, but smaller than Pt-CEs. The higher Ψ value for S–CFTS-CE and S–CCdTS-CE shows that larger numbers of I3− ions are adsorbed on the S–CFTS and S–CCdTS surfaces as compared to N–CFTS-CE and N–CCdTS-CE surfaces. The estimated Ψ values of different CE materials show a similar order of magnitude to other materials.12 The calculated diffusion coefficients (DI3−) of I3− ions in the electrolyte for S–CFTS-CE, S–CCdTS-CE are higher than N–CFTS-CE, N–CCdTS-CE, which is ascribed to the slower diffusion of I3− ions towards the CEs surface.12,36–38 The variation in the DI3− of I3− ions for different CEs is due to the change in electrical conductivity of the CEs.12,36–38 The estimated k0 values of S–CFTS-CE and S–CCdTS-CE are greater than that of N–CFTS-CE and N–CCdTS-CE. The larger k0 value of sulfurized CEs indicates the faster rate of reduction of I3− to I− ions at the CE/electrolyte interface.19 According to the existing literature, the k0 value is inversely proportional to the Epp value, and calculated k0 values are in good accordance with Epp values of different CEs obtained from CV curves (Fig. 6). The larger Ψ, DI3−, and k0 values for S–CFTS-CE and S–CCdTS-CE further confirm the more efficient reduction of I3− to I−, compared to N–CFTS-CE and N–CCdTS-CE.
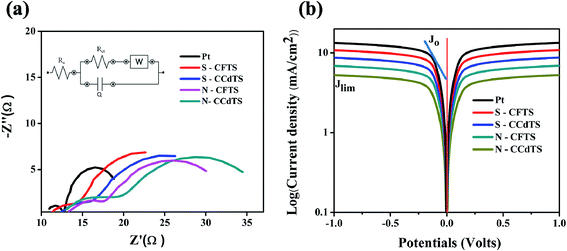
Electrocatalytic activity of CEs was further confirmed by EIS and Tafel polarization measurements. EIS and Tafel polarization measurements of symmetric cells of CEs were performed under illumination at zero bias voltage and the obtained spectra are shown in Fig. 7. The equivalent circuits of the EIS spectra were fitted with the Zsimp software (inset Fig. 7a). Electrochemical parameters such as exchange current density (J0) (obtained from Tafel polarization, Fig. 7b), series resistance (Rs), charge-transfer resistance (Rct) and the corresponding constant phase angle (CPE) at the electrolyte/CEs interface estimated from the EIS spectra are given in Table 3. The Rct value of different CEs calculated from the EIS spectra and Tafel polarization curves are in good agreement (more details regarding the calculation of Rct and J0 value from Tafel polarization curves are given in ESI†). According to the previous literature, J0 and Rct values are correlated with the electrocatalytic activity of CEs, and J0 is inversely proportional to Rct.12 The Rct value of S–CFTS-CE (2.9 Ω cm2) and S–CCdTS-CE (3.8 Ω cm2) are found to be smaller than those of N–CFTS-CE (5.0 Ω cm2), and N–CCdTS-CE (6.9 Ω cm2), respectively. The obtained Rct, and J0 values indicate that sulfurized CEs are more efficient for the reduction of I3− to I− at the electrolyte–CE interface, as compared to the N2 annealed CEs; however, it is less efficient in comparison to Pt CEs. The variation in Rs value for different CEs might be due to the change in their electrical resistivity and adhesion of the films to the FTO substrate.12,36–38 From the CV, EIS and Tafel analysis indicate that sulfurized CEs possess better electrochemical activity, compared to the N2 annealed CEs.
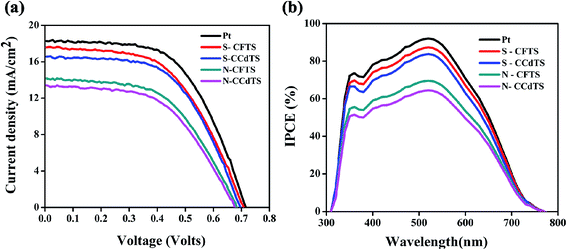
Current density–voltage (J–V) characteristics of DSSCs assembled with all CCdTS, CFTS, and Pt-based CEs are shown in Fig. 8a. Average (five cells) solar cell parameters such as short-circuit current density (Jsc), open circuit voltage (Voc), fill factor (FF), and efficiency (η) estimated from the J–V characteristics are given in Table 4. The DSSC fabricated with S–CFTS-CE, S–CCdTS-CE showed higher Jsc, and Voc, as compared to N–CFTS-CE, N–CCdTS-CE, but lower than that of Pt-based CE.
| CEs | Jsc (mA cm−2) | Voc (mV) | FF | η (%) |
|---|---|---|---|---|
| Pt | 18.27 ± 0.31 | 713.6 ± 1.28 | 0.60 ± 0.00 | 8.15 ± 0.09 |
| S–CFTS | 17.37 ± 0.32 | 705.2 ± 0.96 | 0.57 ± 0.00 | 7.36 ± 0.00 |
| S–CCdTS | 16.38 ± 0.25 | 695.6 ± 1.44 | 0.56 ± 0.00 | 7.12 ± 0.08 |
| N–CFTS | 14.59 ± 0.37 | 684.6 ± 1.68 | 0.54 ± 0.00 | 5.78 ± 0.12 |
| N–CCdTS | 13.29 ± 0.27 | 675.0 ± 2.08 | 0.53 ± 0.00 | 5.30 ± 0.00 |
The lower Jsc of N–CFTS-CE, N–CCdTS-CE could be ascribed to higher resistivity and lower electrochemical catalytic activity.12,31 The open circuit voltages of DSSCs fabricated from S–CFTS-CE and S–CCdTS-CE are higher than that from N–CFTS-CE and N–CCdTS-CE. The variation in Voc of DSSCs fabricated with different CEs is explained with the help of the following equation:17,52
| Voc = (kBT/e) × ln(Iinj/[ncbketC]) | (5) |
The change in Voc of different CEs might be due to the presence of a high concentration of I3− ions in the electrolyte, which is ascribed to the slower rate of conversion of I3−/I− at the CE surface–electrolyte interface.8 The calculated Jsc, Voc of DSSCs fabricated with different CEs are in accordance with the electrical conductivity and electrochemical parameters of different CEs estimated from CV analysis. DSSCs fabricated with S–CFTS-CE, S–CCdTS-CE, and N–CFTS-CE, N–CCdTS-CE demonstrated an efficiency of 7.36 ± 0.00%, 7.12 ± 0.08% and 5.78 ± 0.12%, 5.30 ± 0.00%, respectively, while the one fabricated with Pt-CE exhibited an efficiency of 8.15 ± 0.09%. The lower fill factor of DSSCs with N–CCdTS-CE and N–CFTS-CE is due to a higher Rs value (Table 3). The measured IPCE spectra of DSSCs fabricated with prepared CEs are shown in Fig. 8b. IPCE response at 350 nm is ascribed to the direct band gap photoelectron excitation of TiO2.12 The IPCE of DSSCs with S–CFTS-CE, S–CCdTS-CE, N–CFTS-CE, N–CCdTS-CE are observed to be about 87.3%, 83.5%, 69.8%, 63.8% at 520 nm, respectively, while IPCE of DSSCs with Pt-CE is found to be 92.8% at 520 nm. The IPCE spectra results are in good agreement with the Jsc value of DSSCs fabricated with prepared CEs.
4. Conclusions
Quaternary chalcogenides (Cu2FeSnS4 (CFTS) and Cu2CdSnS4 (CCdTS) nanoparticles) have been synthesized by the thermal decomposition of metal precursors at different temperatures (300 °C to 500 °C) for 1 h. XRD, Raman spectroscopy, and FEG-TEM analysis revealed that heat treatment at 300 °C for 1 h is enough to form single phase CFTS and CCdTS nanoparticles. Sn and S-deficiencies in N–CCdTS and N–CFTS films led to higher resistivity as compared to S–CFTS and S–CCdTS films. Electrical conductivity and electrochemical parameters together demonstrated that S–CFTS-CE and S–CCdTS-CE are more efficient for the rate of conversion of I3− to I−, as compared to N–CFTS-CE and N–CCdTS-CE. The DSSCs fabricated with S–CFTS-CE and S–CCdTS-CE achieved 90% and 87% of the photoconversion efficiency of DSSCs with conventional Pt CE, respectively. The obtained results indicate that the annealing atmosphere plays a vital role in the performance of DSSCs.Acknowledgements
Authors would like to thanks to Prof. Parag Bhargava for his assistance regarding the stability of counter electrodes. Authors also extended thanks to SERIIUS and IITB for financial support and SAIF, CEN for analytical analysis supporting the present work.References
- M. Ye, X. Wen, M. Wang, J. Iocozzia, N. Zhang, C. Lin and Z. Lin, Mater. Today, 2015, 18, 155–162 CrossRef CAS.
- L. Wang, M. A. Mamun, P. Liu, Y. Wang, H. G. Yang, H. F. Wang and H. Zhao, NPG Asia Mater., 2015, 7, 1–15 Search PubMed.
- S. Mathew, A. Yella, P. Gao, R. H. Baker, B. F. E. Curchod, N. A. Astani, I. Tavernelli, U. Rothlisberger, M. K. Nazeeruddin and M. Gratzel, Nat. Chem., 2014, 6, 242–247 CrossRef CAS PubMed.
- A. Fakharuddin, R. Jose, T. M. Brown, F. Fabregat-Santiago and J. Bisquert, Energy Environ. Sci., 2014, 7, 3952–3981 CAS.
- X. Liu, J. Fang, Y. Liu and T. Lin, Front. Mater. Sci., 2016, 10(3), 225–237 CrossRef.
- J. Theerthagiri, A. R. Senthil, J. Madhavan and T. Maiyalagan, ChemElectroChem, 2015, 2, 928–945 CrossRef CAS.
- Q. Tang, J. Duan, Y. Duan, B. He and L. Yu, Electrochim. Acta, 2015, 178, 886–899 CrossRef CAS.
- M. Kouhnavard, N. A. Ludin, B. V. Ghaffari, K. Sopian and S. Ikeda, ChemSusChem, 2015, 8, 1510–1533 CrossRef CAS PubMed.
- C. R. Ke, C. C. Chang and J. M. Ting, J. Power Sources, 2015, 284, 489–496 CrossRef CAS.
- J. Liu, Q. Tang, B. He and L. Yu, J. Power Sources, 2015, 282, 79–86 CrossRef CAS.
- S. Yun, A. Hagfeldt and T. Ma, Adv. Mater., 2014, 26, 6210–6237 CrossRef CAS PubMed.
- K. Mokurala, S. Mallick and P. Bhargava, J. Power Sources, 2016, 305, 134–143 CrossRef CAS.
- S. J. Yuan, Z. J. Zhou, Z. L. Hou, W. H. Zhou, R. Y. Yao, Y. Zhao and S. X. Wu, Chem.–Eur. J., 2013, 9, 10107–10110 CrossRef PubMed.
- K. Mokurala, A. Kamble, A. Gupta, P. Bhargava and S. Mallick, Adv. Sci. Lett., 2016, 22, 1026–1028 CrossRef.
- K. Mokurala, A. Kamble, C. Bathina, P. Bhargava and S. Mallick, Mater. Today, 2016, 3, 1778–1784 CrossRef.
- K. Mokurala, P. Bhargava and S. Mallick, IEEE 40th photovoltaic specialist conference (PVSC), 2014, vol. 1, pp. 1534–1537 Search PubMed.
- J. Y. Park, J. H. Noh, T. N. Mandal, S. H. Im, Y. Jun and S. Seok, RSC Adv., 2013, 3, 24918–24921 RSC.
- R. R. Prabhakar, N. H. Loc, M. H. Kumar, P. P. Boix, S. Juan, R. A. John, S. K. Batabyal and L. H. Wong, ACS Appl. Mater. Interfaces, 2014, 6, 17661–17667 CAS.
- C. Rincón, M. Quintero, E. Moreno, Ch. Power, E. Quintero, J. A. Henao, M. A. Macías, G. E. Delgado, R. Tovar and M. Morocoima, Solid State Commun., 2011, 151, 947–951 CrossRef.
- K. Timmo, M. K. Kuusik, M. Altosaar, J. Raudoja, T. Raadik, M. Grossberg, T. Varema, M. Pilvet, I. Leinemann, O. Volobujeva and M. Eellikov, 28th European photovoltaic solar energy conference and Exhibition (EU PVSEC 2013), 2013, pp. 2385 – 2388 Search PubMed.
- L. Nie, S. Liu, Y. Chai and R. Yuan, J. Anal. Appl. Pyrolysis, 2015, 112, 363–368 CrossRef CAS.
- X. Meng, H. Deng, J. Tao, H. Cao, X. Li, L. Sun, P. Yang and J. Chu, J. Alloys Compd., 2016, 680, 446–451 CrossRef CAS.
- B. Zhou, X. Yan, P. Li, L. Yang and D. Yu, Eur. J. Inorg. Chem., 2015, 1, 2690–2694 CrossRef.
- K. Ramasamy, X. Zhang, R. D. Bennett and A. Gupta, RSC Adv., 2013, 3, 1186–1193 RSC.
- K. Mokurala, P. Bhargava and S. Mallick, RSC Adv., 2015, 5, 96928–96933 RSC.
- M. Himmrich and H. Haeuseler, Spectrochim. Acta, Part A, 1991, 47, 933–942 CrossRef.
- K. K. Nanda, S. N. Sarangi, S. N. Sahu, S. K. Deb and S. N. Behera, Phys. B, 1999, 262, 31–39 CrossRef CAS.
- A. Redinger, D. M. Berg, P. J. Dale and S. Siebentritt, J. Am. Chem. Soc., 2011, 133, 3320–3323 CrossRef CAS PubMed.
- A. Weber, R. Mainz and H. W. Schock, J. Appl. Phys., 2010, 107, 013516 CrossRef.
- T. Tanaka, A. Yoshida, D. Saiki, K. Saito, Q. Guo, M. Nishio and T. Yamaguchi, Thin Solid Films, 2010, 518, S29–S33 CrossRef CAS.
- M. S. Fan, J. H. Chen, C. T. Li, K. W. Cheng and K. C. Ho, J. Mater. Chem. A, 2015, 3, 562–569 CAS.
- M. Kumar, A. Dubey, N. Adhikari, S. Venkatesan and Q. Qiao, Energy Environ. Sci., 2015, 8, 3134–3159 CAS.
- K. Tto and T. NakaJawa, Jpn. J. Appl. Phys., 1988, 27, 2094–2097 CrossRef.
- S. K. Swami, N. Chaturvedi, A. Kumar, N. Chander, V. Dutta, D. K. Kumar, A. Ivaturi, S. Senthilarasu and H. M. Upadhyay, Phys. Chem. Chem. Phys., 2014, 16, 23993–23999 RSC.
- Z. Tang, J. Wu, M. Zheng, J. Huo and Z. Lan, Nano Energy, 2013, 2, 622–627 CrossRef CAS.
- H. Yuan, Q. Jiao, S. Zhang, Y. Zhao, Q. Wu and H. Li, J. Power Sources, 2016, 325, 417–426 CrossRef CAS.
- W. Hou, Y. Xiao, G. Han, D. Fu and R. Wu, J. Power Sources, 2016, 322, 155–162 CrossRef CAS.
- J. Song, G. R. Li, C. Y. Wu and X. P. Gao, J. Power Sources, 2014, 266, 464–470 CrossRef CAS.
- B. He, Q. Tang, M. Wang, C. Ma and S. Yuan, J. Power Sources, 2014, 256, 8–13 CrossRef CAS.
- X. Lin, M. Wu, Y. Wang, A. Hagfeldt and T. Ma, Chem. Commun., 2011, 47, 11489–11491 RSC.
- R. K. Bhosale, S. A. Agarkar, I. Agrawal, R. A. Naphade and S. Ogale, RSC Adv., 2014, 4, 21989–21996 RSC.
- M. Wu, X. Lin, Y. Wang, L. Wang, W. Guo, D. Qi, X. Peng, A. Hagfeldt, M. Gratzel and T. Ma, J. Am. Chem. Soc., 2012, 134, 3419–3428 CrossRef CAS PubMed.
- Y. Xie, C. Zhang, F. Yue, Y. Zhang, Y. Shi and T. Ma, RSC Adv., 2013, 3, 23264–23268 RSC.
- J. Wu, Z. Tang, Y. Huang, M. Huang, H. Yu and J. Lin, J. Power Sources, 2014, 257, 84–89 CrossRef CAS.
- S. Yun, P. D. Lund and A. Hinsch, Energy Environ. Sci., 2015, 8, 3495–3514 CAS.
- F. Gong, H. Wang, X. Xu, G. Zhou and Z. S. Wang, J. Am. Chem. Soc., 2012, 134, 10953–10958 CrossRef CAS PubMed.
- S. Yun, M. Wu, Y. Wang, J. Shi, X. Lin, A. Hagfeldt and T. Ma, ChemSusChem, 2013, 6, 411–416 CrossRef CAS PubMed.
- S. Yun, H. Pu, J. Chen, A. Hagfeldt and T. Ma, ChemSusChem, 2014, 7, 442–450 CrossRef CAS PubMed.
- S. Yun, H. Zhang, H. Pu, J. Chen, A. Hagfeldt and T. Ma, Adv. Energy Mater., 2013, 3, 1407 CrossRef CAS.
- L. Kavan, J. H. Yum and M. Gratzel, ACS Nano, 2011, 5, 165–172 CrossRef CAS PubMed.
- J. E. Park, S. Song and I. S. Shin, Int. J. Electrochem. Sci., 2016, 11, 5891–5899 CrossRef CAS.
- J. Xu, M. Li, L. Wu, Y. Sun, L. Zhu, S. Gu, L. Liu, Z. Bai, D. Fang and W. Xu, J. Power Sources, 2014, 257, 230–236 CrossRef CAS.
Footnote |
| † Electronic supplementary information (ESI) available. See DOI: 10.1039/c6ra28889h |
| This journal is © The Royal Society of Chemistry 2017 |

