
 Open Access Article
 This Open Access Article is licensed under a Creative Commons Attribution-Non Commercial 3.0 Unported Licence
Three-dimensional TiO2 nanotube arrays combined with g-C3N4 quantum dots for visible light-driven photocatalytic hydrogen production
Qi Zhanga,
Hua Wang *a,
Shuo Chen*b,
Yan Sub and
Xie Quanb
*a,
Shuo Chen*b,
Yan Sub and
Xie Quanb
aSchool of Fisheries and Life Science, Dalian Ocean University, Dalian 116023, China. E-mail: wanghua@dlou.edu.cn
bFaculty of Chemical, Environmental and Biological Science and Technology, Dalian University of Technology, Dalian 116024, China. E-mail: shuochen@dlut.edu.cn
First published on 27th February 2017
Abstract
A three-dimensional (3D) nanostructured photocatalyst combined with g-C3N4 quantum dots (QDs) and a TiO2 nanotube array (TNA) was fabricated to form a 3D g-C3N4/TNA nanocomposite by a facile electro-deposition process. The photocatalytic ability of the 3D g-C3N4/TNA was evaluated by measuring the amount of hydrogen generated from water splitting under visible light irradiation. Benefiting from an attractive heterostructure between g-C3N4 and TiO2 leading to a unique photogenerated charge separation, as well as a distinctive 3D well-ordered nanotube structure, this 3D g-C3N4/TNA exhibited an average H2 production of approximately 243 μmol h−1 g−1, which was approximately 4.7 times higher than that of sole g-C3N4 under the same experimental conditions. Therefore, this work could offer a prospective 3D nanostructure for visible light-driven photocatalytic applications.
1 Introduction
Hydrogen is one of the most promising fuels for the future.1 Most hydrogen is produced from the steam reforming of natural gas, which requires an intense thermal energy input. Since Fujishima and Honda discovered the photocatalytic production of hydrogen from water on TiO2 electrodes, the efficient photoconversion of water to hydrogen has been a long-term goal in the areas of energy science and engineering.2 In general, the capability of a photocatalyst depends heavily on its structure because the structure can influence the three major steps of photocatalysis: photon absorption, charge carrier transfer, and catalytic surface reactions.3 Currently, photocatalysts with three-dimensional (3D) structures have been proposed, and the use of a 3D structure demonstrated a promising photocatalytic performance because of the interconnected open-framework, high specific surface area and more active sites for photocatalytic reactions.4–7In this regard, TiO2 nanotube arrays (TNA) have a typical 3D framework with a high mechanical strength. Meanwhile, the excellent electron transport ability was observed for the 3D TNA because of the minimized grain boundaries.8 However, since TiO2 could only be used under UV light irradiation due to its wide band gap, one of possible approaches has been made to combine narrow band gap photocatalyst with TiO2 to induce the absorption into the visible light region.9 Recently, graphitic carbon nitride (g-C3N4), an metal-free photocatalyst, has attracted increasing attention because of its narrow band gap.10 In particular, the g-C3N4 quantum dots (QDs) have a shorter transferring distance of photoinduced charge carriers and strong quantum confinement.11 Most recently, Li and co-workers reported that size-controllable g-C3N4 QDs modified single-crystalline TNA could exhibit high activity in synergetic H2 evolution and organic pollutant degradation.12 Su and co-workers also reported that modification of TNA by the ultrasmall g-C3N4 QDs could improve the photoelectrochemical activity significantly.13 However, until now, the TNA combined with g-C3N4 QDs has a Ti substrate, which restricted its photocatalytic application. Here, the 3D TNA without the Ti substrate was prepared by an electrochemical anodization, and then modified with g-C3N4 QDs to fabricate a 3D g-C3N4/TNA by a facile electro-deposition. The performance of this 3D g-C3N4/TNA photocatalyst was investigated for visible light-driven hydrogen production from water.
2 Experimental
2.1 Preparation of 3D g-C3N4/TNA
The method for preparation of g-C3N4 QDs based on a previous report.11 Meanwhile, 3D TNA with Ti substrate was fabricated by potentiostatic anodization as Liu's report.14 Then electro-deposition of g-C3N4 QDs on the 3D TNA was performed using an electrophores apparatus (DYY-6C) where the TNA and Pt plate were connected with the negative pole and positive pole, respectively. The electrolyte solution consisted of isopropyl alcohol (100 mL), magnesium nitrate (5 mg), and g-C3N4 QDs (0.14 g L−1, 10 mL), and the electro-deposition was maintained at 20 V for 3 h. Subsequently, the sample annealed at 500 °C for 2 h. Finally, the annealed sample was anodized again in the same stock electrolyte at 60 V for 4 h to remove Ti substrate. The obtained free-standing 3D g-C3N4/TNA was cleaned in ethanol. Fig. 1 shows a schematic of the 3D g-C3N4/TNA preparation.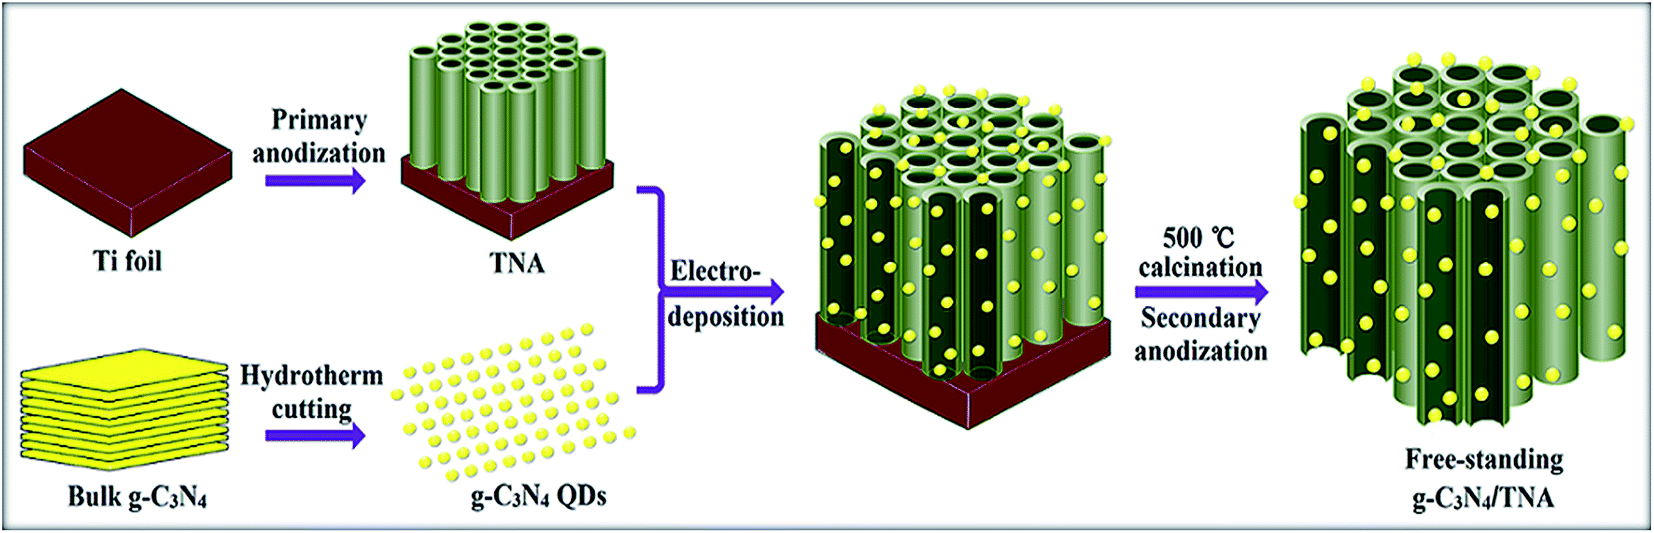 | ||
| Fig. 1 Schematic of the 3D g-C3N4/TNA preparation. | ||
2.2 Characterization
The morphology of the 3D g-C3N4/TNA was analyzed using scanning electron microscopy (SEM, Quanta 200 FEG) and transmission electron microscopy (TEM, JEM-2100F, JEOL, Japan). The chemical composition was determined using energy dispersive X-ray (EDX) spectroscopy, which was combined with SEM. The crystallinity of the samples was determined by X-ray diffraction (XRD) using a diffractometer with Cu Kα radiation (Shimadzu LabX XRD-6000). X-ray photoelectron spectroscopy (XPS, ESCALAB250, Thermo-VG Scientific) was used to analyze the elementary composition of the samples. The UV-vis absorption spectra of the samples were investigated as a function of the incident wavelength using UV-vis diffuse reflectance spectroscopy (DRS, Shimadzu UV-2450 spectrophotometer). The Brunauer–Emmett–Teller (BET) surface area was analyzed using an automated surface area and pore size analyzer (Quantachrome Autosorb-1 MP).2.3 Photocatalytic hydrogen production
The photocatalytic production of hydrogen was performed in a glass closed-gas circulation and evacuation system. A 300 W Xe lamp with an ultraviolet filter (λ ≥ 400 nm) was used as the light source and was positioned 10 cm from the cylindrical quartz photoreactor (300 mL). The light source provided an incident light with an intensity of 100 mW cm−2, which was measured by a radiometer (model FZ-A, Photoelectric Instrument Factory Beijing Normal University, China). Photocatalytic hydrogen production was carried out in the water/methanol mixture (v/v, 9/1), where methanol acted as a sacrificial reagent to capture photogenerated holes. In a typical photocatalytic experiment, 0.1 g of the 3D g-C3N4/TNA catalyst was added to a mixed solution containing 90 mL of water and 10 mL of methanol. The loading of 1.2 wt% Pt co-catalyst was conducted by photoreduction of H2PtCl6. To remove the dissolved oxygen and to ensure the anaerobic conditions, the reaction system was purged with argon for 1 h at a flow rate of 70 sccm controlled by mass flow controller unit before irradiation. The reaction temperature was maintained at 10 °C by a flow of cooling water. The amount of evolved H2 was detected using an on-line gas chromatograph (Shimadzu, GC-14C).3 Results and discussion
Fig. 2 shows SEM images of the 3D g-C3N4/TNA. Fig. 2a shows a highly ordered 3D nanotube structure, and the diameter of the nanotubes was about 160 nm. All of the 3D g-C3N4/TNA nanocomposites were open at both ends. The length of the 3D g-C3N4/TNA was approximately 35 μm (Fig. 2c). The BET surface areas of the 3D g-C3N4/TNA were analyzed using the automated surface area and pore size analyzer. The calculated specific surface area of the 3D g-C3N4/TNA was approximately 103.6 m2 g−1.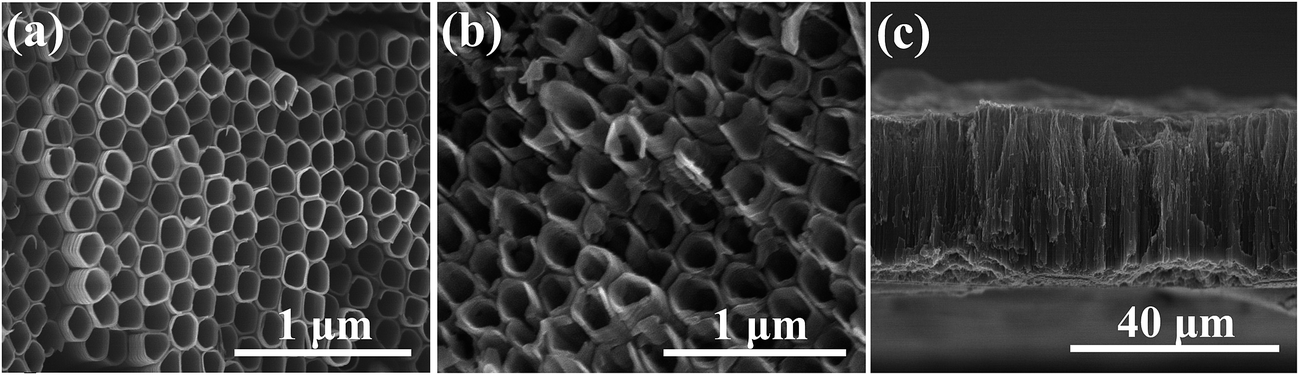 | ||
| Fig. 2 SEM images of the 3D g-C3N4/TNA: (a) top view, (b) bottom view, and (c) cross-sectional view. | ||
Fig. 3a shows a representative TEM image of the as-prepared 3D g-C3N4/TNA, in which the hollow structures with a smooth tube wall can be clearly seen. The high-resolution TEM image of the 3D g-C3N4/TNA nanocomposites exhibited that the material was crystalline with interplanar spacing of 0.353 nm (inset of Fig. 3a), which corresponded to the (101) plane of anatase TiO2. Meanwhile, the lattice spacing for g-C3N4 was 0.336 nm (inset of Fig. 3b), which corresponded to the (002) plane of hexagonal g-C3N4 (JCPDS 87-1526).15 The size distribution of more than 90% of the g-C3N4 QDs fell in the range of 7–10 nm, and the mean particle diameter was about 7.6 nm (Fig. 3c). Fig. 3d presents the EDX spectrum of the 3D g-C3N4/TNA; Ti, O, C, and N were observed in the 3D g-C3N4/TNA.
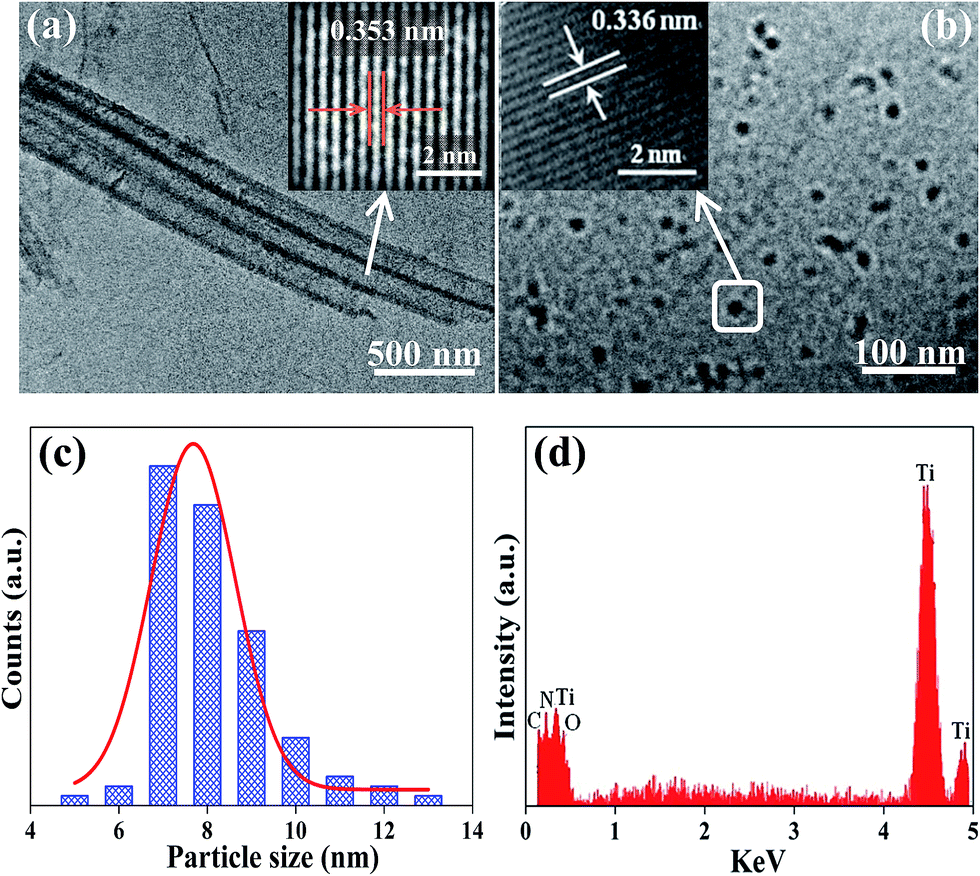 | ||
| Fig. 3 TEM image of (a) the 3D g-C3N4/TNA and (b) the g-C3N4 QDs in 3D g-C3N4/TNA. (c) The size distribution of the g-C3N4 QDs. (d) EDX spectrum of the 3D g-C3N4/TNA. | ||
Fig. 4 shows the XRD patterns of the 3D g-C3N4/TNA. The diffraction peaks at 2θ values of 25.33°, 37.84°, 48.07°, 53.95°, and 55.11° were observed, which correspond to the plane diffractions of (101), (004), (200), (105), and (211), respectively. These results correspond to the reflections of the crystalline anatase-TiO2 planes (JCPDS 21-1272). Meanwhile, the characteristic peak of g-C3N4 at 27.5° conforms to the (002) plane of g-C3N4.
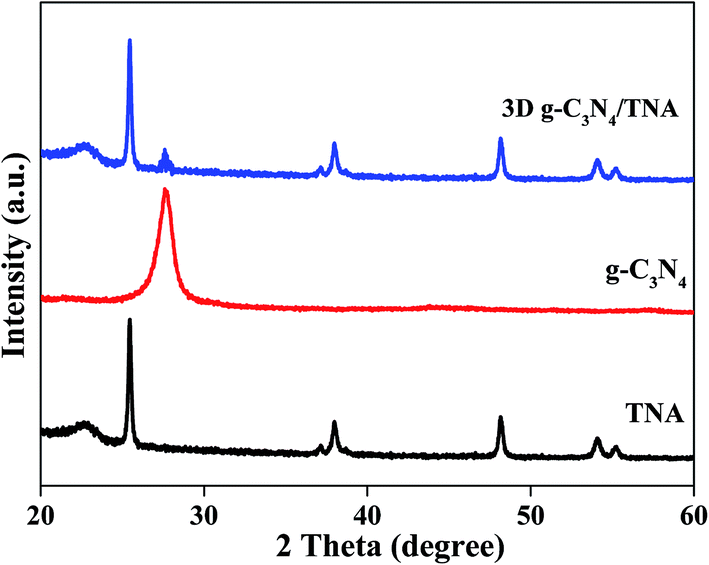 | ||
| Fig. 4 XRD patterns for the 3D g-C3N4/TNA. | ||
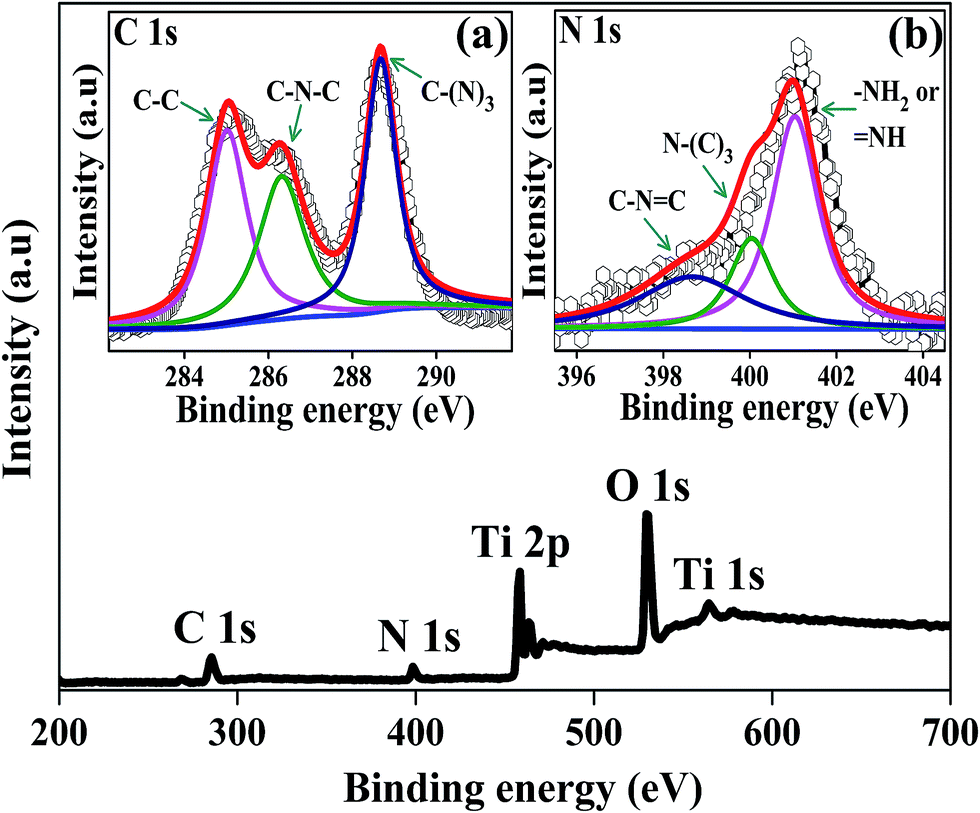
The XPS spectra of the 3D g-C3N4/TNA were recorded to analyze the chemical composition. The peaks corresponding to Ti, O, C, and N were observed for the 3D g-C3N4/TNA from Fig. 5. The Ti 2p3/2 and Ti 2p1/2 binding energies were observed at 458.8 eV and 464.7 eV, respectively, which indicated that the Ti4+ species were present in the form of TiO2 clusters.16 The position of the O 1s band at ∼529.7 eV slightly deviated from the standard position at ∼530.0 eV,17 which was probably caused by the chemical configuration, and it further confirms the Ti–O bond at TiO2.18 As shown in Fig. 5a, a high resolution C 1s spectrum was recorded for the 3D g-C3N4/TNA and found to have three peaks. The peak located at 285.1 eV was due to C–C and/or adventitious carbon, and the following peaks at 286.4 and 288.4 eV could be accounted for by the C–N–C and C–(N)3 groups of g-C3N4, respectively.18 No chemical interaction occurred between g-C3N4 and TNA. Fig. 5b shows the regional spectrum of N 1s for the 3D g-C3N4/TNA. The spectrum could be deconvolved into three peaks, viz. 398.9, 399.9, and 400.9 eV, which could account for the C–N![[double bond, length as m-dash]](https://www.rsc.org/images/entities/char_e001.gif) C, N–(C)3, and –NH2 or NH of the uncondensed terminal amino groups of the material, respectively.19
C, N–(C)3, and –NH2 or NH of the uncondensed terminal amino groups of the material, respectively.19
 | ||
| Fig. 5 XPS spectra of the full scan for the 3D g-C3N4/TNA (inset: (a) C 1s and (b) N 1s). | ||
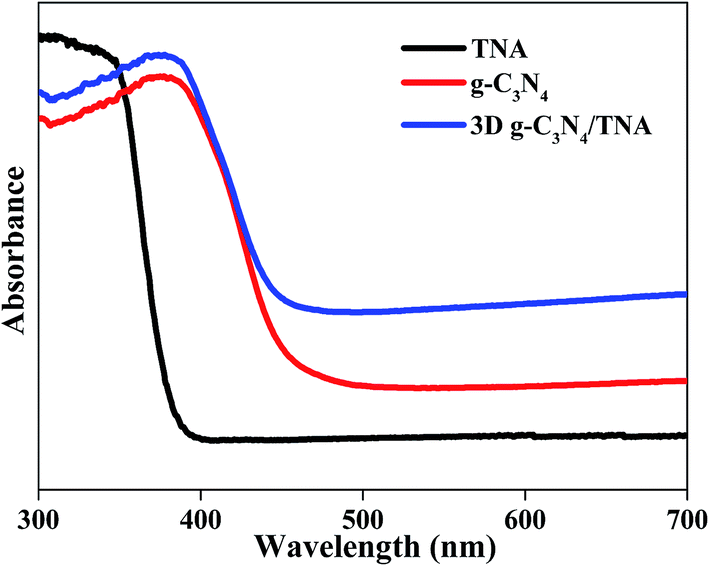
UV-vis diffuse reflection spectra are shown in Fig. 6 to understand the optical absorption properties of the 3D g-C3N4/TNA. The band gap of anatase TiO2 is about 3.2 eV, so its absorption onset is located at ∼388 nm. The band gap for g-C3N4 is 2.71 eV, corresponding to the absorption onset of ∼458 nm.15 In comparison with g-C3N4 and TNA, the 3D g-C3N4/TNA has an absorption in the visible range that accompanies a red shift in the absorption edge due to the synergistic effect between TiO2 and g-C3N4.20 These results indicate that the obtained 3D g-C3N4/TNA could be employed under visible light irradiation.
 | ||
| Fig. 6 UV-vis diffuse reflection spectra of the 3D g-C3N4/TNA. | ||
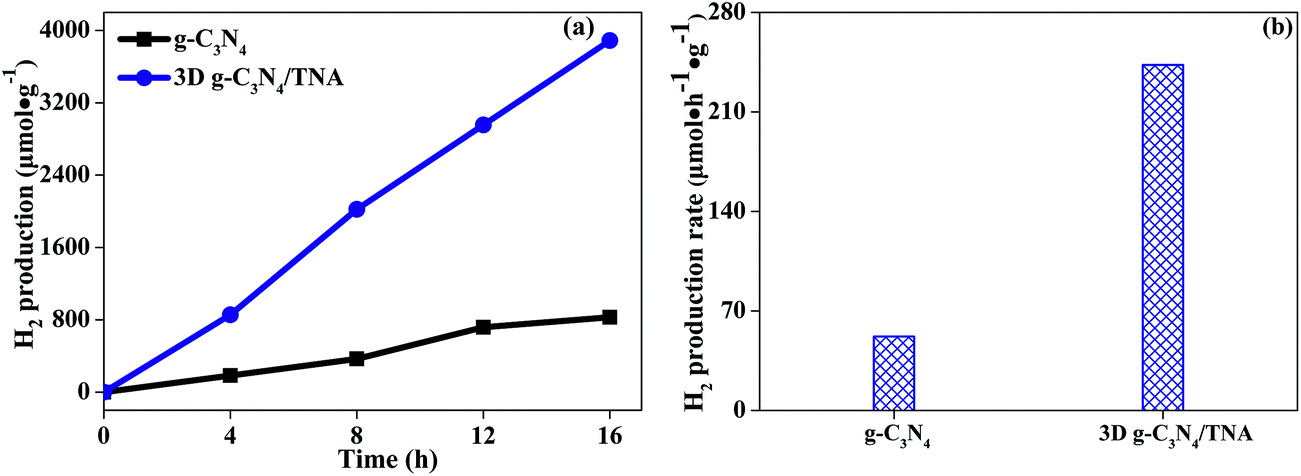
In this study, 3D g-C3N4/TNA as well as sole g-C3N4 was tested for photocatalytic H2 production through water splitting under visible light irradiation. Time dependent production of H2 and corresponding rate of H2 production are given in Fig. 7. It can be seen that all the H2 production increased with respect to the irradiation time (Fig. 7a). As shown in Fig. 7b, the average H2 production observed by sole g-C3N4 was 52 μmol h−1 g−1. However, the 3D g-C3N4/TNA produced 243 μmol h−1 g−1, which are 4.7 times higher than that of sole g-C3N4. Such an improvement in H2 production is attributed to the distinguish nanostructure of 3D g-C3N4/TNA. During photocatalytic reaction, benefiting from an attractive heterostructure between g-C3N4 and TiO2 leading to a unique photogenerated charge separation. Meanwhile, the highly ordered 3D TNA nanostructures can promote better dispersion of g-C3N4 QDs and extend the number of active sites, which may be another factor to the increase in corresponding rate of H2 production. In addition, the stability of the 3D g-C3N4/TNA was investigated in four consecutive runs of the accumulation of 64 h of irradiation. No deactivations occurred for the 3D g-C3N4/TNA, indicating a considerable photostability for H2 production.
 | ||
| Fig. 7 (a) The time for H2 production and (b) the corresponding rate for the 3D g-C3N4/TNA. | ||
4 Conclusions
In summary, a novel 3D g-C3N4/TNA nanostructure was developed by a simple electro-deposition of g-C3N4 QDs on TNA. The 3D g-C3N4/TNA contributed to enhanced visible-light harvesting and reduced recombination of photogenerated electron–hole pairs due to the synergistic effect of heterojunction structure between g-C3N4 QDs and TNA, thereby leading to a high photocatalytic activity for H2 production under visible light irradiation. Meanwhile, the well-ordered 3D TNA nanostructure was also beneficial to the H2 production. Herein, compared with sole g-C3N4, the average H2 production increased 4.7 times using the 3D g-C3N4/TNA nanocomposite. This simplified strategy reported here can be applied to form other 3D nanostructures, and nanoscale heterojunction structure based on TiO2 nanotube array.Acknowledgements
This study was supported by the National Natural Science Foundation of China (51478075, 21590813) and the Natural Science Foundation of Liaoning Province of China (2014020149). We also appreciate the support of the Scientific research project of Liaoning Provincial Department of Education (L201603) and the Open Foundation of Fujian Provincial Key Laboratory of Ecology-Toxicological Effects & Control for Emerging Contaminants (PY16005).References
- S. J. Kim, K. J. Kim, A. M. Dayaghi and G. M. Choi, Int. J. Hydrogen Energy, 2016, 41, 14498 CrossRef CAS.
- A. Fujishima and K. Honda, Nature, 1972, 238, 37 CrossRef CAS PubMed.
- Z. Q. Sun, J. H. Kim, Y. Zhao, F. Bijarbooneh, V. Malgras, Y. Lee, Y. M. Kang and S. X. Dou, J. Am. Chem. Soc., 2011, 133, 19314 CrossRef CAS PubMed.
- D. Fattakhova-Rohlfing, A. Zaleska and T. Bein, Chem. Rev., 2014, 114, 9487 CrossRef CAS PubMed.
- H. Wang, X. Quan, H. Yu and S. Chen, Carbon, 2008, 46, 1126 CrossRef CAS.
- S. H. Hwang, J. Yun and J. Jang, Adv. Funct. Mater., 2014, 24, 7619 CrossRef CAS.
- J. S. Zhang, M. W. Zhang, C. Yang and X. C. Wang, Adv. Mater., 2014, 26, 4121 CrossRef CAS PubMed.
- Z. Sun, J. H. Kim, Y. Zhao, D. Attard and S. X. Dou, Chem. Commun., 2013, 49, 966 RSC.
- T. B. Nguyen and R. A. Doong, RSC Adv., 2016, 6, 103428 RSC.
- X. Wang, K. Maeda, A. Thomas, K. Takanabe, G. Xin, J. M. Carlsson, K. Domen and M. Antonietti, Nat. Mater., 2009, 8, 76 CrossRef CAS PubMed.
- W. Wang, J. C. Yu, Z. Shen, D. K. L. Chan and T. Gu, Chem. Commun., 2014, 50, 10148 RSC.
- G. Li, Z. Lian, W. Wang, D. Zhang and H. Li, Nano Energy, 2016, 19, 446 CrossRef CAS.
- J. Su, L. Zhu and G. Chen, Appl. Catal., B, 2016, 186, 127 CrossRef CAS.
- G. H. Liu, N. Hoivik, K. Y. Wang and H. Jakobsen, J. Mater. Sci., 2011, 46, 7931 CrossRef CAS.
- L. Ge, F. Zuo, J. Liu, Q. Ma, C. Wang, D. Sun, L. Bartels and P. Feng, J. Phys. Chem. C, 2012, 116, 13708 CAS.
- X. Lu, G. Wang, T. Zhai, M. Yu, J. Gan, Y. Tong and Y. Li, Nano Lett., 2012, 12, 1690 CrossRef CAS PubMed.
- J. Huang, X. Tan, T. Yu, L. Zhao and H. Liu, J. Solid State Electrochem., 2015, 19, 1151 CrossRef CAS.
- D. B. Hamal and K. J. Klabunde, J. Phys. Chem. C, 2011, 115, 17359 CAS.
- S. C. Yan, Z. S. Li and Z. G. Zou, Langmuir, 2010, 26, 3894 CrossRef CAS PubMed.
- X. L. Wang, W. Y. Yang, F. T. Li, Y. B. Xue, R. H. Liu and Y. J. Hao, Ind. Eng. Chem. Res., 2013, 52, 17140 CrossRef CAS.
| This journal is © The Royal Society of Chemistry 2017 |