 Open Access Article
Creative Commons Attribution 3.0 Unported Licence
Metabolomics analysis reveals aminoquinazolin derivative 9d-induced oxidative stress and cell cycle arrest in A549 cells
Wenrui Liuac,
Feng Jinad,
Dan Gao *bc,
Lu Songac,
Chao Dingab and
Hongxia Liu*bc
aDepartment of Chemistry, Tsinghua University, Beijing 100084, China
bState Key Laboratory Breeding Base-Shenzhen Key Laboratory of Chemical Biology, Graduate School at Shenzhen, Tsinghua University, Shenzhen 518055, China. E-mail: gao.dan@sz.tsinghua.edu.cn
cKey Laboratory of Metabolomics at Shenzhen, Shenzhen 518055, China. E-mail: liuhx@sz.tsinghua.edu.cn; Tel: +86 755 26036035
dNeptunus Pharmaceutical Technology Center, Shenzhen, 518057, China
First published on 24th February 2017
Abstract
A novel aminoquinazolin derivative (named 9d), synthesized in our lab shows potential antitumor activity against A549 lung cancer cell lines. However, previous studies on the pharmacological mechanism of 9d mostly focused on cell and gene levels; the metabolic mechanism remains unknown. In this paper, an ultra-performance liquid chromatography coupled to quadrupole time-of-flight mass spectrometry (UPLC/Q-TOF MS) based metabolomics approach was established to study the probable antitumor mechanism. Q-TOF MS and MS/MS were used to identify significantly different metabolites. 22 significantly different metabolites were observed between the 9d-treated A549 lung cells group and control group. They were involved in glycerophospholipid metabolism, glutathione metabolism, phenylalanine metabolism, cysteine and methionine metabolism, and aminoacyl-tRNA biosynthesis. The results showed that glutathione level and cell-membrane components phosphatidylcholines were decreased in 9d-treated cells, while their oxidative products, oxidized glutathione and lysophosphatidylcholines, were significantly increased. Further biological investigation showed an apparent accumulation of reactive oxygen species and a decrease in mitochondrial membrane potential. The results indicated that the aminoquinazolin derivative induced oxidative stress-mediated apoptosis. Moreover, phenylalanine metabolism suggested the up-regulation of L-phenylalanine might act as an endogenous drug carrier of 9d to improve cellular antiproliferation ability. The inhibition of aminoacyl-transfer RNA and flow cytometry results indicated that cell cycle progression was blocked in the G1 phase, which was in accordance with the results obtained from some marketed aminoquinazolin derivatives. The above results proposed that 9d could induce oxidative stress and cell cycle arrest, which finally led to cell apoptosis in A549 cells. The study supplies a rapidly and highly active strategy to investigate the antitumor mechanism of drugs, which benefits its further improvement and development.
Introduction
Quinazoline compounds were firstly isolated from Gabriel plants, possessing a series of biological effects, such as sedation,1 anti-inflammation,2 anti-hypertension,3 antimalaria,4 antifungi5 and other pharmacological effects. In recent years, as an active skeletal structure of pharmacodynamic activities, several quinazoline compounds have been successfully applied as anticancer drugs.6 Aminoquinazoline compounds are the representative structures among quinazoline compounds, which have an anti-cancer effect primarily through inhibiting the epidermal growth factor receptor or its tyrosine kinase by the phosphorylation of epidermal growth factor receptor tyrosine kinase (EGFR-TK), such as gefitinib,7 erlotinib8 and vandetanib.9 However, some challenges appeared for those marketed drugs. For instance, gefitinib has markedly improved the drug efficiency in non-small cell lung cancer (NSCLC) patients, but it lacks prolonged effectiveness due to acquired resistance mainly caused by T790M mutation.10,11 Afatinib exhibited antitumor activity by upregulating bypass signal, but the signal consisted of numerous genetic and epigenetic signaling aberrations.12 Nevertheless, selective disruption of EGFR by small-molecule inhibitors has been clinically validated as a rational strategy for cancer. Therefore, new aminoquinazoline compounds are still needed to be developed.13 As one of the most potent compounds, CUDC-101 had already entered phase I clinical investigation.14 However, biological activities and pharmacological effects of some drugs in the research stage were explored by molecular biological technologies on cell or kinases level.15 The comprehensive understanding of their anti-tumor mechanism was still limited. Therefore, a simple and reliable method was extremely needed to further explore the antitumor mechanisms of aminoquinazoline derivatives.Metabolomics, known as metabolic profiling analysis, is widely applied in disease diagnosis,16 drug discovery research,17 pharmacodynamic mechanism and drug toxicology exploration.18 Through the changes of metabolites levels in biological samples, we could understand the complex physiological and pathological conditions of different biological systems.19 Currently, metabolic profiling plays an important role in the evaluation of drug toxicity in the drug trial phase, such as the determination of optimal drug doses through drug-level measurements.20 For example, as a potential anticancer agent, CAT was analyzed by endogenous metabolites for a better understanding of the efficacy and toxicity of potential anticancer agent.21 This method showed its advantages in monitoring chemical changes of living cells, especially some low molecular weight metabolites. Currently, different analytical techniques have been used for metabolomics study, including nuclear magnetic resonance (NMR) and mass spectrometry (MS). NMR exhibits strong structural analysis ability but low sensitivity for trace constituents in biological samples, while MS can overcome such shortcomings. In combination with liquid chromatography (LC) and gas chromatography (GC), MS shows its powerful capability for qualitative and quantitative metabolomics study. When compared with conventional platforms, ultra-performance liquid chromatography coupled to quadrupole time-of-flight mass spectrometry (UPLC/Q-TOF MS) possesses several advantages, such as superb sensitivity, high resolution and strong specificity, thus it is more appropriate for metabolomics studies.22
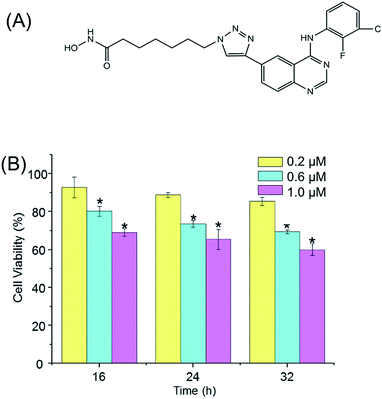
In our previous studies, a series of aminoquinazolin derivatives have been synthesized, the derivative 9d, 7-(4-(4-((3-chloro-2-fluorophenyl)amino)quinazolin-6-yl)-1H-1,2,3-triazol-1-yl)-N-hydroxyheptanamide (Fig. 1A), exhibited excellent inhibitory activity against A549 cells.23 The underlying mechanism of the anti-proliferative activity of 9d is worthy to be explored. Here, a comprehensive metabolite profile of aminoquinazoline derivative 9d against A549 cell line is presented. Significant metabolites changes after the stimulation of 9d were identified, and the important involved metabolic pathways were verified with the traditional molecular biological. Our results suggested that 9d caused significant disturbance in glycerophospholipid metabolism, glutathione metabolism, phenylalanine metabolism, cysteine and methionine metabolism, aminoacyl-tRNA biosynthesis, as well as several other significantly changed metabolites. The following biological verification and flow cytometry results indicated that 9d could induce oxidative stress and cell cycle arrest, which finally led to cell apoptosis.
Experimental
Reagents and materials
4-Anilinoquinazolines with C-6 triazole-linked long alkyl chains of hydroxamic acid (9d), was synthesized by our lab. Dimethyl sulfoxide (DMSO) and 3-(4,5-dimethyl-thiazol-2-yl)-2,5-diphenyl-tetrazolium bromide (MTT) were purchased from Sigma-Aldrich Co. (St. Louis, USA). A549 cell line was purchased from Shanghai Institute of Cell Biology, Chinese Academy of Sciences (Shanghai, China). F-12K culture medium was purchased from Genom Biotech Co., Ltd. (Hangzhou, China). Fetal Bovine Serum (FBS) was obtained from Biochrom Co., Ltd. (Cambridge, UK). Streptomycin sulfate and penicillin were purchased from North China Pharmaceutical, China. Acetonitrile and methanol (HPLC grade) were purchased from Fisher (Fairlawn, USA). HPLC grade formic acid was purchased from Tedia (Tedia Co., USA). Distilled water was filtered through a Milli-Q system (Millipore, USA). Reactive oxygen species (ROS) assay kit and rhodamine 123 (Rh 123) were purchased from Beyotime Institute of Biotechnology (Shanghai, China).Cell viability assays
The cell viability was assessed by MTT assay to determine the optimal drug concentration for metabolomics study. First, A549 cells were cultured in F-12K medium supplemented with 10% FBS, 100 μg mL−1 streptomycin and 100 μg mL−1 penicillin. Cells were maintained at 37 °C in a 5% CO2-humidified air atmosphere incubator, and culture medium was renewed every 24 h. For cell viability assay, cells in logarithmic phase (85% confluence) were digested with 0.25% trypsin and washed with PBS twice. Cells were then collected at 1000 rpm for 5 min and resuspended to 5 × 10⁴ cells per mL. About 5 × 10³ cells per well were seeded in a 96-well plate. 9d was prepared in DMSO at a concentration of 10 mM, and the solution was diluted with culture medium to obtain gradient concentrations of 200 nM, 600 nM and 1000 nM. They were added to each well in sextuplet and then incubated for 16 h, 24 h, and 32 h respectively. After treatment, cells were incubated with 10 μL of MTT solution (5 mg mL−1 in PBS) for 4 h at 37 °C. The formazan precipitate was dissolved in 100 μL DMSO and the absorbance at 490 nm was measured by a Benchmark microplate reader (Molecular Devices Corporation, USA).Sample preparation for metabolomics
Seven replicates of 9d-treated and control groups were prepared for the metabolomics study. For each replicate of the drug-treated group, 5 × 10⁶ cells in a 10 cm dish were exposed to 600 nM of 9d and a same amount of DMSO as a control group. Note that the final concentration of DMSO should be controlled in less than 0.1% to avoid cell cytotoxicity. After 24 h incubation, the culture medium was removed, cells were quickly washed by gently dispensing 10 mL of 37 °C deionized water to remove residual medium and to arrest cellular metabolism. Then 1 mL of ice cold 80% aqueous methanol at −20 °C was added into the culture dish to quench cells. The quenched cells were scraped, collected and transferred to 2 mL centrifuge tubes. Then the cells in an ice bath were ultrasonicated intermittently (5 s of ultrasonication and 10 s of interval) by an ultrasonicator for 10 min and subsequently centrifuged at 4 °C for 10 min at 13![[thin space (1/6-em)]](https://www.rsc.org/images/entities/char_2009.gif) 000g. The supernatant was collected and dried in the nitrogen environment. The residues were resuspended in 1.0 mL acetonitrile/water (1
000g. The supernatant was collected and dried in the nitrogen environment. The residues were resuspended in 1.0 mL acetonitrile/water (1![[thin space (1/6-em)]](https://www.rsc.org/images/entities/char_2009.gif) :
:![[thin space (1/6-em)]](https://www.rsc.org/images/entities/char_2009.gif) 1, v/v) mix, and were filtered through 0.22 μm mesh millipore filters (Florham Park, NJ) into glass auto-samplers. The residues were stored at −80 °C for further analysis. A quality control (QC) sample was prepared by mixing 30 μL volumes of solution from each of the 14 samples into a glass auto-sampler. The pooled QC sample was injected five times at the beginning of the run and then analysed every three samples to further monitor the stability of the system.
1, v/v) mix, and were filtered through 0.22 μm mesh millipore filters (Florham Park, NJ) into glass auto-samplers. The residues were stored at −80 °C for further analysis. A quality control (QC) sample was prepared by mixing 30 μL volumes of solution from each of the 14 samples into a glass auto-sampler. The pooled QC sample was injected five times at the beginning of the run and then analysed every three samples to further monitor the stability of the system.
UPLC/Q-TOF MS conditions
The UPLC/Q-TOF MS analysis was performed using Acquity™ Ultra-Performance Liquid Chromatography system (Waters Corporation, MA, USA) coupled to Q-TOF premier Mass Spectrometer (Waters Corporation, MA, USA), operated in the positive (ESI+) and negative (ESI−) electrospray ionization modes. The chromatographic separation was carried out on a Waters Acquity™ BEH C18 column (100 mm × 2.1 mm, 1.7 μM). The column and samples were maintained at 35 °C and 4 °C, respectively.The flow rate was set at 0.5 mL min−1. The mobile phase consisted of (A) 0.1% formic acid in water and (B) acetonitrile in positive ion mode, while (A1) 5 mM ammonium acetate in water and (B1) 5 mM ammonium acetate in acetonitrile (95![[thin space (1/6-em)]](https://www.rsc.org/images/entities/char_2009.gif) :
:![[thin space (1/6-em)]](https://www.rsc.org/images/entities/char_2009.gif) 5, v/v) in negative ion mode. Elution gradient was linearly increased from 5% to 40% B (B1) within 5 min, then to 100% B (B1) within 5 min and maintained for 1 min, followed by declining to 5% B (B1). Total running time was 15 min per separation. A 10 μL sample volume was introduced onto the column. The Waters Q-TOF premier was equipped with an electrospray ion source in both positive and negative ion modes and V optics mode. The capillary voltages were 3.5 kV (ESI+) and 2.5 kV (ESI−), cone voltages were 35 V (ESI+) and 30 V (ESI−). Cone gas flow was set at 50 L h−1 with the source temperature at 120 °C. Desolvation gas flow was maintained at 500 L h−1 with the desolvation gas temperature at 300 °C. Data were collected in the centroid mode. The mass range was m/z 80–1000 with a scan time of 0.20 s and inter-scan time of 0.02 s. For mass accuracy, leucine-enkephalin (m/z 556.2771, ESI+; m/z 554.2615, ESI−) at the final concentration of 100 pg μL−1 in acetonitrile–water with 0.1% formic acid (50
5, v/v) in negative ion mode. Elution gradient was linearly increased from 5% to 40% B (B1) within 5 min, then to 100% B (B1) within 5 min and maintained for 1 min, followed by declining to 5% B (B1). Total running time was 15 min per separation. A 10 μL sample volume was introduced onto the column. The Waters Q-TOF premier was equipped with an electrospray ion source in both positive and negative ion modes and V optics mode. The capillary voltages were 3.5 kV (ESI+) and 2.5 kV (ESI−), cone voltages were 35 V (ESI+) and 30 V (ESI−). Cone gas flow was set at 50 L h−1 with the source temperature at 120 °C. Desolvation gas flow was maintained at 500 L h−1 with the desolvation gas temperature at 300 °C. Data were collected in the centroid mode. The mass range was m/z 80–1000 with a scan time of 0.20 s and inter-scan time of 0.02 s. For mass accuracy, leucine-enkephalin (m/z 556.2771, ESI+; m/z 554.2615, ESI−) at the final concentration of 100 pg μL−1 in acetonitrile–water with 0.1% formic acid (50![[thin space (1/6-em)]](https://www.rsc.org/images/entities/char_2009.gif) :
:![[thin space (1/6-em)]](https://www.rsc.org/images/entities/char_2009.gif) 50 v/v) was used as the lock mass (m/z 556.2771) with a flow rate of 0.05 mL min−1. Lock spray frequency was set at 10 s and scan to average for correction was 10 s with the reference cone voltage at 40 V. For MS/MS analysis, the collision energy was set in a ramp mode, ranging from 10 V to 40 V.
50 v/v) was used as the lock mass (m/z 556.2771) with a flow rate of 0.05 mL min−1. Lock spray frequency was set at 10 s and scan to average for correction was 10 s with the reference cone voltage at 40 V. For MS/MS analysis, the collision energy was set in a ramp mode, ranging from 10 V to 40 V.
Metabolomics data analysis
The initial data of the control and 9d-treated groups were processed using MarkerLynx software 4.1 (Waters Corporation, MA, USA), which worked by integrating chromatogram peak in the UPLC/MS data under the operation of Apex-Track-peak detection package. Every chromatogram peak was distinguished by mass to charge ratio (m/z), retention time (RT) as well as their associated height intensities. Prior to multivariate statistical analysis, the total sum of chromatogram was normalized. To avoid the effect of system error, the noise and background interference were excluded, the signal strength of each ion was normalization. Then the three-dimensional data, peak number (RT_m/z pair), sample name, and normalized ion intensity were introduced into SIMCA-P 11.5 software package (Umetrics, Umea, Sweden) for multivariate data analysis, and then analyzed by principle component analysis (PCA) and orthogonal partial least squares discriminant analysis (OPLS-DA). As a typical unsupervised method, PCA can be used to supervise samples directly and provide information of potential biomarkers. Based on training sample aggregation, OPLS-DA, logistic regression, support vector machines (SVMs) and other supervised methods can also be conducted to establish a predictive model for the analysis of unknown samples.24 In addition, all data represented at least seven independent parallel experiments and they were expressed as means ± standard deviation (SD). Metabolites with significant difference (p < 0.05) were considered as potential biomarkers and subjected to further identification of the molecular formula by tandem mass spectrometry (MS/MS), then the metabolites were determined with databases of HMDB (http://www.hmdb.ca/) and METLIN (http://metlin.scripps.edu/), which gather the standard fragmentation patterns of biological metabolites. Besides, to identify the metabolic pathways related to those metabolites, the MetPA (www.metaboanalyst.ca) was introduced to reveal altered metabolism pathways.Flow cytometry analysis
For the purpose of cell cycle arrest analysis, A549 cells were treated with 9d of 200 nM, 600 nM and 1000 nM for 24 h at 37 °C and then were harvested by trypsinization while in the exponential growth phase (80–90% confluence). Cells were treated according to the protocol of PI apoptosis detection kit (Beyotime Institute of Biotechnology, China) and subjected to the flow cytometry (Moflo XDP, Beckman Coulter, USA) to assay.Detection of reactive oxygen species (ROS) and mitochondrial membrane potential (MMP)
A549 cells in the logarithmic growth were plated in 6-well cell culture plates at initial densities of 1 × 10⁶ cells per mL and incubated for 12 h, and then treated with 0, 200, 600 and 1000 nM of 9d for 24 h. The levels of intracellular ROS and MMP were determined according to the instruction of relevant regents respectively. Cells were harvested and suspended in PBS, 1 × 10⁶ cells were then incubated separately with 10 μM 2,7-dichlorfluorescein-diacetate (DCFH-DA) and 2 μM Rh 123 in dark for 30 min at 37 °C for ROS and MMP detection. The fluorescence was detected with a fluorescence spectrophotometer (ROS, Ex = 485 nm and Em = 525 nm; MMP, Ex = 507 nm and Em = 529 nm).Result and discussion
Cell viability assay
Prior to metabolomic analysis, the effects of 9d concentration and incubation time on A549 cell viability were investigated to gain the optimal drug effect with minimal cell death. As shown in Fig. 1B, the cytotoxicity of 9d was not significantly affected with the increasing incubation time, but the antiproliferative activity increased obviously with the increasing concentration of 9d. When 9d concentration was 200 nM, the induced apoptotic A549 cells was less than 15% with the incubation time ranged from 16 to 32 h. However, when 9d concentration increased to 1000 nM, only 70% viable cells were left with the three different incubation times. When 9d concentration was 600 nM, the viability of A549 cells was at approximately 80% and 75% separately at the incubation time of 16 and 24 h, which was appropriate for metabolomics study. For the convenient of the following experiment, 600 nM of 9d and incubation time of 24 h were finally selected.Multivariate statistical analysis and identification of intercellular discriminate metabolites
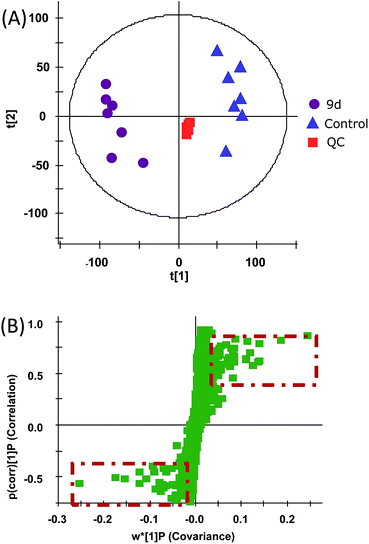
In order to investigate the metabolic fingerprints in A549 cells, the metabolites extracted from vehicle control and 9d-treated cells were profiled by UPLC/Q-TOF MS in both positive and negative ion modes. The results showed that positive ion mode provided richer information than the negative. Respective base peak chromatograms (BPC) were shown in Fig. 2. The acquired initial data were then analysed by the Markerlynx software (version 4.1, Waters Corporation, MA, USA). Fig. 3A showed the PCA score plots in positive ion mode, representing the distribution between the vehicle control (Control) and 600 nM 9d with two principle components. And the QC samples were tightly clustered, indicating the excellent column stability in the whole run.25 Besides, an obvious separation was observed between the control group and 9d-treated A549 cell group, indicating that 9d induced the distinguished change of intracellular metabolites. The S-plot was a scatter plot which combined the covariance and correlation loading profiles arising from the predictive components of OPLS-DA model, which suggested the control and 9d groups were clearly separated. Such analysis exhibited intuitive variable that had significant contributions to the distinction of these two groups. The significant variables, with high correlation and covariance values, were located in regions far away from the origin (red boxes in Fig. 3B), and were selected as potential biomarkers. An independent t-test indicated that these variables between the control and 9d-treated cells were statistically significant (p < 0.05). A List of metabolites except for those involved in glutathione metabolism, glycerophospholipid metabolism, aminoacyl-tRNA biosynthesis, cysteine and methionine metabolism were summarized in Table 1, including retention time, the mass obtained in UPLC-MS system, the mass error when compared with the database and the metabolite's fragment ions used for structure identification experiments. A total of 22 significant changed metabolites were identified in positive and negative ion modes.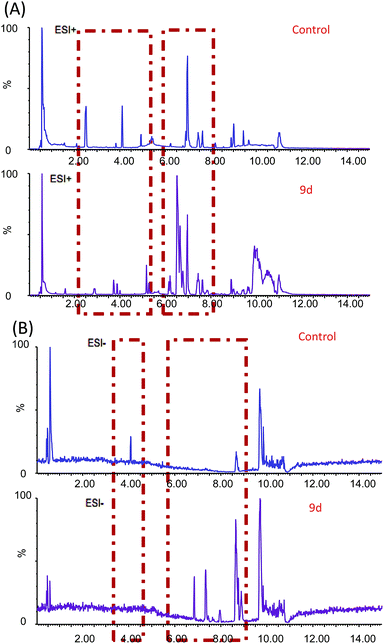 | ||
| Fig. 2 BPC obtained from A549 cell extracts with and without 9d treatment in positive (A) and negative (B) ion modes. | ||
| Compound | RT (min) | Measured mass (Da) | Mass error (ppm) | Fragment ions (m/z) |
|---|---|---|---|---|
| Isoxanthopterin | 0.5768 | 180.0469 | 14.44 | 110.0579, 135.0513, 163.0540 |
| Guanosine | 0.5769 | 284.0949 | 11.26 | 135.0387, 152.0588, 284.0949 |
| Propionylcarnitine | 0.5804 | 218.1377 | 28.88 | 60.0641, 85.0411, 159.0551 |
| N,N′-Dicyclohexylurea | 5.2241 | 225.1917 | 12.43 | 61.0211, 83.0938, 142.1235 |
| Chavicol | 6.1999 | 135.0760 | 20.73 | 77.0507, 107.0323, 135.0860 |
| Sphinganine | 6.5727 | 302.3035 | 17.86 | 60.0782, 254.3872, 284.5975 |
| N-(α-Linolenoyl)tyrosine | 7.3612 | 442.2895 | −12.89 | 136.0742, 165.1020, 182.0881 |
| Heptanoylthio-PC | 7.6053 | 610.4231 | 6.39 | 184.0688, 296.1014, 610.4263 |
| Palmitoyl-L-carnitine | 7.8471 | 400.3428 | 19.73 | 85.0402, 341.2745, 400.3428 |
| Cetaben | 9.5712 | 362.3051 | 19.32 | 57.0665, 94.0640, 138.0253 |
Metabolic pathways analysis
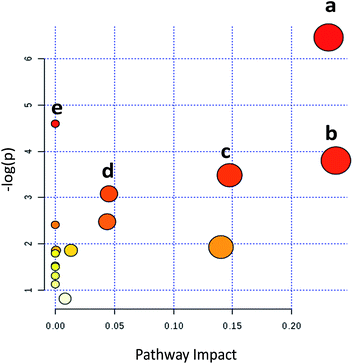
Metabolic pathways disturbed by drug dosage were further studied using MetaboAnalyst based on the significantly different metabolites. MetaboAnalyst is a comprehensive database for high-throughput metabolomic data analysis, which was used to reveal the most relevant pathways disturbed by 9d. The results indicated that 22 significantly changed metabolites involved in glycerophospholipid metabolism, glutathione metabolism, phenylalanine metabolism, cysteine and methionine metabolism, aminoacyl-tRNA biosynthesis (Fig. 4). The impact values of glycerophospholipid metabolism, glutathione metabolism, phenylalanine metabolism, cysteine and methionine metabolism were 0.23, 0.24, 0.15 and 0.04 respectively. In addition, some relative low impact pathways but involved more than three significantly changed metabolites, including L-phenylalanine, L-isoleucine and L-methionine, were also investigated in our experiment, such as aminoacyl-tRNA biosynthesis.By comparing the 9d-treated group with the vehicle control group, 5 metabolites were involved in glycerophospholipid metabolism, including PC(12![[thin space (1/6-em)]](https://www.rsc.org/images/entities/char_2009.gif) :
:![[thin space (1/6-em)]](https://www.rsc.org/images/entities/char_2009.gif) 0/18
0/18![[thin space (1/6-em)]](https://www.rsc.org/images/entities/char_2009.gif) :
:![[thin space (1/6-em)]](https://www.rsc.org/images/entities/char_2009.gif) 4), PC(16
4), PC(16![[thin space (1/6-em)]](https://www.rsc.org/images/entities/char_2009.gif) :
:![[thin space (1/6-em)]](https://www.rsc.org/images/entities/char_2009.gif) 0/18
0/18![[thin space (1/6-em)]](https://www.rsc.org/images/entities/char_2009.gif) :
:![[thin space (1/6-em)]](https://www.rsc.org/images/entities/char_2009.gif) 2), PC(16
2), PC(16![[thin space (1/6-em)]](https://www.rsc.org/images/entities/char_2009.gif) :
:![[thin space (1/6-em)]](https://www.rsc.org/images/entities/char_2009.gif) 0/22
0/22![[thin space (1/6-em)]](https://www.rsc.org/images/entities/char_2009.gif) :
:![[thin space (1/6-em)]](https://www.rsc.org/images/entities/char_2009.gif) 5), PE (14
5), PE (14![[thin space (1/6-em)]](https://www.rsc.org/images/entities/char_2009.gif) :
:![[thin space (1/6-em)]](https://www.rsc.org/images/entities/char_2009.gif) 0/20
0/20![[thin space (1/6-em)]](https://www.rsc.org/images/entities/char_2009.gif) :
:![[thin space (1/6-em)]](https://www.rsc.org/images/entities/char_2009.gif) 3) and LysoPC(24
3) and LysoPC(24![[thin space (1/6-em)]](https://www.rsc.org/images/entities/char_2009.gif) :
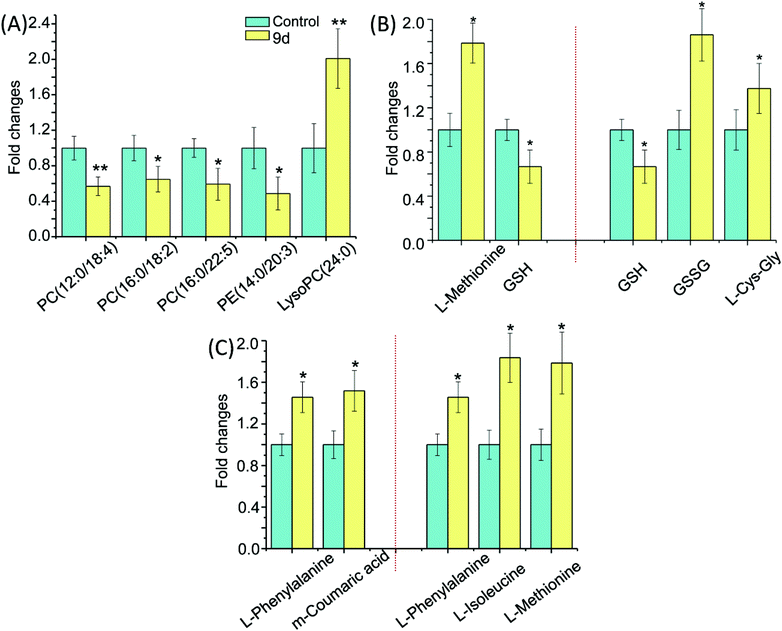
:![[thin space (1/6-em)]](https://www.rsc.org/images/entities/char_2009.gif) 0) (Fig. 5A). LysoPC has been selected as a marker of many diseases, such as Parkinson's disease (PD)26 and glomerular inflammation.27 As the intermediate of PC,28 LysoPC also regulates a variety of biological process including cell proliferation, tumour cell invasiveness, and inflammation. Our results showed that the detected LysoPC increased in the 9d-treated group, which indicated that the oxidative stress level in A549 cells might be up-regulated by 9d and then led to an increase in LysoPC level.29 Instead, PC and PE levels were decreased in 9d-treated cells. PE is a precursor of PC, which is involved in the turnover of cell membrane. These phospholipids take part in lipid signaling pathways, either acting as ligands or generating intermediate substrates.30 Generally, PC and PE are highly expressed in cancer cell lines for the enhanced proliferation and differentiation of cancer cells. PCs are the main components of cell membrane, so the changes of PC levels and its precursor PE are regarded as key indicators of pathophysiological changes. When A549 cells were treated with 9d, the cell membrane biosynthesis was prevented by the oxidative stress, which could be further demonstrated by ROS test.
0) (Fig. 5A). LysoPC has been selected as a marker of many diseases, such as Parkinson's disease (PD)26 and glomerular inflammation.27 As the intermediate of PC,28 LysoPC also regulates a variety of biological process including cell proliferation, tumour cell invasiveness, and inflammation. Our results showed that the detected LysoPC increased in the 9d-treated group, which indicated that the oxidative stress level in A549 cells might be up-regulated by 9d and then led to an increase in LysoPC level.29 Instead, PC and PE levels were decreased in 9d-treated cells. PE is a precursor of PC, which is involved in the turnover of cell membrane. These phospholipids take part in lipid signaling pathways, either acting as ligands or generating intermediate substrates.30 Generally, PC and PE are highly expressed in cancer cell lines for the enhanced proliferation and differentiation of cancer cells. PCs are the main components of cell membrane, so the changes of PC levels and its precursor PE are regarded as key indicators of pathophysiological changes. When A549 cells were treated with 9d, the cell membrane biosynthesis was prevented by the oxidative stress, which could be further demonstrated by ROS test.
As shown in Fig. 5B, three metabolites were involved in glutathione metabolism, including reduced glutathione (GSH), oxidized glutathione (GSSG), and L-cysteinyl-glycine (L-Cys-Gly). GSH is the most important antioxidant in cells and can convert to its disulfide form (GSSG) in enzymatic and nonenzymatic reactions. The balance of GSH and GSSG provides a dynamic indicator of oxidative stress in eliminating the free radicals and ROS. The negative association between GSH and GSSG suggests the increased glutathione redox capacity, mitochondrial superoxide production and a chronic inflammatory state.31,32 As shown in Fig. 5B, GSH decreased by nearly 40% in 9d-treated cells compared with the vehicle control, suggesting the 9d induced oxidative stress. While GSSG and L-Cys-Gly, the metabolites of intercellular redox reaction, were significantly increased in the 9d treated cells. The result suggested that GSH was also exhausted by the increased ROS that generated by 9d treated cells. Therefore, these results suggested the produced intercellular oxidative stress after 9d treatment might cause the cellular antiproliferation.
The cysteine (Cys) and methionine (Met) metabolism is essential for the entire biological world due to its critical role as the link between primary and secondary metabolism.33 L-Methionine and GSH involved in cysteine and methionine metabolism were identified in the 9d-treated A549 cells. In the 9d-treated group, L-methionine was increased significantly while GSH level was decreased (Fig. 5B). GSH, an important functional thiol, plays a key role in antioxidant activity. For example, protein could remain active for longer and also ensure its related biological activity, relying on the reduction of oxidation or inactivation of protein thiols. L-Methionine is the most important methyl donor in vivo and could combine with ATP to generate S-adenosylmethionine (SAM). Similarly, L-methionine has the lowest oxidation state of sulfur, which is akin to the thiol group in GSH and plays a key role in antioxidant activity. These organosulfur compounds account for their biochemical functions.34 For instance, lipid peroxidation caused by oxygen free radicals (ROS) in vivo does harm to the bio-function of cell membrane leading to the injury of organism. ROS will damage the primary and secondary lysosomal membrane, releasing acid phosphatases, which damage the cells, mitochondrial membrane and other organelles. While L-methionine struggled with these damages and its amounts were up-regulated.35 The results indicated that ROS might be produced by A549 cells after treatment with 9d.
As is well-known, phenylalanine (PA) is an essential aromatic amino acid in the function of many proteins and plays a key role in the biosynthesis of other amino acids. For example, PA is converted to tyrosine in the biosynthesis of dopamine and norepinephrine neurotransmitters.36 However, PA has two forms, the L-form is incorporated into proteins and the D-form acts as a painkiller. As shown in Fig. 5C, L-phenylalanine level was increased while the important source of L-phenylalanine biosynthesis was down-regulated like m-coumaric acid, indicating that related protein synthesis disorder was probably induced by 9d.37 Several studies have shown that L-phenylalanine can be used as a carrier of anticancer drugs, which have many advantages such as good stability and targeting and specific site delivery effect. Besides, L-phenylalanine could improve efficiency to 3–5 times compared with other amino acids, either in inhibiting cancer growth, or reducing the side effects of drugs.38 The up-regulated L-phenylalanine is likely to act as an endogenous carrier for 9d to improve the drug efficiency.
Moreover, aminoacyl-tRNA biosynthesis, which delivers the amino acid to the ribosome for incorporation into the polypeptide chain, has participated in diagnosis, treatment, and prevention of cell proliferative and autoimmune inflammatory disorders.39 The researches have found the aminoacyl-tRNA synthetases, which work in G1-arrested Chinese Hamster Ovary Cells, catalyse the attachment of the correct amino acid to its corresponding tRNA and produce aminoacyl-transfer RNA during translation of the genetic code.40,41 The increased levels of L-phenylalanine, L-isoleucine and L-methionine (Fig. 5C) indicated that their attachments to corresponding tRNA were probably perturbed by 9d through cell cycle arrest. The result was in accordance with some marketed aminoquinazolin derivatives targeting EGFR, such as gefitinib and lapatinib, which induced G1 cell cycle arrest through selective inhibitors in cancer.42–44 The cell cycle analysis was needed to confirm the above hypothesis.
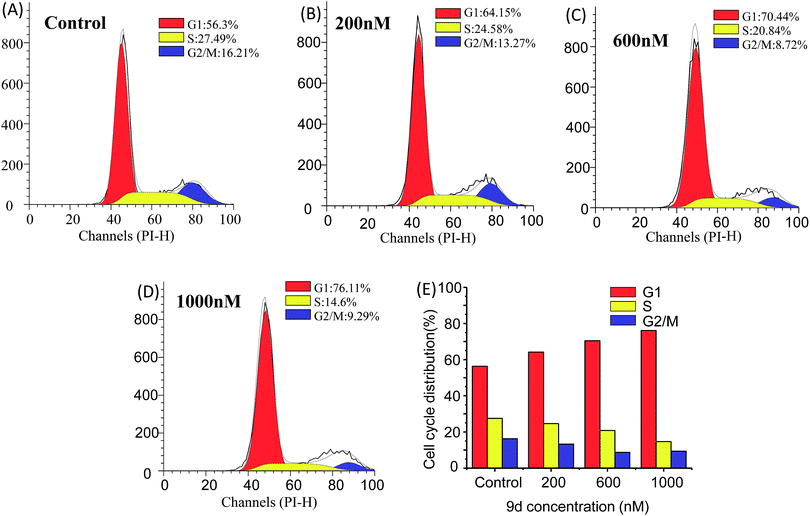
Cell cycle arrest induced by 9d
Cell cycle analysis is vital for aminoacyl-tRNA biosynthesis. Aminoacyl-tRNA is biosynthesized by tRNA synthase. Once the tRNA synthase is inhibited in cells, the p21 promoter pathway is activated to block cell cycle progression in G1 phase and inhibit tumour growth.45 To further dissect the aminoacyl-tRNA biosynthesis after 9d treatment, the cell cycle analysis was carried out according to the previous researches. Limited isoleucine in A549 cells shuted down tRNA synthesis very quickly while protein synthesis continued at a surprising rate even up to time of complete G1 arrest. As shown in Fig. 6, the cell cycle distribution was significantly changed after 9d treatment. In detail, after exposed to 200 nM of 9d for 24 h, the percentage of A549 cells at G1 stage increases from 57% to 65%. When the concentration increased from 600 nM to 1000 nM, the cell percentage at G1 stage increased from 71% to 76%. These results indicated that 9d could block A549 cells in G1 stage to inhibit cell growth or cancer progression.Considering aminoacyl-tRNA could be synthesized with related amino acid at G1 phase, so it was highly correlative that the L-phenylalanine, L-isoleucine and L-methionine were up-regulated after 9d treatment.41 The results suggested that 9d led to a noticeably increase of G1 phase fractions in cancer cells, which was in consistent with earlier reports of other aminoquinazolin derivative, such as gefitinib and lapatinib.42–44
The changes of mitochondrial membrane potential (MMP) and reactive oxygen species (ROS) induced by 9d
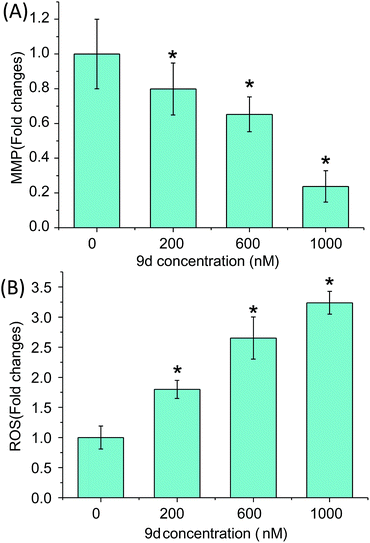
The mitochondrial function and cellular ROS level were further investigated to prove the oxidative stress and cell apoptosis triggered by 9d. Mitochondria generates most of intercellular ATP, which is involved in many tasks such as signaling, cellular differentiation, cell death, as well as maintaining the control of the cell cycle and cell growth.46 In addition, the stability of MMP is an important safeguard to prevent apoptosis and the change of MMP is an early signal of cell apoptosis. Therefore, MMP assay was carried out with a fluorescent dye Rh 123, a mitochondrion-selective stain to monitor whether mitochondria was dysfunction. After A549 cells were incubated with 0–1000 nM 9d for 24 h, MMP was descreased drastically in a dose-dependent manner (p < 0.05) (Fig. 7A). When A549 cells were treated with 200, 600 and 1000 nM of 9d, the fold changes of MMP to control cells were 0.793 ± 0.118, 0.661 ± 0.076, and 0.232 ± 0.069, respectively. The results demonstrated the function of mitochondria was greatly destroyed by 9d in A549 cells.Moreover, 9d-induced ROS was measured with a permeable fluorescence tracer, DCFH-DA, which would be oxidized to generate fluorescent DCF in the presence of ROS. After A549 cells were treated with 0–1000 nM 9d for 24 h, the fluorescence of DCF was measured. As shown in Fig. 7B, the intracellular ROS level was significantly increased with the increasing concentration of 9d (p < 0.05). ROS is the main cause of lipid peroxidation cell damage in vivo through reacting with carbohydrate, amino acid, lipid, nucleic acid, especially pyrimidine and purine of DNA in biological organisms.47 The generated GSSG and LysoPCs from GSH and PCs, and remarkable increased LPCs also indicated the oxidative stress induced by 9d. Altogether, 9d induced the oxidative stress and subsequent mitochondrial lesions and cell cycle arrest at G1 stage in A549 cells, which might in turn affect cellular metabolism, and finally lead to programmed cell death.
Conclusions
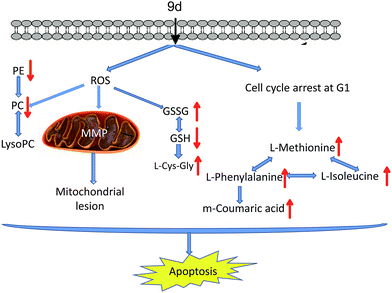
In summary, a new aminoquinazolin derivative 9d was investigated based on metabonomics to reveal the antitumor mechanism. 22 metabolites were identified through an UPLC/Q-TOF MS-based method. The possible action mechanisms and metabolic pathways were shown in Fig. 8. Based on the disturbed metabolic network, there were two possible mechanisms actions of the 9d: (1) 9d induced oxidative stress in A549 cells to produce more ROS, which then disrupted cysteine and methionine metabolism, glutathione metabolism and glycerophospholipid metabolism. The verified experiment of ROS and MMP levels proved that intracellular oxidative stress balance had been perturbed after 9d treatment. (2) L-Phenylalanine, L-isoleucine and L-methionine were identified to up-regulate in 9d-treated cancer cells, which was consistent with the cell cycle arrest at G1 stage. The result was in accordance with some marketed aminoquinazolin derivatives targeting EGFR. As a result, all these alterations in metabolism led to the cell apoptosis. These findings enhance our understanding of the action mechanism of 9d and will helpful for improvement and application of aminoquinazolin derivatives.Acknowledgements
This work was supported by the National Natural Science Foundation of China (No. 21675096 and 21475073), Shenzhen Municipal government SZSITIC (No. JCYJ20140902110354248) and Youth Scientific Research Funds from Graduate School at Shenzhen, Tsinghua University (No. QN20160002).References
- M. Goyal and D. Sasmal, J. Ethnopharmacol., 2014, 151, 536–542 CrossRef PubMed.
- R. A. Smits, M. Adami, E. P. Istyastono, O. P. Zuiderveld, C. M. E. van Dam, F. J. J. de Kanter, A. Jongejan, G. Coruzzi, R. Leurs and I. J. P. de Esch, J. Med. Chem., 2010, 53, 2390–2400 CrossRef CAS PubMed.
- R.-M. Chang, A.-G. Zeng, W. Du, X.-Y. Xu, S.-J. Zuo, C. Chang and Q. Fu, Biomed. Chromatogr., 2016, 30, 1118–1123 CrossRef CAS PubMed.
- P. Verhaeghe, N. Azas, M. Gasquet, S. Hutter, C. Ducros, M. Laget, S. Rault, P. Rathelot and P. Vanelle, Bioorg. Med. Chem. Lett., 2008, 18, 396–401 CrossRef CAS PubMed.
- J. Zhang, J. Liu, Y. Ma, D. Ren, P. Cheng, J. Zhao, F. Zhang and Y. Yao, Bioorg. Med. Chem. Lett., 2016, 26, 2273–2277 CrossRef CAS PubMed.
- I. Khan, A. Ibrar, N. Abbas and A. Saeed, Eur. J. Med. Chem., 2014, 76, 193–244 CrossRef CAS PubMed.
- W. Pao, V. Miller, M. Zakowski, J. Doherty, K. Politi, I. Sarkaria, B. Singh, R. Heelan, V. Rusch, L. Fulton, E. Mardis, D. Kupfer, R. Wilson, M. Kris and H. Varmus, Proc. Natl. Acad. Sci. U. S. A., 2004, 101, 13306–13311 CrossRef CAS PubMed.
- E. Raymond, S. Faivre and J. P. Armand, Drugs, 2000, 60, 15–23 CrossRef CAS PubMed.
- S. A. Wells Jr, B. G. Robinson, R. F. Gagel, H. Dralle, J. A. Fagin, M. Santoro, E. Baudin, R. Elisei, B. Jarzab, J. R. Vasselli, J. Read, P. Langmuir, A. J. Ryan and M. J. Schlumberger, J. Clin. Oncol., 2012, 30, 134–141 CrossRef PubMed.
- M. Bareschino, C. Schettino, T. Troiani, E. Martinelli, F. Morgillo and F. Ciardiello, Ann. Oncol., 2007, 18, vi35–vi41 CrossRef PubMed.
- W. Pao and J. Chmielecki, Nat. Rev. Cancer, 2010, 10, 760–774 CrossRef CAS PubMed.
- D. L. Wheeler, E. F. Dunn and P. M. Harari, Nat. Rev. Clin. Oncol., 2010, 7, 493–507 CrossRef CAS PubMed.
- N. E. Hynes and H. A. Lane, Nat. Rev. Cancer, 2005, 5, 341–354 CrossRef CAS PubMed.
- P. C. Chen, V. Patil, W. Guerrant, P. Green and A. K. Oyelere, Bioorg. Med. Chem., 2008, 16, 4839–4853 CrossRef CAS PubMed.
- R. S. M. Ismail, N. S. M. Ismail, S. Abuserii and D. A. Abou El Ella, Future J. Pharm. Sci., 2016, 2, 9–19 CrossRef.
- Y.-Y. Zhao, J. Liu, X.-L. Cheng, X. Bai and R.-C. Lin, Clin. Chim. Acta, 2012, 413, 642–649 CrossRef CAS PubMed.
- J. C. Lindon, E. Holmes and J. K. Nicholson, Pharm. Res., 2006, 23, 1075–1088 CrossRef CAS PubMed.
- B. Xie, T. Gong, R. Gao, J. Liu, J. Zuo, X. Wang and Z. Zhang, J. Pharm. Biomed. Anal., 2009, 49, 492–497 CrossRef CAS PubMed.
- F. Rühli, K. van Schaik and M. Henneberg, Physiology, 2016, 31, 392–397 CrossRef PubMed.
- A. Navarrete, M. P. Martínez-Alcázar, I. Durán, E. Calvo, B. Valenzuela, C. Barbas and A. García, J. Chromatogr., Biomed. Appl., 2013, 921, 35–42 CrossRef PubMed.
- Y. Tian, J. He, R. Zhang, H. Lv, S. Ma, Y. Chen, S. Yu, X. Chen, Y. Wu, W. He and Z. Abliz, Anal. Chim. Acta, 2012, 731, 60–67 CrossRef CAS PubMed.
- D. S. Wishart, Nat. Rev. Drug Discovery, 2016, 15, 473–484 CrossRef CAS PubMed.
- C. Ding, S. Chen, C. Zhang, G. Hu, W. Zhang, L. Li, Y. Z. Chen, C. Tan and Y. Jiang, Bioorg. Med. Chem., 2017, 25, 27–37 CrossRef CAS PubMed.
- D. I. Broadhurst and D. B. Kell, Metabolomics, 2006, 2, 171–196 CrossRef CAS.
- N. Gray, K. Adesina-Georgiadis, E. Chekmeneva, R. S. Plumb, I. D. Wilson and J. K. Nicholson, Anal. Chem., 2016, 88, 5742–5751 CrossRef CAS PubMed.
- R. Marin, N. Fabelo, V. Martín, P. Garcia-Esparcia, I. Ferrer, D. Quinto-Alemany and M. Díaz, Neurobiol. Aging, 2017, 49, 52–59 CrossRef CAS PubMed.
- M. Taniuchi, H. Otani, N. Kodama, Y. Tone, M. Sakagashira, Y. Yamada, M. Mune and S. Yukawa, Kidney Int., 1999, 56, S156–S158 CrossRef.
- J. H. S. Kabarowski, Y. Xu and O. N. Witte, Biochem. Pharmacol., 2002, 64, 161–167 CrossRef CAS PubMed.
- W. Gao, H.-Y. Li, S. Xiao and M.-L. Chye, Plant J., 2010, 62, 989–1003 CAS.
- V. P. Lorenzo, F. J. B. Mendonça Jr, L. Scotti and M. T. Scotti, J. Chem., 2016, 2016, 8 Search PubMed.
- S. Rose, S. Melnyk, O. Pavliv, S. Bai, T. G. Nick, R. E. Frye and S. J. James, Transl. Psychiatry, 2012, 2, e134 CrossRef CAS PubMed.
- A. R. Jones Iv, T. Meshulam, M. F. Oliveira, N. Burritt and B. E. Corkey, PLoS One, 2016, 11, e0164011 Search PubMed.
- A. Kulkarni, Y. Zeng, W. Zhou, S. Van Lanen, W. Zhang and S. Chen, Appl. Environ. Microbiol., 2016, 82, 467–477 CrossRef CAS PubMed.
- R. F. Uren, R. Howman-Giles and J. F. Thompson, J. Nucl. Med., 2003, 44, 570–582 Search PubMed.
- S. Luo and R. L. Levine, FASEB J., 2009, 23, 464–472 CrossRef CAS PubMed.
- R. J. Wurtman, F. Hefti and E. Melamed, Pharmacol. Rev., 1980, 32, 315–335 CAS.
- A. C. Neish, Phytochemistry, 1961, 1, 1–24 CrossRef CAS.
- S. Sugahara, M. Kajiki, H. Kuriyama and T. R. Kobayashi, Biol. Pharm. Bull., 2002, 25, 632–641 CAS.
- M. Ibba, A. W. Curnow and D. Söll, Trends Biochem. Sci., 1997, 22, 39–42 CrossRef CAS PubMed.
- F. L. Rock, W. Mao, A. Yaremchuk, M. Tukalo, T. Crépin, H. Zhou, Y.-K. Zhang, V. Hernandez, T. Akama, S. J. Baker, J. J. Plattner, L. Shapiro, S. A. Martinis, S. J. Benkovic, S. Cusack and M. R. K. Alley, Science, 2007, 316, 1759–1761 CrossRef CAS PubMed.
- M. D. Enger, P. O. Ritter and A. E. Hampel, Biochemistry, 1978, 17, 2435–2438 CrossRef CAS PubMed.
- A. Hirata, Cancer Res., 2005, 65, 4253–4260 CrossRef CAS PubMed.
- G. E. Konecny, M. D. Pegram, N. Venkatesan, R. Finn, G. Yang, M. Rahmeh, M. Untch, D. W. Rusnak, G. Spehar, R. J. Mullin, B. R. Keith, T. M. Gilmer, M. Berger, K. C. Podratz and D. J. Slamon, Cancer Res., 2006, 66, 1630–1639 CrossRef CAS PubMed.
- D. W. Rusnak, K. Lackey, K. Affleck, E. R. Wood, K. J. Alligood, N. Rhodes, B. R. Keith, D. M. Murray, W. B. Knight, R. J. Mullin and T. M. Gilmer, Mol. Cancer Ther., 2001, 1, 85–94 CAS.
- Y. Miyamoto, K. Machida, M. Mizunuma, Y. Emoto, N. Sato, K. Miyahara, D. Hirata, T. Usui, H. Takahashi, H. Osada and T. Miyakawa, J. Biol. Chem., 2002, 277, 28810–28814 CrossRef CAS PubMed.
- H. M. McBride, M. Neuspiel and S. Wasiak, Curr. Biol., 2006, 16, R551–R560 CrossRef CAS PubMed.
- V. I. Lushchak, Biochemistry, 2001, 66, 476–489 CAS.
| This journal is © The Royal Society of Chemistry 2017 |

