 Open Access Article
Thermal behavior and molecular mobility in the glassy state of three anti-hypertensive pharmaceutical ingredients
Joaquim J. Moura Ramos *a and
Hermínio P. Diogo
 *b
*b
aCQFM – Centro de Química-Física Molecular and IN – Institute of Nanoscience and Nanotechnology, Instituto Superior Técnico, Universidade de Lisboa, 1049-001 Lisboa, Portugal. E-mail: mouraramos@tecnico.ulisboa.pt
bCQE – Centro de Química Estrutural, Complexo I, Instituto Superior Técnico, Universidade de Lisboa, 1049-001 Lisboa, Portugal. E-mail: hdiogo@tecnico.ulisboa.pt
First published on 9th February 2017
Abstract
The slow molecular mobility in the amorphous solid state of three active pharmaceutical drugs (valsartan, telmisartan and irbesartan) has been studied using differential scanning calorimetry (DSC) and the dielectric technique of thermally stimulated depolarization currents (TSDC). The thermal behavior of the three substances (melting, glass forming ability, glass stability) and the features of their amorphous solid state (glass transition, activation energy for the structural relaxation) were studied by DSC. The TSDC study of the mobility in the glassy state yielded the main kinetic features of the α- and of the secondary relaxations. According to the obtained results the three studied glass forming drugs behave as strong liquids and telmisartan is the one with the greatest dynamic fragility.
1. Introduction
Most marketed active pharmaceutical ingredients (APIs) are sold in the solid state, and they are formed by large and complex molecules that are poorly water-soluble in their crystalline state. Therefore, increasing the bioavailability of medicines has become a major challenge for the pharmaceutical industry, and amorphization appears as a good way to improve the solubility and dissolution rate of the drugs.1–4 Indeed, the glassy state exhibits a disordered molecular arrangement that gives rise to appreciably lower packing energy compared to the crystalline form; however, it is not a state of equilibrium whereby it has instability which may, in certain cases, negate the advantages of its greater solubility: the glass ages, especially at temperatures not much lower than Tg, and can recrystallize during processing or storage. The widespread belief in a correlation between molecular mobility and the instability of the amorphous state has led to numerous studies aiming to ground this idea. They showed that cooperative mobility is associated with chemical and physical instability,5 and correlations were observed between the relaxation time of the α-relaxation and the crystallization onset time in amorphous drugs.6 Furthermore, it has been found that secondary mobility, the slow one (Johari–Goldstein)7 but also the fast one,8,9 can contribute to the instability of the amorphous solid state. The study of molecular mobility in more amorphous APIs helps to better understand the relationship between mobility and instability and to find the best processing and storage conditions to ensure greater stability. However, the vitreous state may not be the best formulation to market a drug, either because of instability problems, or because the increasingly high molecular complexity of the new drugs makes them less and less soluble in water even in the amorphous state, or because there are other ways of achieving greater bioavailability, or finally because drugs with a glass transition temperature below room temperature are not good candidates to be delivered in the pure amorphous solid form.Therefore, different strategies to improve the solubility of poorly water-soluble compounds have been developed. One of them is to deliver the drug in the form of an amorphous solid dispersion (ASD).10,11 Although most APIs are not marketed in the form of pure amorphous solid, the study of molecular mobility in the pure amorphous remains important because the relative crystallization tendency of drugs from amorphous solid dispersions seems to depend on the relative crystallization tendency of the pure substance.12 Moreover, the comparison of data on the mobility of the substance in the ASD with data on the mobility in the pure amorphous form will help to optimize the ASD design.
The present work is part of a research project developed in our laboratory on the study of the slow molecular mobility glass forming substances with pharmaceutical interest.13–16 This time the substances studied are valsartan, telmisartan and irbesartan, which are active non-peptide angiotensin II receptor antagonists used clinically for the treatment of cardiovascular diseases such as hypertension, cardiac insufficiency and cardiac arrhythmia.17–19
With differential scanning calorimetry (DSC) we will characterize the thermal behavior of the three studied substances: glass transition, melting, crystallization, glass forming ability, glass stability and tendency for crystallization on cooling from the equilibrium melt. We will also use DSC to characterize the structural relaxation of the three drugs. With TSDC we will analyze the slow molecular mobility in the amorphous solid form of the same substances.
2. Experimental
2.1. Materials
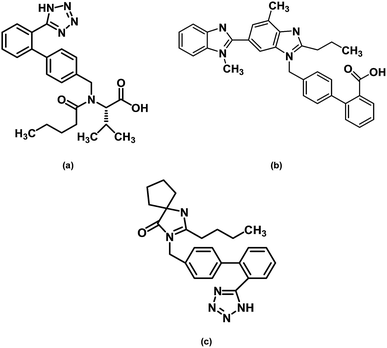
Valsartan, empirical formula C24H29N5O3 (chemical structure on Fig. 1), CAS number 137862-53-4, molecular weight Mw = 435.52 g mol−1, was purchased from TCI, lot number VU4ZL (purity > 98.0%), and was used without further purification. The DSC heat flow curve of the as received sample shows two signals occurring around 60 °C and 100 °C. The first is clearly an endothermic overshoot overlapped with a change of heat capacity, which is the signature of an aged glass; the second has the appearance of an endothermic melting peak but its location is far from the reported melting temperature and the area is too small to match the enthalpy of fusion of the whole sample (see Table 1). Furthermore, the heat flow line between the two events reported at 60 and 100 °C is far to be flat, with a series of small overlapping signals, which may reveal an amorphous state with high level of structural arrangement (polyamorphism). In fact the results obtained from DSC, temperature modulated DSC and solid state NMR measurements showed that the fresh powder sample of valsartan is amorphous, which was confirmed by X-ray powder diffractometry.20–22 Furthermore, the analysis of different valsartan samples from different suppliers (from Poland, India and China) showed that the as received samples were essentially identical.22 Valsartan crystals could only be prepared by controlling crystallization solvents and procedures,23 and the melting point and the melting enthalpy were found to be Tfus = 140 °C and ΔHfus = 43.6 kJ mol−1 (see Table 1).Telmisartan, empirical formula C33H30N4O2 (chemical structure on Fig. 1), CAS number: 144701-48-4, molecular weight: 514.62 g mol−1, was purchased from TCI, lot number 57HKO (purity > 98.0%), and was used as received. The melting temperature of the as received crystalline powder, taken as the endothermic peak's maximum, was found to be Tfus = 271.0 °C and the melting enthalpy was determined as ΔHfus = 54.2 kJ mol−1, in reasonable agreement with the published values (see Table 1).
Irbesartan, empirical formula: C25H28N6O (chemical structure on Fig. 1), CAS number: 138402-11-6, molecular weight: 428.53 g mol−1, was purchased from TCI, lot number ZEMUM (purity > 98%), and was used without further purification. The melting temperature of the as received crystalline powder was found to be Tfus = 183.0 °C (maximum of the DSC melting peak at 10 °C min−1) and the melting enthalpy ΔHfus = 38.0 kJ mol−1, which corresponds to a particular crystalline polymorph, the so-called form A. The 45.9 kJ mol−1 value reported in the literature (see Table 1) seems to be too high. Indeed, different determinations carried out on samples from two different manufacturers (TCI and Sigma-Aldrich) led to 38 kJ mol−1, for this result has our full confidence. As discussed below, it is likely that the higher enthalpy of fusion reported before corresponds to a different polymorph.
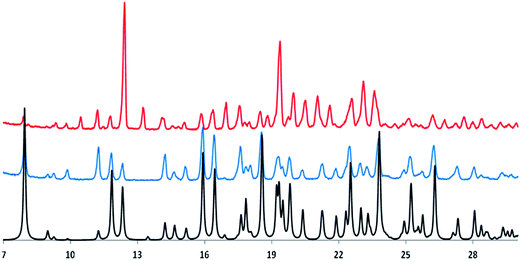
Fig. 2 shows the experimental powder X-ray diffraction patterns of the as received sample (top line, red color in the online edition, polymorph A) and of the synthetized sample (middle line, blue color in the online edition, polymorph B) together with the same pattern generated from the published X-ray crystal structure of the polymorph B of irbesartan35 (bottom line, black in the online edition).
Comparing the bottom and middle lines show that the generated pattern of polymorph B fits very well that obtained experimentally; comparison of the top and middle lines highlights the different nature of the two crystalline forms of irbesartan. The authors who published the value ΔHfus = 45.9 kJ mol−1 (see Table 1) do not provide details on the synthesis of the irbesartan sample they received as a gift, so it is very likely to be polymorph B.
2.2. Techniques
TSDC has a low equivalent frequency (∼2 × 10⁻³ Hz) so that it has a high resolution power and is sensitive to slow molecular motions (from ∼1 to 500 seconds). Furthermore, the partial polarization (PP) experimental procedure (see below) allows probing narrow regions of the TSDC spectrum, i.e. narrowly distributed motional modes. The fact that the relaxation time of the motional processes is temperature dependent, and becomes longer as temperature decreases, allows to make it exceedingly long (freezing process) compared with the timescale of the experiment. As will be seen next this is the very core of the TSDC technique, which relies on the possibility of producing stable electrets at low temperatures by cooling down to those temperatures in the presence of a polarizing electric field; a clear and concise explanation of the experimental procedures provided by the technique of thermally stimulated currents is available37 and may be useful for the reader unfamiliar with this technique.
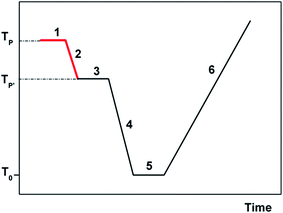
A brief explanation of the experimental protocol used in TSDC will however give the reader an easier understanding of the results presented and discussed in this paper. Two important parameters in a TSDC experiment are the polarization temperature, TP, at which the polarizing electric field is turned on, and the temperature T′P < TP at which the field is turned off (see Fig. 3). The difference TP − T′P is the width of the polarization window of the experiment.
If it is wide, the retained polarization (and of course the current peak that is the result of a TSDC experiment) will correspond to a complex set of energy distributed motional modes. Oppositely, the PP experiment where the polarizing field is applied in a narrow temperature interval, allows probing more narrowly distributed relaxation modes. In the conceptual limit of a very narrow polarization window, the experimental depolarization current peak is supposed to correspond to a single mode of relaxation.38 In the present work and in most of our previous ones we use polarization windows two degrees wide (ΔT = Tp − T′p = 2 °C). The physical foundations of the TSDC experimental technique are presented in several publications;39–41 more recent review articles indicate a variety of research applications.42–46 The treatment of the raw experimental results in order to determine the relaxation time and the kinetic parameters is explained succinctly in ref. 37.
Preparation of the amorphous solid samples for TSDC experiments. As stated above, valsartan is provided by the manufacturer in the form of an amorphous powder. For TSDC measurements a high compactness of the sample (high dipole density) is important to ensure a good signal to noise ratio. Therefore, the valsartan amorphous powder was placed on one of the metal electrodes, and the whole was heated to 130 °C (low viscosity metastable liquid), maintained at that temperature for 3 hours, and cooled down to room temperature inside an oven. The sample was thereby transformed into a transparent and colorless amorphous solid, and the sample/electrode set was then placed in the TSDC apparatus in contact with the second electrode and under helium atmosphere.
The samples of telmisartan and irbesartan in the amorphous solid state were prepared as follows. A given amount of the as received crystalline sample is placed on one of the electrodes, the whole placed in a vacuum oven, submitted to reduced pressure and heated to ∼(Tfus + 10). After ten minutes isotherm, the temperature of the oven has been lowered to room temperature, put back at normal pressure, transferred to the TSDC sample chamber in contact with the second electrode, and placed under helium atmosphere. Note that, since the natural cooling of the oven under vacuum is necessarily very slow, this procedure wherein the amorphous sample is prepared outside the TSDC chamber is only achievable if the test substance exhibits a high glass forming ability (high resistance to crystallization on cooling from the melt), which is the case for telmisartan and irbesartan.
3. Results and discussion
3.1. Particular aspects of the thermal behavior of the studied substances
| Valsartan | Telmisartan | Irbesartan | |
|---|---|---|---|
| a Determined in the present work.b Extrapolated onset temperature at 10 °C min−1, except otherwise stated.c Obtained by MTDSC.d Midpoint of the step signal.e Mean over 122 determinations.f Mean over 17 determinations.g Mean over 59 determinations. | |||
| Tgcal/°Cb | 67a; 69;20 78c,48 | 125a; 125;27 135d,29 | 69a; 69d;31 72![[thin space (1/6-em)]](https://www.rsc.org/images/entities/char_2009.gif) 32–34 32–34 |
| TgTSDC = TM/°C | 65a | 118a | 65a; 72![[thin space (1/6-em)]](https://www.rsc.org/images/entities/char_2009.gif) 31 31 |
| TgDRS | — | 127![[thin space (1/6-em)]](https://www.rsc.org/images/entities/char_2009.gif) 25 25 |
— |
| ΔCp/J K−1 g−1 | 0.42 ± 0.02a,e; 0.43;20,21 0.49![[thin space (1/6-em)]](https://www.rsc.org/images/entities/char_2009.gif) 48 48 |
0.34 ± 0.02a,f; 0.39;29 0.44![[thin space (1/6-em)]](https://www.rsc.org/images/entities/char_2009.gif) 29,49 29,49 |
0.41 ± 0.02a,g; 0.43![[thin space (1/6-em)]](https://www.rsc.org/images/entities/char_2009.gif) 31 31 |
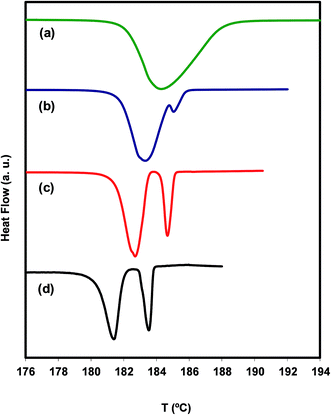
A pair of polymorphs necessarily belongs to one of two categories, called monotropic or enantiotropic.51,52 Irbesartan is supposed to have a monotropic pair of polymorphs.31 In a monotropic system no endothermic solid–solid transition is observed from the lower melting temperature form to the higher melting one. In fact, the DSC thermogram of irbesartan does not show any evidence of this transition below the melting temperature of both polymorphs. This behavior manifests itself in other ways, also observed in irbesartan, namely that the polymorph with higher melting temperature also has higher enthalpy and entropy of fusion. Comparing these thermodynamic properties for the polymorphs A and B suggests that polymorph B is thermodynamically more stable (higher melting temperature and enthalpy), while polymorph A (sample received from the manufacturer) is metastable. This means that the reaction mechanism of the chemical synthesis of irbesartan favors the formation of the metastable form A, and that, under the storage conditions (room temperature, normal pressure), there are no efficient paths to transform A into the most stable B. We found however that the transformation of A into B is possible through a mechanism that implies the melting of A followed by the cold crystallization of B. This is shown in Fig. 4 where four conventional DSC thermograms taken at different heating rates are presented.
In the heat flow line (a), at 10 °C min−1, only the melting peak of A is visible, whereas in lines (c) and (d), at 1 and 0.2 °C min−1 respectively, the melting peaks of polymorphs A and B are clearly seen. Line (b) at 2.5 °C min−1, on the other hand, only shows the melting of a small amount of B. Note that the position of the peaks is moved to higher temperatures with increasing heating rate, as it should be. The conclusion drawn from the results shown in Fig. 4 is that polymorph B forms in appreciable amounts only at very slow ramps, which suggests that the cold crystallization of irbesartan has slow kinetics. Under these conditions, it is natural for the exothermic effect of the cold crystallization to be compensated for by the endothermic effect of the simultaneous melting of A, leading to the concealment of the cold crystallization signal in the DSC thermogram.
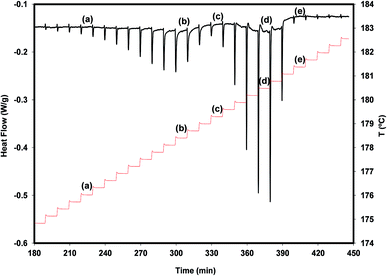
A more detailed view of what is happening during a very slow heating of the polymorph A is provided by the result of a DSC experiment carried out in the step-by-step mode (see Fig. 5).
We find from this figure that the melting of A begins at 175.7 °C (step a), shows maximum rate at 178.4 °C (step b) and finishes at about 179.3 °C (step c). The melting of B, crystallized from the melt of A during the melting process of this polymorph, occurs between step c and step e (181.4 °C) and shows maximum rate at 180.5 °C (step d). The melting processes of the two polymorphs appear as well separated, and no signal clearly attributable to the cold crystallization of B is observed. These results suggest that, in addition to being chemically feasible (process described above), the A → B transformation can also be carried out by thermal treatments.
Irbesartan showed, as valsartan, very high glass forming ability and glass stability. The glass transition of irbesartan was determined as Tg = 69 °C with ΔCp = 0.41 ± 0.02 J K−1 g−1 in reasonable agreement with the values reported in the literature (Table 2).
3.2. DSC characterization of the dynamics of the glass transition
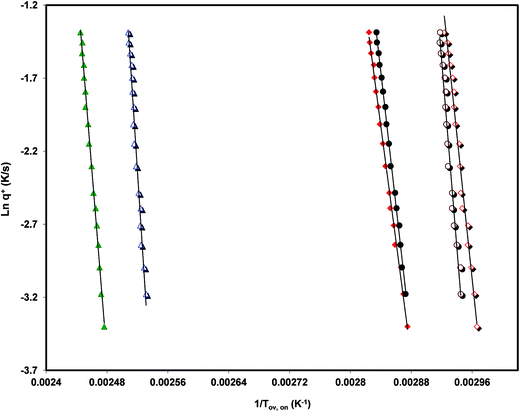
Analyzing the influence of the heating rate on the temperature location of the DSC glass transition signature allows the characterization of the kinetics of the glass transition relaxation. The basic equation to do this is:53
 | (1) |
The values of the activation energy of the structural relaxation calculated using eqn (1) for Tx = Tov and for Tx = Ton are shown in Table 3, and the dynamic fragilities, defined as58,59
 | (2) |
| Valsartan | Telmisartan | Irbesartan | |
|---|---|---|---|
| a Determined in the present work.b Estimated from the heating rate dependence of the overshoot peak temperature location, Tov.c Estimated from the heating rate dependence of the extrapolated onset temperature, Ton. | |||
| Ea(Tg)DSC/kJ mol−1 | 328a,b; 409a,c | 533a,b; 667a,c | 381a,b; 533a,c |
| mDSC | 50a,b; 63a,c | 70a,b; 88a,c | 58a,b; 82a,c |
| mTSDC | 47a | 62a | 48a |
| mDRS | — | 87![[thin space (1/6-em)]](https://www.rsc.org/images/entities/char_2009.gif) 25 25 |
— |
From the comparison of the values present in Table 3 we can see the tendency, already observed,15,16 for Ton to lead to values of mDSC higher than those obtained from Tov. We can also observe that the three drugs studied are relatively strong liquids, and that telmisartan is among them the one with a markedly superior fragility.
3.3. The molecular mobility studied by TSDC
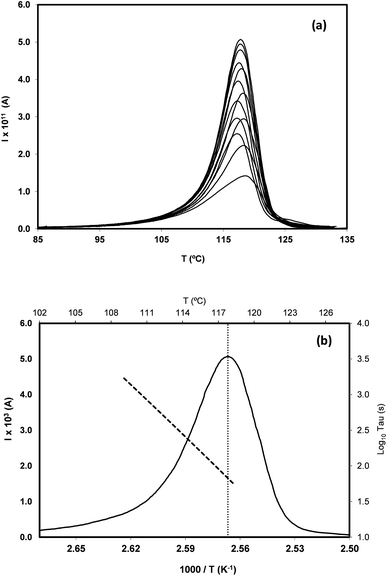
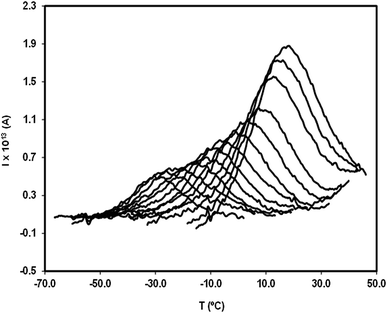
In order to study the molecular mobility by TSDC, it is first necessary to detect and localize the different relaxations in the temperature axis, which is done by scanning the temperature domain (from the lower limit of the apparatus, often ∼−150 °C, up to some degrees above Tg) using wide polarization window experiments. Series of partial polarization (PP) experiments are then carried out, which lead to the analysis of the distribution of relaxation times of the different mobilities detected in the material under study.For the peak in Fig. 7(b) we have TM = TgTSDC = 117.7 °C. The temperature dependent relaxation time, τ(T), associated to a given PP peak (i.e. to a given narrowly distributed motional mode) is obtained by a standard treatment briefly explained in Section 2 of ref. 37. Fig. 7(b) shows the log10![[thin space (1/6-em)]](https://www.rsc.org/images/entities/char_2009.gif) τ(T) versus 1/T line associated to the PP peak located at TM; it does not deviate much from linearity but this does not always happen, especially in the case of very fragile liquids in which it has a certain curvature. The adjustment of this line to a suitable equation (Arrhenius, Vogel–Fulcher–Tammann, Williams–Landel–Ferry, …) allows to obtain the kinetic parameters that characterize the motional mode. The activation energy at the maximum temperature, Tm, of the corresponding PP peak, Ea(Tm), is commonly used to kinetically characterize each partial polarization mode:
τ(T) versus 1/T line associated to the PP peak located at TM; it does not deviate much from linearity but this does not always happen, especially in the case of very fragile liquids in which it has a certain curvature. The adjustment of this line to a suitable equation (Arrhenius, Vogel–Fulcher–Tammann, Williams–Landel–Ferry, …) allows to obtain the kinetic parameters that characterize the motional mode. The activation energy at the maximum temperature, Tm, of the corresponding PP peak, Ea(Tm), is commonly used to kinetically characterize each partial polarization mode:
 | (3) |
For the PP motional mode considered in Fig. 7(b) we have Ea(TM) = Ea(Tg) = 462 kJ mol−1, so the dynamic fragility of telmisartan calculated from eqn (2) is m = 62. Using a similar procedure we obtain mTSDC = 47 and mTSDC = 48 for valsartan and irbesartan (see Table 3). Despite the relatively pronounced dispersion of the m values presented in Table 3, telmisartan is, among the three vitrifiable liquids studied, the one with the highest fragility index.
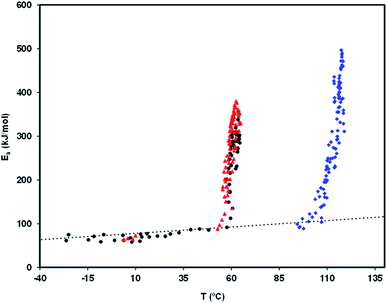
Fig. 8 is a relaxation map that displays the activation energy, Ea(Tm), of the PP motional modes as a function of their temperature location, Tm, for the different relaxations detected in the amorphous solid state of the studied drugs. The dotted line is the so-called zero activation entropy line that depicts the behavior of the local and non-cooperative relaxations (see Section 3 of ref. 37). In this figure the points in the vicinity of the zero entropy line correspond to the local movements of the secondary relaxations, whereas those that move away from it correspond to the cooperative movements of the glass transition. For a given substance, the amplitude of the deviation to the zero entropy line is proportional to its fragility index, while the temperature of the points with the greatest distance from that line is a reasonable estimate of the glass transition temperature.
Although no secondary mobility has been detected by TSDC in telmisartan, a study by dielectric relaxation spectroscopy (DRS)25 reveals its existence, and shows that it obeys the Arrhenius equation, τβ = τ∞![[thin space (1/6-em)]](https://www.rsc.org/images/entities/char_2009.gif) exp(Eβ/RT), with log10
exp(Eβ/RT), with log10![[thin space (1/6-em)]](https://www.rsc.org/images/entities/char_2009.gif) τ∞ = −15.67 and Eβ = 81.8 kJ mol−1. Based on these results, and by simple manipulation of the Arrhenius equation, it can be seen that the relaxation time τβ should have values between 10 and 500 seconds (time range in the time window of the TSDC technique) in the temperature interval between −15 and −40 °C. The fact that TSDC proves incapable of detecting any mobility in telmisartan in this temperature range probably arises from the low strength of the rotating dipoles and/or from the weak amplitude of the possible reorientational motions.
τ∞ = −15.67 and Eβ = 81.8 kJ mol−1. Based on these results, and by simple manipulation of the Arrhenius equation, it can be seen that the relaxation time τβ should have values between 10 and 500 seconds (time range in the time window of the TSDC technique) in the temperature interval between −15 and −40 °C. The fact that TSDC proves incapable of detecting any mobility in telmisartan in this temperature range probably arises from the low strength of the rotating dipoles and/or from the weak amplitude of the possible reorientational motions.
In this context, the technique of dielectric spectroscopy appears as a more sensitive tool to detect subtle reorientational movements.
4. Conclusions
The thermal behavior of valsartan, telmisartan and irbesartan, particularly their crystallization tendency on heating from the amorphous solid as well as on cooling from the equilibrium liquid, was investigated by differential scanning calorimetry. It was found that valsartan and irbesartan have very high glass forming ability and glass stability. Telmisartan revealed no tendency to crystallize upon cooling from the melt but it shows a relatively slow cold crystallization with onset at 200 °C, so that it has high glass forming ability and moderate glass stability.Irbesartan has two monotropic polymorphic forms with close melting temperatures and with significantly different enthalpies of fusion. It is known that polymorph A (commercially available, metastable) can be transformed into B chemically; we have further shown that the A → B transformation can occur through cold crystallization of B from the melt of A, in a very slow heating process.
The slow molecular mobilities in amorphous valsartan, telmisartan and irbesartan were studied by differential scanning calorimetry and thermally stimulated depolarization currents, allowing the determination of the thermodynamic and kinetic parameters of the different relaxations.
The analysis of the heating rate effect on the temperature location of the DSC glass transition step allowed the determination of the activation energy of the structural relaxation and of the steepness or fragility index of the studied amorphous drugs.
The distributions of relaxation times of the different mobilities detected in the studied amorphous solid substances were characterized by TSDC for the secondary and main relaxations. Fast secondary motions were detected in valsartan but not in telmisartan and irbesartan. The analysis of the α-relaxation provided the values of the dynamic fragility, mTSDC; the three substances behave as moderately strong glass-formers, telmisartan being the one with the highest dynamic fragility.
Acknowledgements
We thank Dr Maria de Fátima Piedade for performing the powder X-ray analysis of the irbesartan polymorphs. This work was partially supported by Fundação para a Ciência e a Tecnologia (FCT), Portugal (Projects UID/NAN/50024/2013 and UID/QUI/00100/2013).References
- B. C. Hancock, J. Pharm. Pharmacol., 2002, 54, 737–746 CrossRef CAS PubMed.
- S. B. Murdande, M. J. Pikal, R. M. Shanker and R. H. Bogner, J. Pharm. Sci., 2010, 99, 1254–1264 CrossRef CAS PubMed.
- S. B. Murdande, M. J. Pikal, R. M. Shanker and R. H. Bogner, Pharm. Res., 2010, 27, 2704–2714 CrossRef CAS PubMed.
- G. P. Johari and R. M. Shanker, Thermochim. Acta, 2014, 598, 16–27 CrossRef CAS.
- K. Kothari, V. Ragoonanan and R. Suryanarayanan, Mol. Pharm., 2014, 11, 3048–3055 CrossRef CAS PubMed.
- S. P. Bhardwaj, K. K. Arora, E. Kwong, A. Templeton, S. D. Clas and R. Suryanarayanan, Mol. Pharm., 2013, 10, 694–700 CrossRef CAS PubMed.
- S. Bhattacharya and R. Suryanarayanan, J. Pharm. Sci., 2009, 98, 2935–2953 CrossRef CAS PubMed.
- F. Paladi and M. Oguni, J. Phys.: Condens. Matter, 2003, 15, 3909–3917 CrossRef CAS.
- Y. Xu, J. F. Carpenter, M. T. Cicerone and T. W. Randolph, Soft Matter, 2013, 9, 7855–7865 RSC.
- A. Singh, Z. A. Worku and G. Van den Mooter, Expert Opin. Drug Delivery, 2011, 8, 1361–1378 CrossRef CAS PubMed.
- Y. He and C. Ho, J. Pharm. Sci., 2015, 104, 3237–3258 CrossRef CAS PubMed.
- P. J. Marsac, H. Konno and S. Taylor, Pharm. Res., 2006, 23, 2306–2316 CrossRef CAS PubMed.
- N. T. Correia, J. J. Moura Ramos, M. Descamps and G. Collins, Pharm. Res., 2001, 18, 1767–1774 CrossRef CAS.
- H. P. Diogo and J. J. Moura Ramos, J. Non-Cryst. Solids, 2015, 429, 202–207 CrossRef CAS.
- M. T. Viciosa, J. J. Moura Ramos and H. P. Diogo, J. Pharm. Sci., 2016, 105, 3573–3584 CrossRef CAS PubMed.
- J. J. Moura Ramos and H. P. Diogo, Int. J. Pharm., 2016, 501, 39–48 CrossRef PubMed.
- R. Dina and M. Jafari, Am. J. Health-Syst. Pharm., 2000, 57, 1231–1241 CAS.
- M. Volpe, Expert Rev. Cardiovasc. Ther., 2012, 10, 1061–1072 CrossRef CAS PubMed.
- H. G. Pouleur, Am. J. Hypertens., 1997, 10, 318S–324S CrossRef CAS PubMed.
- M. Skotnicki, A. Gawel, P. Cebe and M. Pyda, Drug Dev. Ind. Pharm., 2013, 39, 1508–1514 CrossRef CAS PubMed.
- M. Skotnicki, J. A. Aguilar, M. Pyda and P. Hodgkinson, Pharm. Res., 2015, 32, 414–429 CrossRef CAS PubMed.
- M. Skotnicki, D. C. Apperley, J. A. Aguilar, B. Milanowski, M. Pyda and P. Hodgkinson, Mol. Pharm., 2016, 13, 211–222 CrossRef CAS PubMed.
- J. R. Wang, X. Wang, L. Lu and X. Mei, Cryst. Growth Des., 2013, 13, 3261–3269 CAS.
- R. Saber, A. Attia and W. Salem, Adv. Pharm. Bull., 2014, 4, 283–287 CAS.
- K. Adrjanowicz, Z. Wojnarowska, P. Wlodarczyk, K. Kaminski, M. Paluch and J. Mazgalski, Eur. J. Pharm. Sci., 2009, 38, 395–404 CrossRef CAS PubMed.
- J. Isaac, S. Ganguly and A. Ghosh, Eur. J. Pharm. Biopharm., 2016, 101, 43–52 CrossRef CAS PubMed.
- P. Lepek, W. Sawicki, K. Wlodarski, Z. Wojnarowska, M. Paluch and L. Guzik, Eur. J. Pharm. Biopharm., 2013, 83, 114–121 CrossRef CAS PubMed.
- R. E. Dinnebier, P. Sieger, H. Nar, K. Shankland and W. I. F. David, J. Pharm. Sci., 2000, 89, 1465–1479 CrossRef CAS PubMed.
- R. Dukeck, P. Sieger and P. Karmwar, Eur. J. Pharm. Sci., 2013, 49, 723–731 CrossRef CAS PubMed.
- R. J. Boghra, P. C. Kothawade, V. S. Belgamwar, P. P. Nerkar, A. R. Tekade and S. J. Surana, Chem. Pharm. Bull., 2011, 59, 438–441 CrossRef CAS PubMed.
- N. Boutonnet-Fagegaltier, J. Menegotto, A. Lamure, H. Duplaa, A. Caron, C. Lacabanne and M. Bauer, J. Pharm. Sci., 2002, 91, 1548–1560 CrossRef CAS PubMed.
- G. Chawla and A. K. Bansal, Sci. Pharm., 2009, 77, 695–709 CrossRef CAS.
- G. Chawla and A. K. Bansal, Eur. J. Pharm. Sci., 2007, 32, 45–57 CrossRef CAS PubMed.
- G. Chawla and A. K. Bansal, Acta Pharm., 2008, 58, 257–274 CrossRef CAS PubMed.
- Z. Bocskei, K. Simon, R. Rao, A. Caron, C. A. Rodger and M. Bauer, Acta Crystallogr., Sect. C: Cryst. Struct. Commun., 1998, 54, 808–810 Search PubMed.
- J. J. Moura Ramos, R. Taveira-Marques and H. P. Diogo, J. Pharm. Sci., 2004, 93, 1503–1507 CrossRef PubMed.
- H. P. Diogo, M. T. Viciosa and J. J. Moura Ramos, Thermochim. Acta, 2016, 623, 29–35, DOI:10.1016/j.tca.2015.11.012.
- G. Teyssedre and C. Lacabanne, J. Phys. D: Appl. Phys., 1995, 28, 1478–1487 CrossRef CAS.
- J. van Turnhout, Thermally stimulated discharge of polymer electrets, Elsevier, Amsterdam, 1975 Search PubMed.
- R. Chen and Y. Kirsh, Analysis of Thermally Stimulated Processes, Pergamon Press, Oxford, 1981 Search PubMed.
- J. van Turnhout, Thermally stimulated discharge of electrets, in Electrets, ed. G. M. Sessler, Springer, Berlin, Heidelberg, 1987, pp. 81–215 Search PubMed.
- V. M. Gun'ko, V. I. Zarko, E. V. Goncharuk, L. S. Andriyko, V. V. Turov, Y. M. Nychiporuk, R. Leboda, J. Skubiszewska-Zieba, A. L. Gabchak, V. D. Osovskii, Y. G. Ptushinskii, G. R. Yurchenko, O. A. Mishchuk, P. P. Gorbik, P. Pissis and J. P. Blitz, Adv. Colloid Interface Sci., 2007, 131, 1–89 CrossRef PubMed.
- B. B. Sauer, Thermally Stimulated Currents: Recent Developments in Characterisation and Analysis of Polymers, in Applications to Polymers and Plastics, ed. Cheng and Z. D. Stephen, Elsevier, Amsterdam, 2002, pp. 653–711 Search PubMed.
- A. Vassilikou-Dova and I. M. Kalogeras, in Thermal Analysis of Polymers: Fundamentals and Applications, ed. J. D. Menczel and R. B. Prime, John Wiley, Hoboken, New Jersey, 2009, ch. 6, pp. 497–613 Search PubMed.
- N. Boutonnet-Fagegaltier, A. Lamure, J. Menegotto, C. Lacabanne, A. Caron, H. Duplaa, and M. Bauer, in Thermal Analysis of Pharmaceuticals, ed. D. Q. M. Craig and M. Reading, CRC Press, Boca Raton, 2007, ch. 11, pp. 359–382 Search PubMed.
- S. Barker and M. D. Antonijevic, in Solid state characterization of pharmaceuticals, ed. R. A. Storey and I. Ymén, Blackwell Publishing, Chichester, 2011, ch. 5, pp. 187–206 Search PubMed.
- C. F. Macrae, I. J. Bruno, J. A. Chisholm, P. R. Edgington, P. McCabe, E. Pidcock, L. Rodriguez-Monge, R. Taylor, J. van de Streek and P. A. Wood, J. Appl. Crystallogr., 2008, 41, 466–470 CrossRef CAS.
- N. R. Xivillé, L. T. Lorente and A. Kordikowski, Int. J. Pharm., 2012, 422, 271–279 CrossRef PubMed.
- K. Adrjanowicz, K. Grzybowska, K. Kaminski, L. Hawelek, M. Paluch and D. Zakowiecki, Philos. Mag., 2011, 91, 1926–1948 CrossRef CAS.
- A. C. Montbazin, D. Chantreux, and C. Bouloumie, Process for the preparation of a tetrazole derivative in two crystalline forms and novel the crystalline forms thereof, US Pat., 5, 629, 331, 1997.
- R. Hilfiker, Polymorphism in the pharmaceutical industry, Wiley-VCH, Weinheim, 2006 Search PubMed.
- R. A. Carlton, in Pharmaceutical microscopy, Springer, New York, 2011, ch. 8, pp. 213–246 Search PubMed.
- C. T. Moynihan, A. J. Easteal, J. Wilder and J. Tucker, J. Phys. Chem., 1974, 78, 2673–2677 CrossRef CAS.
- J. D. Menczel, L. Judovits, R. B. Prime, H. E. Bair, M. Reading and S. Swier, in Thermal Analysis of Polymers: Fundamentals and Applications, ed. J. D. Menczel, Wiley, Hoboken, New Jersey, 2009, ch. 2, pp. 7–239 Search PubMed.
- R. Svoboda and J. Málek, J. Non-Cryst. Solids, 2013, 378, 186–195 CrossRef CAS.
- R. Svoboda, J. Therm. Anal. Calorim., 2014, 118, 1721–1732 CrossRef CAS.
- K. J. Crowley and G. Zografi, Thermochim. Acta, 2001, 380, 79–93 CrossRef CAS.
- C. A. Angell, J. Non-Cryst. Solids, 1991, 131–133, 13–31 CrossRef CAS.
- R. Böhmer, K. L. Ngai, C. A. Angell and D. J. Plazek, J. Chem. Phys., 1993, 99, 4201–4209 CrossRef.
| This journal is © The Royal Society of Chemistry 2017 |

