 Open Access Article
Creative Commons Attribution 3.0 Unported Licence
Controlled porosity and pore size of nano-porous gold by thermally assisted chemical dealloying – a SAXS study†
Bao Lina,
Lingxue Konga,
Peter D. Hodgsona,
Stephen Mudieb,
Adrian Hawleyb and
Ludovic F. Dumée *a
*a
aDeakin University, Australia Institute for Frontier Materials, Waurn Ponds, Victoria 3216, Australia. E-mail: ludovic.dumee@deakin.edu.au; Tel: +61 410131312
bAustralian Synchrotron, Clayton, Victoria 3168, Australia
First published on 9th February 2017
Abstract
Nano-porous metals offer great potential for applications such as bio-sensors, chemical reactors, platforms for cell growth, and media for separation because of their high surface area and reactivity at the nanoscale. The high surface to volume ratio of nano-porous metals also offers advanced plasmonic properties which may be put to use upon refining the control over pore size distributions in the nanoscale range. Here, the impact of the solution temperature on the nature of both ligaments and pores generated across ultra-thin AuAg50 metal leaves by chemical dealloying is demonstrated for the first time. The pores were found to be controllably tuneable within a range from 30 to 54 nm in diameter after 75 min of treatment in an etching solution with a temperature between 5 and 60 °C. The kinetics of the pore formation was studied by an in situ dealloying experiment on the small angle X-ray scattering beamline at the Australian Synchrotron and specific materials properties were thereafter cross-correlated to ex situ morphological experiments. This work demonstrates a straightforward new method to refine porous structures at the nanoscale and fine-tune surface properties across nano-porous metals that will extend their applications.
1. Introduction
Nano-porous metals offer great potential for bio-sensing, chemical conversion, and catalysis.1,2 The high surface to volume ratio of nano-textured metals, whose roughness or crystallite sizes lie in the order of 10 to 50 nm, offers advanced plasmonic properties which may be harvested to generate surface responsive materials.Generating such surfaces is typically done by fabricating nano-pores across metal materials through either bottom-up or top-down strategies.1 Porous metal materials have been processed through a number of routes, including metal foaming, casting, powder sintering, metal deposition by electroplating, electro-less deposition or sputtering across pre-defined templates, nano-particle self-assembly across pre-formed removable templates, and dealloying.1 Porous metal materials exhibit excellent thermo-mechanical stability, excellent electrical properties, and outstanding resistance to abrasive materials that may be present in industrial liquid brines.1 Porous metal materials have been used across a number of industrial applications including separation membranes,3,4 conductive porous electrodes,5–9 biocompatible scaffolds,10,11 sensing,2,12–15 actuators,16 and hybrid composite materials.17,18 The pore size of the materials currently used has a limit of 100 nm and further applications could be developed if porous metal materials with finer pores could be synthesised.
Selective dealloying is one of the most promising synthesis approaches that have been trialled to date to generate pores with pore size below the 100 nm benchmark and with a high porosity. This top-down etching process was demonstrated to fabricate porous metal materials with bi-continuous pore-ligament structures.19–22 Chemical dealloying is a controlled corrosion process, naturally happening for metals exposed to environments and has been reported for a number of metal alloys,23,24 such as copper,24–27 gold,28–30 silver,31 magnesium or platinum.32,33 These materials have been extensively used to form nano-textured or nano-porous metal-based materials.28,29,34–38 De-alloyed materials were shown to exhibit a unique, smooth pore morphology, with pore size distributions from 3 nm to 5 μm (ref. 39) and porosity in the range of 20–70%.15,36,40,41 Dealloying was also successfully used for the fabrication of dual-layer porous materials,31 whereby the ligaments could be further etched through a two-step treatments. The continuous ligaments formed across the de-alloyed metal materials offer high thermal and electrical conductivities, close to those of the reference metals,42,43 as well as new plasmonic properties from the nano-texturation of the surface.13 The structure of the pores is specifically related to the composition and the microstructure, such as metal grain distribution, the number of phases, and the ratio of metal grains to boundary volume. The fabrication process from industrialized precursor alloy is therefore currently limited to typically a single pore geometry and texture. Alterations of the morphology of the materials must be undertaken through different chemical etching conditions1 and by altering parameters such as the etchant concentration or temperature.44 Although the microstructure changes during such process was previously investigated by X-ray diffraction (XRD)45 pei, the nature of the dealloying kinetics on the pore formation process are yet to be fully determined.
Here, a novel strategy is presented by thermally assisting the dealloying process during the etching of 100 nm thick AuAg50 metal leaves to yield nano-porous membranes with custom-designed porosity and morphology. The control of the bath temperature is shown to alter the kinetics of dealloying and the impact of the etching solution properties on the process and the final product properties were systematically assessed. In situ small angle X-ray scattering (SAXS) during dealloying tests were performed on the AuAg50 leaves to investigate the dealloying kinetics at a very early stage of process, and these data were correlated to the morphological and macro-properties of the materials obtained from ex situ samples. The impact of dealloying conditions will be presented and discussed to understand the kinetics of the dealloying process, opening new avenues for the design and fabrication of near 2D porous metal materials.
2. Materials and methods
2.1 Materials and chemicals
AuAg50 ultrathin (100 nm) foils were provided by the Sepp Leaf products. Nitric acid (70 wt%, supplied by Sigma-Aldrich®) was used for the etching procedure. Milli-Q water was used to prepare the etching solutions. All chemicals and metal leaves were used as received without further treatments.2.2 Characterization techniques
Scanning Electron (SE) Microscopy was performed on a Supra 55VP FEG Scanning Electron Microscope (Zeiss, Germany) at 5 keV for a 10 mm working distance. The samples directly removed from in situ flow rig were not coated prior to imaging and used as de-alloyed. The SE images of de-alloyed samples removed from in situ flow rig were analysed by ImageJ (for Windows, Ver. 1.50i, 64 bit) with the function “analyse particles”, in which the size range was 1 nm2 to infinity and the circularity was 0.00 to 1.00.Electron Back-Scatter Diffraction (EBSD) was used to generate orientation maps of the grains, performed with a Nordlys S (Oxford (HKL), UK) across the pristine metal leaves. The orientation analysis was performed at 20 keV in high current mode and analysed with the Aztec Software (Oxford, UK). The scanning area is 200 μm × 150 μm while the step size was 0.4 μm. Other parameters for EBSD scanning have not been changed and default manufacturer values were used. The original EBSD data is an orientation map which reveals directly the size, shape, and orientation of grains. Based on the orientation map, Misorientation Angle Distributions (MAD) could be obtained according to the statistics of the orientation map. Misorientation angle referred to the inter-angle of two grains which can reflect the manufacturing process of pristine materials or deformation occurred during operation or modification. The misorientation angle of neighbouring grains correlates to the mismatch of atoms on the grain boundaries which was previously shown to correlate to the electrochemical properties, and particularly here to the anti-corrosion properties of materials.46 The Pole Figure (PF) and Inverse Pole Figure (IPF) (Fig. S6†) are stereographic projections of normal direction of each grains. The standard stereographic projection47 was used to compare with the figures of stereographic projection obtained to visualize certain types of fibre textures.
Atomic Force Microscopy (AFM) maps of the pristine metal leaves were acquired on a Bruker Multimode 8 AFM in taping mode with taping tips (RTESPA, MPP-11120-10) provided by Bruker Co. (Billerica, MA, USA) at a scanning rate of 0.5 Hz.
SAXS experiments were performed at the Australian Synchrotron (AS, Melbourne, Australia) on the SAXS/WAXS beamline. The scattering patterns were analysed with Scatterbrain 2.10 (Melbourne, Australia) developed in house by the SAXS technical group at the AS following the procedures previously described.48 The detector was a Pilatus 1M (Melbourne, Australia) with a beam energy of 16 keV. Camera lengths of both 0.9 m and 7 m were used in this study. The selection of the camera length depended on the size distribution range of features of interest. For the short camera length (0.9 m), smaller features (0.9–55 nm) could be detected while the longer camera length (7 m) revealed larger features (7.5–450 nm).
2.3 In situ dealloying test on SAXS
In situ chemical DA experiments were performed with a quartz flow cells acting as a DA reactor, in which, a small area of the sample was exposed to an etching electrolyte shear flow on one side only (Fig. S1(a)†). The etching solution for these tests was 10% nitric acid (HNO3) for Au–Ag alloys. The etching solution was placed into a jacketed beaker conditioned at 30 min prior to the experiments to the target temperature which was set at 5 °C, 20 °C, 40 °C or 60 °C, respectively. The samples were attached to the flow cells with double sided Kapton® tape to seal the system and prevent liquid leakages. An extra layer of Kapton® tape was placed on the back of the sample, outside the quartz cell, to ensure that the etching solution would not leak and corrode other devices if pores were penetrating across the thickness of the sample. The samples were put vertically in order for them to be in the pathway of the X-rays and allow the detector with the etching solution side facing the beam source. Only one side of the samples was de-alloyed at a time. The energy of the beam was set at 16 keV. The acquisition of the SAXS patterns was performed every 30 s. The etching solution was pumped through the flow cell at a flow rate of 30 mL min−1. To ensure the initial stages of etching were studied, the pump was remotely started from outside the X-ray enclosure to start the DA experiment. The patterns were acquired right before the DA solution contacted the samples and were used as a background for normalization. Each sample was therefore its own reference and the physical area probed by the X-ray beam was consistently the same during each test. A schematic of the process is given in (Fig. S1(b)†).2.4 Modelling analysis
The de-alloyed porous structure is a 3-D bi-continuous structure where pores are interconnected between thin ligaments and nodes. The level of interconnectivity, however, depends on the porosity of the final material, which is directly related to the etching conditions and to the initial composition of the pristine alloy.21,49 Consistent with previous works, the SAXS patterns corresponding to intricate network structures were considered as belonging to an amorphous structure primarily due to the large polydispersity of the pores and the high roughness of the materials, both in terms of film and pore surfaces.50 A scattering vector q is introduced to replace the scattering angle, which leads to a direct relationship between the scattering vector and diffraction angle θ as shown in eqn (1).
q = 4π![[thin space (1/6-em)]](https://www.rsc.org/images/entities/char_2009.gif) sin sin![[thin space (1/6-em)]](https://www.rsc.org/images/entities/char_2009.gif) θ/λ θ/λ
| (1) |
For the normalization of the data, the typical dealloyed porous structure was considered to be a binary phase system, composed of both solid metal and liquid phases, of metal ions, hydroxides and etchant molecules. The first component therefore corresponds to the ligaments while the other one represents the pores across the materials. Although the ions in the liquid phase and density of the liquid affected the intensity of the background SAXS pattern, the metal ions, complexes or hydroxides were not found to affect the patterns, primarily due to their low concentrations (less than 0.0002 M after dealloying).51 Furthermore, the preliminary test performed with a 0.6 m camera length, presented flat curves after 0.1 Å−1 comparable with water scattering. The short camera length patterns are shown in the Fig. S2† for curiosity, in which the two clear peaks belong to the Kapton tape used to mount the samples. Thus, the impact of the dissolved ions density on the SAXS background was not included in the data analysis for the dealloying processes.
Structural modelling is required to determine the structure of the two phases from the SAXS data. However, since the two phases cannot be distinguished from each other, this binary phase system was treated as a diluted particle–solution system.52 The Porod invariant Q was introduced to correlate the scattered beam energy and volume of material V0, which was scattered from the main X-ray beam.53 In in situ dealloying process, the pore formation was regarded as the formation of a 2nd phase. However, the cavities and the formation of pores were due to the dissolution of one component from the alloy, which was primarily Ag in this work. The dissolution process, therefore, leads to the formation of a core–shell structure, where the core of the material ligaments is a gold/silver alloy, while the outer shells of the ligaments are primarily gold. A schematic of the different phases is shown in Fig. 1.
Furthermore, the pores and cavities were filled with the etching solution and metal ions. The concentration of metal ions generated from the etching of the alloy may vary during the experiment, leading to the liquid phase density changing during the experiment. However, this relatively mild variation in intensity could not be accurately evaluated by linear or one-order linear differential equation. Established models were modified to properly fit this complex multi-layer and dynamic porosity system. The scattering volume Vs was calculated through the Porod invariant Q (eqn (S1)†), where the beam spot area SB was assumed to be constant (surface of 15![[thin space (1/6-em)]](https://www.rsc.org/images/entities/char_2009.gif) 000 μm2). Therefore, the thickness of porous part (pores penetration depth) Tp was evaluated as a function of scattering volume Vs (eqn (2)), where the V0 is the probed volume of material, φs is the volume fraction of porous material.
000 μm2). Therefore, the thickness of porous part (pores penetration depth) Tp was evaluated as a function of scattering volume Vs (eqn (2)), where the V0 is the probed volume of material, φs is the volume fraction of porous material.
 | (2) |
The invariant Q can be calculated by integrating the area corresponding to the knee on the Kratky plot. The Kratky plot was obtained by plotting the scattering vector q versus the scattering intensity I(q) times q2 instead of I(q) (ESI†).
The Porod's law was used to estimate the relative surface area of spherical particles with a smooth surface.52,54 The Guinier analysis refers to the analysis of the SAXS scattering curve at very small scattering angles (see ESI† for details). The data was plotted by ln![[thin space (1/6-em)]](https://www.rsc.org/images/entities/char_2009.gif) I(q) versus q square, as Guinier plot. The slope of the Guinier plot in Guinier region is considered as the Rg.
I(q) versus q square, as Guinier plot. The slope of the Guinier plot in Guinier region is considered as the Rg.
The SAXS patterns were stimulated with Irena (Igor 6.34 64 bit) for estimating the size distribution of scattering features on samples. The de-alloyed porous structure offers a tortuous and continuous pore and ligament network distributed across the material. In this case, the projected shape of de-alloyed porous structure on SAXS is not a unified geometry but an irregular geometry with a board size distribution range. The size distribution function was used. The diameter range was pre-set into 2–3000 Å. Spheroid particle shape model was chosen for an aspect ratio of 0.1 to reflect the partial anisotropy of the ligaments/pores and a regularization method was used for fitting. The fitting range was located by two cursors, which were laid on the two sides of the main scattering knee.
3. Results and discussion
3.1 Microstructure and overall morphology of the pristine AuAg50 leaves
The AuAg50 pristine materials were commercial alloy thin foils. These foils, also called white gold due to their whitish colour, were a face-cubic centred (FCC) single-phase alloy (Fig. S3†).55 Ag and Au are completely miscible metals which can form a substitution solid solution with any mixing ratio.56 The AuAg50 foils used in this project were 100–120 nm thick and were fabricated by a conventional hammering process.32 In a typical fabrication process, small pieces of millimetre thick AuAg50 alloys were firstly hammered until reaching tens of micrometres. The deformed alloy foils were then stacked into multiple-layers separated by black paper to prevent sticking on each other and continuously hammered until reaching the thickness of ∼100 nm. The surface of the foils (Fig. S4(a)†) was found to be extremely smooth and exhibited a roughness (Ra) of about 7.3 nm, as obtained by AFM (Fig. S4(b)†).As seen across the EBSD orientation map (Fig. S5(a)†), the alloy matrix was full of large grains (φ > 10 μm) while a limited volume fraction of small grains was generated from fractured grains and transferred to the boundaries of large grains during the deformation and manufacturing. Based on the misorientation distribution (MD) data (Fig. S5(b)†), both correlated (plain) and uncorrelated (dash dot) plots are quite different from each other and also theoretical plot (random). The difference between the correlated and random distributions is due to the texture of AuAg50 ultra-thin foils while the large amount of low angle boundaries is clearly due to the cold deformation which occurred during the hammering process.
The PF (Fig. S6(a) and (b)†) shows a series of concentric rings, which refer to the fibre texture. The IPF (Fig. S6(c) and (d)†) indicated a (100) texture for the pristine foils. This result is in good correlation with the texture of pure gold leaf47 which has a strong {100} texture. The fibre texture is a representation of the microstructure whereby grains present preferential orientation rather than random orientation. In {100} texture, the normal of {100} is parallel to the force direction of the hammering, which is perpendicular to the leaf plane. In the AuAg50, most of {100} planes were parallel to each other and both the atom density and the inter-planar spacing across the thickness were found to be very similar.
3.2 Kinetics of pore formation from SAXS analysis
The impact of the solution temperature on the dealloying kinetics and on pore formation was assessed by both ex situ and in situ experiments. The temperature is acting as a dynamic parameter affecting the reaction rate rather than the equilibrium of the reaction. The Au–Ag alloy leaves present a relatively small thickness (100–120 nm) and may be completely converted into nano-porous gold within 10 min.29,32 Fig. 2 presents the SE images of de-alloyed samples (nano-porous gold) after the in situ dealloying test. The dealloying duration was the same for each sample and only the solution temperature was altered.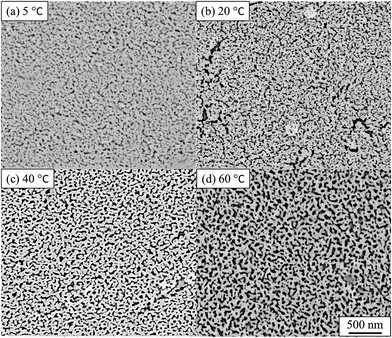 | ||
| Fig. 2 SE images of nano-porous gold after in situ SAXS dealloying tests. (a) 5 °C, (b) 20 °C, (c) 40 °C, (d) 60 °C. De-alloyed with 10% HNO3 for 4800 s. Values of pore size, ligament size and porosity are provided in Table S1.† | ||
The morphology of the pores in nano-porous gold leaves was found to be highly related to the solution temperature. Gold ligaments were formed across the materials with an average width of around 25–40 nm, varying with the temperature of the etching solution. The pores were found to be tortuous and to be present through the leaves thickness. SE images analysis found porosity of the materials raise from 22% to 31% with increased temperature of the solution. The tortuous and intricate pores of the de-alloyed gold leaves coarsened with increasing solution temperature (Fig. 3).
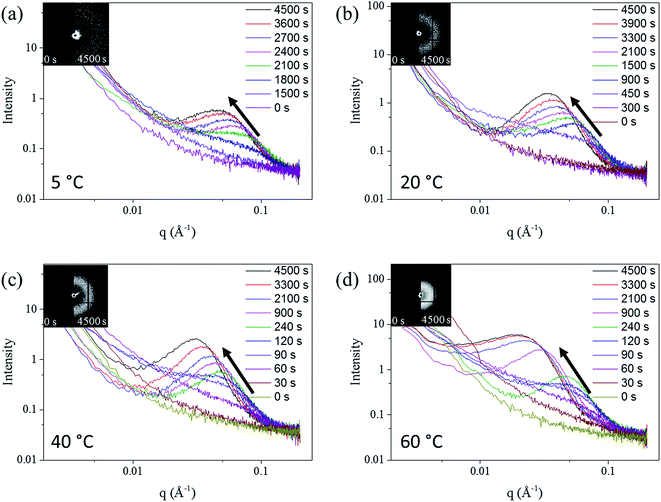
The SAXS patterns of the in situ Au–Ag de-alloyed samples are shown in Fig. 4, with the corresponding raw 2-D SAXS patterns as insets. The scattering peaks were found to become broader and higher in intensity upon dealloying progressing, while the centre of the knees shifted towards lower q ranges. This trend is well supported by previous works on the SAXS evaluation of thin film metal samples exposed to different etchant concentrations50 where similar shifts towards larger features were observed.
Three different stages, shown in Fig. S7,† were identified across the whole dealloying process. First, visible changes across the 2D SAXS data started occurring inversely proportionally with respect to temperature straight upon starting the experiments prior to stabilizing and for as long as 25 min (1500 s) at 5 °C to less than 30 s at 60 °C. In the second stage, the intensity of the curves changed dramatically leading to a pronounced shift of the scattering knee from 0.1 Å−1 to 0.08 Å−1, while the minimum q of scattering knee range increased from smaller than 0.002 Å−1 to around 0.02 Å−1 (Fig. 4). Physically, this stage may coincide with the start of the physical pitting mechanisms, whereby semi-circular pits shall appear across the surface of the samples prior to developing into porous networks.30 Although the same behaviour was clearly visible for each temperature trialled, the changes, and peak shifts particularly, appeared to be less prominent at higher solution temperature. The duration of this period spanned from more than 10 min (600 s) at 5 °C to approximately 1 min (60 s) at 60 °C. During the third phase, the scattering knee was found to strongly shift towards a lower q during the period after the transformation period, corresponding to a growth period of the ligaments and their expansion within the metal matrix. The end of this growth period was only detectable for the patterns of the 60 °C de-alloyed samples once reaching plateaued and stable scattering curves from 3300 s onwards. Such a stabilization could not be reached at lower temperatures suggesting the need for longer treatment periods due to the much slower kinetics of pore formation. Once reaching this invariant, the morphology of de-alloyed samples was stabilized and the pores coarsening was stopped (Fig. 4). A schematic example of the three periods is shown in Fig. S7.†
3.3 SAXS analysis
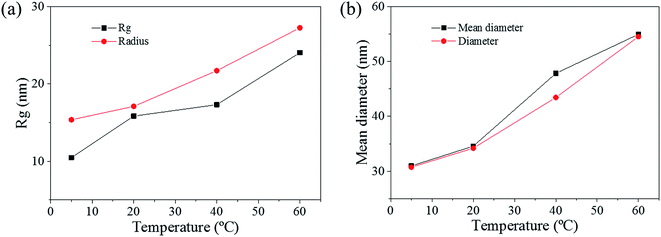
The pore size distributions across the materials were modelled with IRENA and correlated to the SE images analysis. As seen in Fig. 5a, the correlation between the measured pore dimensions and the modelled pore diameters was excellent. After 3600 s of dealloying, the value of the average pore diameter was found to increase steadily with temperature. The SAXS data was found to reach a plateau upon reaching that value of DA duration for all the temperature series and was therefore used as a representation of the steady state level of the system. The average pore dimension increased from approximately 31 nm at 5 °C to 51 at 60 °C. This aspect of the dealloying is critical since it demonstrates that the morphology of the pores may be directly altered upon modifying the environment of the sample, and the properties of the solution. It is likely that the increase in temperature affected the viscosity of the solution to a degree which reduced the diffusion of ions from the surface of the material, thus increasing concentration polarization and reducing the kinetics of pore formation. Likewise, the porosity of the materials was estimated from the SE images shown in Fig. 2. As seen in Table S1,† the measured surface porosity was lower than expected, which was likely due to the fact that several de-alloyed layers are overlapping each other on the SE images. Indeed, the intricate structure formed by the DA process, as shown in Fig. S8,† likely led to the formation of parallel ligaments/pore networks. Overall, although the surface porosity seemed to slightly increase with respect to the bath temperature, the values were found to be overall stable and in good correlation with the expected Au/Ag ratio.The size distribution of the ligaments modelled from the Guinier knee was also compared to the measured ligaments from the SE images in Fig. 2. As seen in Fig. 6 and highlighted in Fig. S9,† the ligament size distribution slightly shifted towards higher values at higher temperatures. The average ligament size varied from approximately 26.6 to 31.5 nm, between 5 and 60 °C. However, this shift was much less pronounced than the variation in pore size, supporting the fact that the microstructure of the metal materials affects the DA process and the atomic rearrangement of the materials, more than the process parameters.
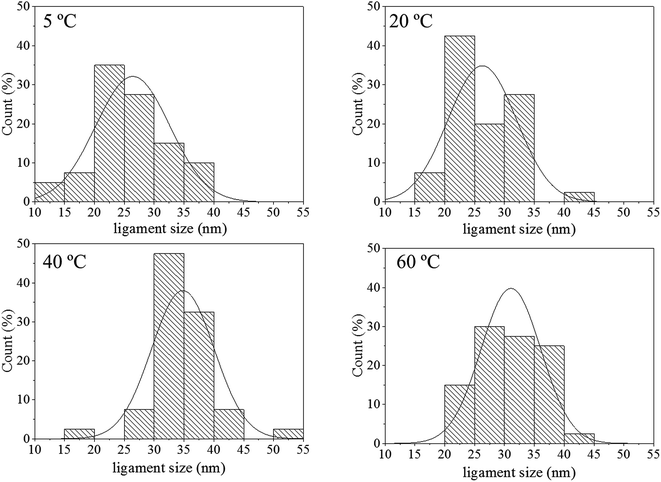 | ||
| Fig. 6 Histograms of ligament size of samples de-alloyed at 5, 20, 40 and 60 °C. The measurements were based on the analysis of the SE images shown in Fig. 2 with ImageJ. | ||
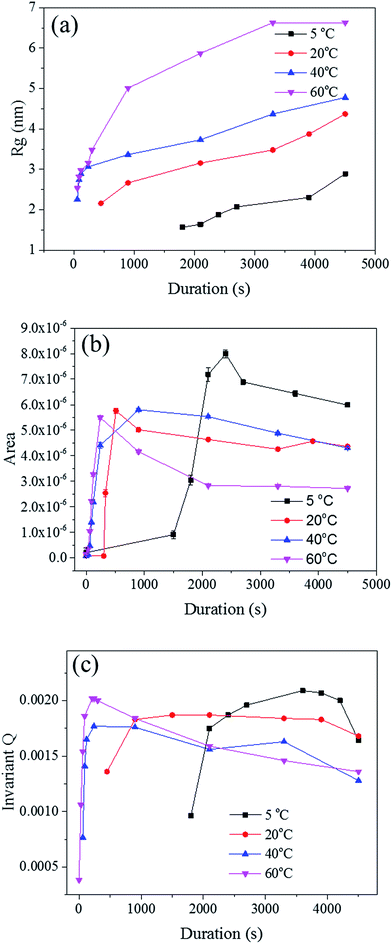
The radius of gyration (Rg) was used to calculate the particle size in a dilute solution53,57 or the precipitated phases of an alloy.58 The Rg was used to model the distributions since it can reveal the size of scattered features. As shown in Fig. 7a, the Rg increased with respect to the dealloying duration. The Rg in the second period for the samples de-alloyed at 40 °C and 60 °C increased significantly prior to plateauing upon starting the growth period, while the values of Rg between 5 °C and 20 °C increased steadily and slowly. The value of Rg of each temperature at 4500 s was 15.4 nm for 5 °C, 17.1 nm for 20 °C, 21.7 nm for 40 °C, and 27.3 nm for 60 °C, suggesting that the Rg was changing proportionally with the temperature of the dealloying solution (Fig. 5b). Although the Rg is not a physical dimension of the scattering features, it likely corresponds to the highest frequency of distances between neighbouring solid/liquid interfaces. Therefore it is utilized to express the mean size distribution of a system, here the radius of the ligaments.
In order to clarify these aspects, the Porod's law was used to estimate the specific surface area of the scatterers.53 The surface area of the material is a direct parameter highlighting the relationship between the pores and ligaments sizes. Although most models are designed for spherical particles with smooth surfaces,52 the Porod law may be used to evaluate dynamic and relative changes of the surface area across porous materials.59 The Porod region should be in the region where neither the crystalline structure of the atoms nor the nano-scale geometrical features of the pores scatter. Therefore, the low q region, before the scattering knee, could be selected as the Porod region for the in situ Au–Ag dealloying SAXS patterns. A power law function f(q) = A × q−4 was used to fit this part of the scattering curves to obtain, by regression, the surface area A, as shown in Fig. 7b. The surface area of every sample was found to increase after the second phase prior to steadily dropping upon reaching the growth period. The development of de-alloyed pores can be therefore related to two different aspects: (i) the penetration increasing over time, and (ii) the pores increasing in diameter over time. On one hand, the surface area of the material increased with the higher penetration depth while on the other hand, the surface area decreased with pore expanding radially. Therefore, the 60 °C de-alloyed samples exhibiting the largest Rg offered the lowest surface area, while the 5 °C de-alloyed sample with the smallest Rg presented the largest surface area. Although not quantitatively evaluated by the SAXS data analysis due to uncertainty with sample thickness affecting the overall intensity of the peaks, this is supporting the fact that more pores were generated at lower dealloying temperatures as visible across the SE images in Fig. 2. Relatively, the surface area of the samples de-alloyed at 20 °C and 40 °C were very close, which was perhaps due to the inhomogeneous thickness of the pristine sample or to rather similar etching mechanisms as previously stated.
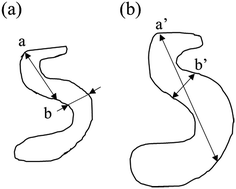
The SAXS scattering peaks of the de-alloyed porous materials are in this case not characteristic scattering peaks but broad and reasonably sharp amorphous knees. The scattering pattern is a cumulative function of the projected distances of the neighbouring solid/liquid phases. The 3-D bi-continuous de-alloyed porous structure, with tortuous and intricate pore morphologies, can therefore only scatter a broad amorphous knee rather than a sharp characteristic peak. The width of the peaks may be primarily correlated to the size distribution of the interfaces and a coarsening mechanism may occur upon dealloying due to the progressive expansion of the pores. However, other factors such as irregularities in shapes may also lead to some degree to the intensity of the edge of the peak. Although the broad nature of the scattering knee did not allow to qualitatively evaluate this later hypothesis, the SE images suggested a reasonably homogeneous pore distribution across the different temperature series, supporting the former hypothesis. The increase in the size distribution range, demonstrated from the Rg changes, revealed by the SAXS patterns, may be quicker than the increase of the real pore size, or pore volume, since the degree of tortuosity of the pores decreased with the coarsening of the pores. A schematic of the process is shown in Fig. 3, in which a and a′ correspond to the maximum size, while b and b′ to the most frequent size for such distributions. In that schematic, the most frequent size b was found to increase approximately by 30% to b′ after coarsening, while the maximum size a nearly doubled due to the tortuosity decrease.
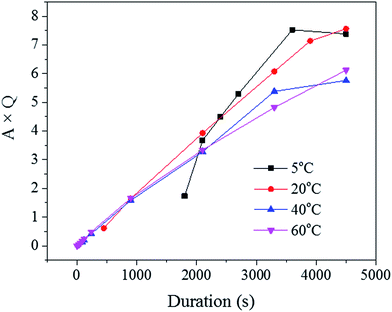
The Porod's invariant, Q, provides information about the structural volume and is independent of the scatterer geometry. This model provides valuable data on the surface of the materials and may be used to evaluate surface area. Q was plotted with a process duration in Fig. 7c. The value of the invariant Q can be divided into three sections including first a rise, then a plateau, and eventually a drop. The invariant Q of the 40 and 60 °C series was found to offer the same trend as the calculated surface area, A. The invariant Q of the 20 °C series remained initially stable for a longer duration while the plateau of the 5 °C series occurred later than the change visible for its surface area, A. The value of the invariant Q, corresponds to the total scattered energy of the beam, was integrated from the Kratky plot (ESI†). However, the de-alloyed pores in the Au–Ag system fully penetrated the 100–120 nm thick samples within minutes. Similar to the surface area of Porod's law, the total intensity of the scattered beam decreased as the area of interface decreased. The relationship between the surface area A and the invariant Q is shown in eqn (3),52 where the V0 is the probed volume of sample, φ1 and φ2 are the volume fraction of liquid and solid phases, respectively.
 | (3) |
Although the volume of Au–Ag alloy shrinks upon dealloying due to surface-induced plastic deformation of Au ligaments,34 shrinkage was not observed in the present case until the materials had been completely de-alloyed.60 The scattering interface generated during the process was therefore only induced by the de-alloyed probed materials. Thus, the liquid phase fraction φ1(t), which is a function of the DA duration in the in situ dealloying tests, was regarded as the porosity of de-alloyed AuAg50 leaves.
Since the liquid phase fraction φ1 increased with the process progressing, the solid phase fraction (1 − φ1) decreased with process progressing. Thus, the scattering volume Vs increased with process progressing. Interestingly, the slope of A × Q in Fig. 8 decreased with increasing solution temperature suggesting that the increase of liquid phase fraction is slower at low temperature while the scattering volume increased faster. This trend could be explained by the fact that the pore density was likely higher at these low temperatures, as seen across the SE images shown in Fig. 2.
4. Conclusions
In summary, the in situ dealloying test on the Au–Ag leaves at different temperatures was demonstrated for the first time. The impact of the solution temperature on the dealloying kinetics and on the morphology of metal materials was cross-correlated between SE images and SAXS data particularly. The morphology of the de-alloyed samples was found to coarsen at higher solution temperature while the dealloying process was strongly accelerated. From the modelling across the 2D SAXS data, the Rg of de-alloyed samples increased while the surface area A decreased with an increasing solution temperature. The calculation of invariant Q and A × Q suggested that the rate of porosity formation, which corresponds to the dealloying rate, was proportional to the solution temperature. The pores however formed faster and in a steadier and more stable fashion at lower temperature. This novel study and strategy open up new routes to the custom-design of nano-porous metal materials with tuneable surface areas for potential applications in surface chemical detection, separation, and catalysis.Acknowledgements
Dr Ludovic DUMEE acknowledges Deakin University for his Alfred Deakin Post-doctoral Fellowship. Mr Bao Lin acknowledges the NCEDA Perth – WA, Australia, for his PhD top-up scholarship. This research was undertaken on the SAXS/WAXS beamline at the Australian Synchrotron, Victoria, Australia on grant M8860.References
- L. F. Dumee, L. He, B. Lin, F.-M. Ailloux, J.-B. Lemoine, L. Velleman, F. She, M. C. Duke, J. D. Orbell, G. Erskine, P. D. Hodgson, S. Gray and L. Kong, J. Mater. Chem. A, 2013, 1, 15185–15206 CAS.
- Y. Ding, Y. J. Kim and J. Erlebacher, Adv. Mater., 2004, 16, 1897–1900 CrossRef CAS.
- T. A. Barr, Phys. Rev., 1952, 87, 171 Search PubMed.
- C. Combadière, W. Raoul, X. Guillonneau and F. Sennlaub, Exp. Eye Res., 2013, 111, 134–135 CrossRef PubMed.
- E. B. Buchanan and J. L. Seago, J. Electrochem. Soc., 1967, 114(6), 595–598 CrossRef CAS.
- A. L. Kawczyński, J. Phys. Chem. A, 2009, 113, 3133–3136 CrossRef PubMed.
- L. Forget, F. Wilwers, J. Delhalle and Z. Mekhalif, Appl. Surf. Sci., 2003, 205, 44–55 CrossRef CAS.
- A. Kloke, C. Köhler, R. Gerwig, R. Zengerle and S. Kerzenmacher, Adv. Mater., 2012, 24, 2916–2921 CrossRef CAS PubMed.
- J. H. Bae, J.-H. Han and T. D. Chung, Phys. Chem. Chem. Phys., 2012, 14, 448–463 RSC.
- X. Wang, Y. Li, P. D. Hodgson and C. e. Wen, Tissue Eng., Part A, 2009, 16, 309–316 CrossRef PubMed.
- F. Variola, F. Vetrone, L. Richert, P. Jedrzejowski, J.-H. Yi, S. Zalzal, S. Clair, A. Sarkissian, D. F. Perepichka, J. D. Wuest, F. Rosei and A. Nanci, Small, 2009, 5, 996–1006 CrossRef CAS PubMed.
- R. Artzi-Gerlitz, K. D. Benkstein, D. L. Lahr, J. L. Hertz, C. B. Montgomery, J. E. Bonevich, S. Semancik and M. J. Tarlov, Sens. Actuators, B, 2009, 136, 257–264 CrossRef CAS.
- L.-X. Qin, Y. Li, D.-W. Li, C. Jing, B.-Q. Chen, W. Ma, A. Heyman, O. Shoseyov, I. Willner, H. Tian and Y.-T. Long, Angew. Chem., Int. Ed., 2012, 51, 140–144 CrossRef CAS PubMed.
- M. Wirtz, M. Parker, Y. Kobayashi and C. R. Martin, Chem. Rec., 2002, 2, 259–267 CrossRef CAS PubMed.
- A. Wittstock, J. Biener and M. Bäumer, Phys. Chem. Chem. Phys., 2010, 12, 12919–12930 RSC.
- C. Li, E. T. Thostenson and T.-W. Chou, Compos. Sci. Technol., 2008, 68, 1227–1249 CrossRef CAS.
- L. J. Gibson, Annu. Rev. Mater. Sci., 2000, 30, 191–227 CrossRef CAS.
- Z. Xi, J. Zhu, H. Tang, Q. Ao, H. Zhi, J. Wang and C. Li, Materials, 2011, 4, 816–824 CrossRef.
- M. Hakamada and M. Mabuchi, J. Alloys Compd., 2009, 485, 583–587 CrossRef CAS.
- J. R. Hayes, A. M. Hodge, J. Biener, A. V. Hamza and K. Sieradzki, J. Mater. Res., 2006, 21, 2611–2616 CrossRef CAS.
- C. Zhao, Z. Qi, X. Wang and Z. Zhang, Corros. Sci., 2009, 51, 2120–2125 CrossRef CAS.
- A. Smith, T. Tran and M. Wainwright, J. Appl. Electrochem., 1999, 29, 1085–1094 CrossRef CAS.
- J. Wang, X. Jiang and S. Li, Chin. Sci. Bull., 1997, 42, 1135–1139 CAS.
- A. Gad-Allah, M. Abou-Romia, M. Badawy and H. Rehan, J. Appl. Electrochem., 1991, 21, 829–836 CrossRef CAS.
- D. Keir and M. Pryor, J. Electrochem. Soc., 1980, 127, 2138–2144 CrossRef CAS.
- Z. Zembura and M. Opyrchal, Corros. Sci., 1982, 22, 1097–1104 CrossRef CAS.
- R. Dinnappa and S. Mayanna, Corros. Sci., 1987, 27, 349–361 CrossRef CAS.
- F. Renner, A. Stierle, H. Dosch, D. Kolb, T. Lee and J. Zegenhagen, Phys. Rev. B: Condens. Matter Mater. Phys., 2008, 77, 235433 CrossRef.
- X. Lu, T. J. Balk, R. Spolenak and E. Arzt, Thin Solid Films, 2007, 515, 7122–7126 CrossRef CAS.
- J. Erlebacher, K. Sieradzki, A. Karma, N. Dimitrov and M. Aziz, Nature, 2001, 410, 450–453 CrossRef CAS PubMed.
- B. Cheung, Bachelor thesis, City University of Hong Kong, Hong Kong, 2010.
- W. Yeh and S. Chava, J. Vac. Sci. Technol., B, 2009, 27, 923–927 CAS.
- C. Xu, R. Wang, M. Chen, Y. Zhang and Y. Ding, Phys. Chem. Chem. Phys., 2010, 12, 239–246 RSC.
- S. Parida, D. Kramer, C. A. Volkert, H. Rösner, J. Erlebacher and J. Weissmüller, Phys. Rev. Lett., 2006, 97, 035504 CrossRef CAS PubMed.
- Q. Zhang, X. Wang, Z. Qi, Y. Wang and Z. Zhang, Electrochim. Acta, 2009, 54, 6190–6198 CrossRef CAS.
- J. Erlebacher, J. Electrochem. Soc., 2004, 151, C614–C626 CrossRef CAS.
- A. Barnes, N. A. Senior and R. C. Newman, Metall. Mater. Trans. A, 2009, 40, 58–68 CrossRef.
- R. Morrish, K. Dorame and A. J. Muscat, Scr. Mater., 2011, 64, 856–859 CrossRef CAS.
- Q. Chen and K. Sieradzki, J. Electrochem. Soc., 2013, 160, C226–C231 CrossRef CAS.
- R. W. Cahn, Nature, 1997, 389, 121–122 CrossRef CAS.
- D. Chang-Sheng, G. Yu, Z. Min-Lin, M. Ming-Xing, H. Ting and L. Wen-Jin, Acta Phys. Sin., 2012, 61, 094211–094218 Search PubMed.
- J. Yu, Y. Ding, C. Xu, A. Inoue, T. Sakurai and M. Chen, Chem. Mater., 2008, 20, 4548–4550 CrossRef CAS.
- Q. Yang, S. Liang, B. Han, J. Wang and R. Mao, Mater. Lett., 2012, 73, 136–138 CrossRef CAS.
- L. H. Qian and M. W. Chen, Appl. Phys. Lett., 2007, 91, 083105 CrossRef.
- S. Van Petegem, S. Brandstetter, A. M. Hodge, B. S. El-Dasher, J. Biener, B. Schmitt, C. Borca and H. Van Swygenhoven, Nano Lett., 2009, 9, 1158–1163 CrossRef CAS PubMed.
- V. Y. Gertsman and S. M. Bruemmer, Acta Mater., 2001, 49, 1589–1598 CrossRef CAS.
- K. Kitagawa, J. Mater. Sci., 1988, 23, 2810–2814 CrossRef CAS.
- L. F. Dumée, K. Sears, J. A. Schütz, N. Finn, M. Duke, S. Mudie, N. Kirby and S. Gray, J. Colloid Interface Sci., 2013, 407, 556–560 CrossRef PubMed.
- Z. Qi, C. Zhao, X. Wang, J. Lin, W. Shao, Z. Zhang and X. Bian, J. Phys. Chem. C, 2009, 113, 6694–6698 CAS.
- C. J. Dotzler, B. Ingham, B. N. Illy, K. Wallwork, M. P. Ryan and M. F. Toney, Adv. Funct. Mater., 2011, 21, 3938–3946 CrossRef CAS.
- J. M. Gallas, K. C. Littrell, S. Seifert, G. W. Zajac and P. Thiyagarajan, Biophys. J., 1999, 77, 1135–1142 CrossRef CAS PubMed.
- H. P. Fink, Acta Polym., 1989, 40, 224 CrossRef.
- O. Glatter and O. Kratky, Small angle X-ray scattering, Academic press, 1982 Search PubMed.
- M. F. Salinas-Nolasco and J. Méndez-Vivar, Langmuir, 2010, 26, 3889–3893 CrossRef CAS PubMed.
- Z. Q. Zhu, L. Yang, J. L. Nie, S. M. Peng, X. G. Long, X. S. Zhou, X. T. Zu and F. Gao, J. Alloys Compd., 2013, 557, 5–10 CrossRef CAS.
- Alloy phase diagrams, ASM International, Materials Park, Ohio, 1992, c1992 Search PubMed.
- Z. Yi, H. I. Hussain, C. Feng, D. Sun, F. She, J. E. Rookes, D. M. Cahill and L. Kong, ACS Appl. Mater. Interfaces, 2015, 7, 9937–9946 CAS.
- F. Perrard, A. Deschamps, F. Bley, P. Donnadieu and P. Maugis, J. Appl. Crystallogr., 2006, 39, 473–482 CrossRef CAS.
- T. Su, J. Lu, Z. Cui, R. Thomas and R. Heenan, Langmuir, 1998, 14, 5517–5520 CrossRef CAS.
- X.-L. Ye, N. Lu, X.-J. Li, K. Du, J. Tan and H.-J. Jin, J. Electrochem. Soc., 2014, 161, C517–C526 CrossRef.
Footnote |
| † Electronic supplementary information (ESI) available. See DOI: 10.1039/c6ra28423j |
| This journal is © The Royal Society of Chemistry 2017 |


