DOI:
10.1039/C7RA00373K
(Paper)
RSC Adv., 2017,
7, 16795-16800
Improved thermoelectric properties of SnS synthesized by chemical precipitation
Received
10th January 2017
, Accepted 28th February 2017
First published on 16th March 2017
Abstract
Sulfur compounds have been considered as potential thermoelectric materials due to recently reported high ZT values. However, the synthetic methods for these compounds are too expensive or complicated to be applied to large-scale production. Among these compounds, tin sulfide (SnS) has attracted increasing attention not only because of its extremely low thermal conductivity (below 1.0 W (m K)−1) but also its earth-abundant resources. Mechanical alloying and solvothermal method have been adopted to synthesize SnS as thermoelectric materials, but these preparation processes are either expensive or complicated. Here, a simple chemical precipitation method was developed to synthesize high-performance SnS by using analytically pure compounds as raw materials. The highest ZT value of 0.41 with a very low thermal conductivity of 0.29 W (m K)−1 and a large Seebeck coefficient of 403 μV K−1 is obtained at 848 K. The ZT value is two times higher than that of SnS samples synthesized by mechanical alloying, and our work provides a simple new method to obtain SnS with high ZT value, which will help its mass production in the future.
Introduction
The thermoelectric materials are a kind of clean power resource to deal with the environmental issues because they can convert waste heat into electricity. It is very important for countries like China, where fog and haze have become serious concerns.1–3 The efficiency of thermoelectric materials can be evaluated by the dimensionless figure of merit ZT (ZT = S2σT/(κL + κe)), where S is the Seebeck coefficient, σ is the electrical conductivity, T is the absolute temperature, κL is the lattice thermal conductivity, and κe is the electronic thermal conductivity.4–7 Though many methods have been reported to synthesize high-performance thermoelectric materials, it is still necessary and urgent to find a way to produce high-efficiency thermoelectric materials that are environmentally friendly, low-cost and with the potential of mass production.
Recently, tin selenide (SnSe) was proposed as a latent thermoelectric material due to its special two-dimensional (2D) anisotropic structure and exceptionally high anharmonic chemical bonds, which give it both high electrical performance and low thermal conductivity.1,8,9 A maximum ZT of 2.0 at 773 K is reported on sodium-doped tin selenide, which makes it a state-of-the-art thermoelectric material.9 Since the structure and chemical bonds of tin sulfide (SnS) are similar with SnSe, SnS has attracted increasing attention as a robust thermoelectric candidate.8,10 In addition, as a non-toxic binary IV-group chalcogenide semiconductor, SnS is perceived to be a promising absorption layer material for the next-generation solar cells.11 Using first-principles-based methods, Hao et al. predict the ZT values of SnS-based compounds to range from 1.3 at 300 K to 1.9 at 800 K.12 Experimentally, low thermal conductivity of below 1.0 W (m K)−1 and large Seebeck coefficient of over 400 μV K−1 are reported on SnS fabricated by the mechanical alloying approaches, and its maximum ZT is 0.16 at 823 K.10 However, the mechanical alloying method requires expensive high-purity raw materials and special equipment requirements, which run up the cost to prevent its real device manufacture.
Here, we provide a method to improve the thermoelectric properties of SnS, which would be a new way to design novel thermoelectric materials. This method is based on the chemical thermodynamics using Na2S2O3 and SnCl2 as raw materials. The minimum thermal conductivity of 0.29 W (m K)−1 is obtained at 848 K, which is one of the lowest thermal conductivities known for thermoelectric materials.3,13–15 The largest ZT value is 0.41 at 848 K, which is much higher than that of mechanically alloyed SnS materials.10
Experimental
Synthesis
SnS was synthesized though a simple chemical precipitation method. All the chemicals used in this work were of analytical grade. Tin(II) chloride (SnCl2) and sodium hyposulfide (Na2S2O3) were used as source for Sn2+ ions and S2− ions with a molar ratio of 2![[thin space (1/6-em)]](https://www.rsc.org/images/entities/char_2009.gif) :
:![[thin space (1/6-em)]](https://www.rsc.org/images/entities/char_2009.gif) 1, and the synthesis of SnS precursor was carried out in atmosphere. For deposition, 1 M SnCl2 was mixed with 0.3 M ethylenediaminetetraacetic acid (EDTA) and 48 g L−1 triethanolamine (TEA) with vigorous stirring. 1 M Na2S2O3 was dissolved in deionized water, then 20 g L−1 ammonia (NH3·H2O) and 1 M Na2S2O3 solution were successively added into the SnCl2 one under magnetic stirring for 20 minutes. The colorless solution slowly turned dark brown, indicating the formation of SnS precursor. The product was then separated from the mixed solution by filtering and washed with deionized water and alcohol several times, and dried in vacuum at 333 K for 12 hours. The powders were followed by annealing treatment for 4 hours, with different temperatures to improve the grain structure, and the heating rate of 5 K s−1. According to the binary phase diagrams of SnS, there is a solid-state phase transition at 875 K for SnS.16 Therefore, the annealing temperatures were set to 873 K, 923 K, and 973 K. Then, the three types of powders were loaded into three graphite dies respectively, and the bulk samples were prepared by a homemade hot-pressing machine at 853 K under 75 MPa in vacuum for 6 minutes.
1, and the synthesis of SnS precursor was carried out in atmosphere. For deposition, 1 M SnCl2 was mixed with 0.3 M ethylenediaminetetraacetic acid (EDTA) and 48 g L−1 triethanolamine (TEA) with vigorous stirring. 1 M Na2S2O3 was dissolved in deionized water, then 20 g L−1 ammonia (NH3·H2O) and 1 M Na2S2O3 solution were successively added into the SnCl2 one under magnetic stirring for 20 minutes. The colorless solution slowly turned dark brown, indicating the formation of SnS precursor. The product was then separated from the mixed solution by filtering and washed with deionized water and alcohol several times, and dried in vacuum at 333 K for 12 hours. The powders were followed by annealing treatment for 4 hours, with different temperatures to improve the grain structure, and the heating rate of 5 K s−1. According to the binary phase diagrams of SnS, there is a solid-state phase transition at 875 K for SnS.16 Therefore, the annealing temperatures were set to 873 K, 923 K, and 973 K. Then, the three types of powders were loaded into three graphite dies respectively, and the bulk samples were prepared by a homemade hot-pressing machine at 853 K under 75 MPa in vacuum for 6 minutes.
Characterizations
The SnS powders prepared by the chemical precipitation method and annealed at different temperatures were characterized by X-ray diffraction (XRD) with Cu Kα radiation at room temperature. For bulk samples, structural and morphological characterization were addressed by scanning electron microscopy (SEM) at room temperature, and thermoelectric properties such as electrical conductivities, Seebeck coefficients, and thermal conductivities were determined at various temperatures in the range of 303 K to 848 K. The electrical conductivity (σ) and Seebeck coefficient (S) were determined using Netzsch SBA458. The thermal conductivities (κ) were calculated using the relationship κ = αρCp, where Cp is the specific heat capacity, α is the thermal diffusivity, and ρ is the density. Both Cp and α were measured by Netzsch LFA457, in which the reference sample is Pyroceram 9606, and ρ was measured using the Archimedes method. Room-temperature Hall resistances (RH) of bulk samples were measured using Ecopia AMP55. The hole mobility (μH) and carrier concentration (p) were calculated from μH = σ/pe and p = 1/eRH, where e is the elementary charge. The Gruneisen parameter (γ) of SnS was calculated using the formula γ = (3(1 + vp))/(2(2 − 3vp)), where vp = (1 − 2(vs/vl)2)/(2 − 2(vs/vl)2). The longitudinal (vl) and transverse (vs) sound velocities were measured using an ultrasonic instrument (Ultrasonic Pulser/Receiver Model 5058 PR, Olympus, USA).
Results and discussion
Effects of annealing temperatures on the microstructures
SnS undergoes a second-order phase transition from the orthorhombic structure (α-phase) to tetragonal phase (β-phase) at 858 K. Each Sn atom is surrounded by three S atoms and there are nearly 90° for every bond. The atoms in each layer are connected by covalent bonds. The bonding forces between the layers are weak and mainly composed of long Sn–S interactions.17–20 For the deposition of SnS, Sn2+ ions complexed with EDTA and TEA were allowed to react with S2− ions, generated by decomposition of Na2S2O3. TEA acted as a kind of complexing agent, and we have observed that the quantities of TEA and NH3 (aq) were very critical to obtaining good-quality SnS powders. The deposition of the SnS powders is thought to follow the reaction suggested below:| | |
[Sn(A)n]2+ → Sn2+ + nA
| (1) |
| | |
Na2S2O3 + 2OH− → Na2SO4 + S2− + H2O
| (2) |
where A is EDTA.21–24
Fig. 1(a) shows X-ray diffraction (XRD) patterns of SnS precursor and SnS powders by annealing treatment at 873 K, 923 K and 973 K. All major Bragg peaks can be indexed as orthorhombic phase SnS (PDF#39-0354) as shown at the bottom of Fig. 1, indicating that single-phase powders were successfully synthesized by the chemical precipitation method. The peak intensity of SnS powders annealed at 923 K is the strongest one, indicating that the crystallinity of this sample is greater than that of others. Impurity phases appeared in the powders annealed at 873 K. It is believed that a kind of substance volatilizes into sulfur, and the following two chemical reactions, shown in eqn (4) and (5), occurred at 873 K.10 This phenomenon also appears in all bulk samples, which may be caused by the high pressure and temperature during the hot-pressing process. The obvious difference between the strongest peaks in bulk samples parallel to the pressing direction and in bulk samples perpendicular to the pressing direction indicates the existence of anisotropy, which agrees with the thermoelectric properties in the following discussion.
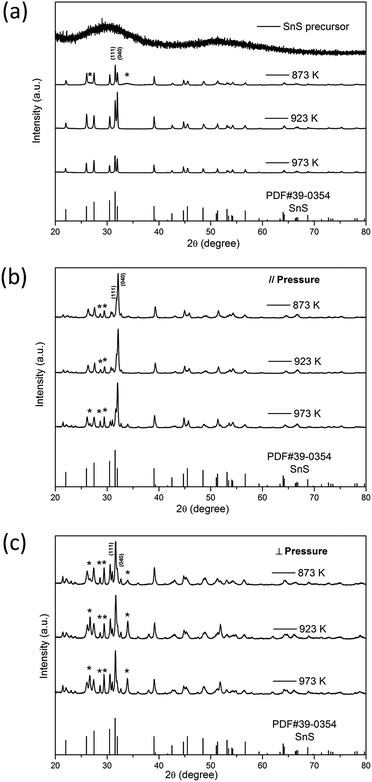 |
| | Fig. 1 X-ray diffraction patterns of (a) SnS powders; (b) bulk samples parallel to the pressing direction; (c) bulk samples perpendicular to the pressing direction at different annealing temperatures (873 K, 923 K, 973 K). Asterisked peaks correspond to impurity phase Sn2S3 or Sn3S4. SnS precursor is the SnS powders without annealing. | |
Fractural SEM analysis of SnS powder samples and SnS bulk samples are shown in Fig. 2, in which 873 K, 923 K and 973 K are the annealing temperature of various SnS powders (designated as 873 K, 923 K, and 973 K powders in the following discussion for simplicity), which were used to synthesize different bulk samples. Fig. 2(a) shows the SEM images of SnS precursor samples, and samples are made up of SnS particles with different sizes. As shown in Fig. 2(b), the sample synthesized with 873 K powders is composed of a large number of micro-particles with grain sizes of ∼3 μm. But Fig. 2(c) shows that the sample synthesized with 923 K powders comprises a large number of tightly stacked nanosheets with diameters of ∼2 μm and thickness of about tens of nanometers. When the annealing temperature increases to 973 K, the diameter of nanosheets increases sharply from ∼2 μm to ∼20 μm, and the sample exhibits an obvious lamellar structure with different lamination directions, as shown in Fig. 2(d). The structural and morphological characterization of bulk samples vary from each other as annealing temperature changes, which exerts an important influence on the thermoelectric performance of samples, as is shown in the following discussion.
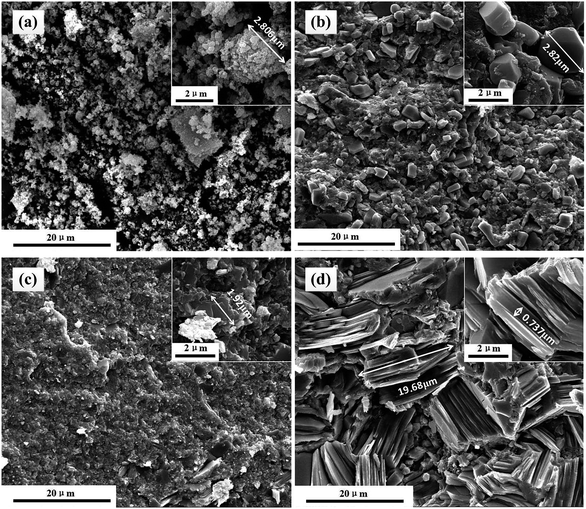 |
| | Fig. 2 SEM images of unannealed SnS powder samples and SnS bulk samples using the powders obtained from annealing at different temperatures: (a) SnS precursor, (b) 873 K, (c) 923 K, and (d) 973 K. | |
Effects of the annealing temperature on the Seebeck coefficients and electrical transport properties
The temperature dependence of the electrical conductivity of SnS bulk samples along parallel (∥) and perpendicular (⊥) directions to the pressing direction is shown in Fig. 3(a) and (b). The electrical conductivities of all samples increase with increasing temperature, consistent with the typical semiconducting behavior. Moreover, the electrical conductivities exhibit three stages of increase. But there is a slow stage of increase during 500–650 K, and when the temperature is over 650 K, the electrical conductivity increases rapidly. This is probably because of the bipolar effect, which is consistent with the temperature dependence of the Seebeck coefficient, as shown in Fig. 3(b). Table 1 lists the results of room-temperature Hall effect measurement of the bulk sample parallel to the pressing direction synthesized with 923 K powders. Considering the ultra-low carrier concentration of SnS sample exhibited in Table 1, it is reasonable that the bipolar like effect of SnS occurs at a relatively low temperature of about 650 K, though the band gap of SnS is over 1 eV.25
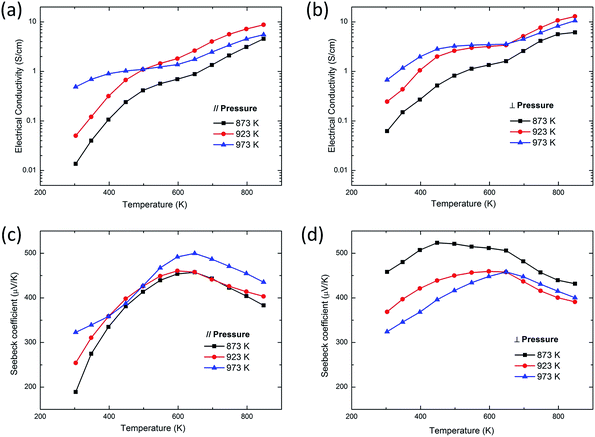 |
| | Fig. 3 Temperature dependence of (a) the electrical conductivity ∥ to the pressing direction, (b) the electrical conductivity ⊥ to the pressing direction, (c) the Seebeck coefficient ∥ to the pressing direction, (d) the Seebeck coefficient ⊥ to the pressing direction of SnS bulk samples using the powders at different annealing temperatures. | |
Table 1 The carrier concentration, mobility and density of SnS bulk sample parallel to the pressing direction using 923 K powder
| Annealing temperature |
nH, cm−3 |
μ, cm2 V−1 s−1 |
Density, g cm−3 |
| 923 K |
6.26 × 10¹⁷ |
0.50 |
4.637 |
The Seebeck coefficients of all samples are shown in Fig. 3(b). The Seebeck coefficients of all samples increase with the increasing measured temperature when the temperature is below 650 K. This tendency is the same as that of electrical conductivities, showing that the increase of electrical conductivities in the temperature range of 300 K to 650 K probably comes from the enhancement of carrier mobility but not from the increase of carrier concentration because the latter may cause the decrease of Seebeck coefficients. Then, the Seebeck coefficients of all samples decrease abruptly when keeping the measured temperature increase over 650 K, resulting from the bipolar-like effect. All samples show large Seebeck coefficients over 189 μV K−1, and the maximum can be as high as about 500 μV K−1. The difference between Seebeck coefficients along those two directions may be caused by the anisotropy of SnS. Furthermore, the bulk samples parallel to the pressing direction synthesized with 973 K powders possess higher electrical conductivities and larger Seebeck coefficients than those of the other two samples in the temperature below 500 K. The sample synthesized with 873 K powders has the worst performance in the entire temperature range. This phenomenon may be related to the various grain sizes of different samples, as Fig. 1 shows.
Effects of annealing temperature on the thermal conductivity
The thermal conductivity along these two directions shows a greater difference, which is different from electrical transport properties and Seebeck coefficients. The thermal conductivities parallel to the pressing direction are quite low, as shown in Fig. 4(a). The thermal conductivity of bulk samples perpendicular to the pressing direction shows an abrupt increase at 600 K, which could be caused by impurity phase Sn2S3 or Sn3S4. The thermal conductivity is the sum of the electronic thermal conductivity (κe) and the lattice thermal conductivity (κL), so κL can be obtained indirectly from κL = κtotal − κe, in which κe is roughly calculated from electrical conductivity according to the Wiedemann–Franz law κe = LσT (L = 2.45 × 10⁻⁸ WΩK−2, Lorenz number).26–28 The electronic thermal conductivity is very low because of the extremely low electrical conductivity, and the lattice thermal conductivity plays a dominant role in the overall thermal conductivity, as shown in Fig. 4. The lattice thermal conductivity of SnS decreases with the increasing temperature, which arise from the increased phonon–phonon scattering. As a result, the total thermal conductivity exhibits a monotonic decreasing tendency with increasing temperature.
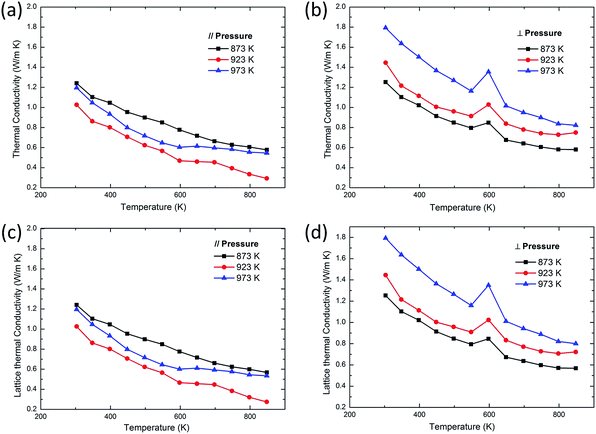 |
| | Fig. 4 Temperature dependence of (a) the thermal conductivity ∥ to the pressing direction, (b) the thermal conductivity ⊥ to the pressing direction, (c) the lattice thermal conductivity ∥ to the pressing direction, (d) the lattice thermal conductivity ⊥ to the pressing direction of SnS bulk samples using the powders at different annealing temperatures. | |
There are two main reasons for the low thermal conductivity of SnS: the anharmonic bonding and the small grain size. The layered structure of SnSe features anomalously high Gruneisen parameters, reflecting the anharmonic and anisotropic bonding.8 Like SnSe, layered SnS exhibits an enhanced anharmonic effect, and its Gruneisen parameter is determined to be 1.38 for the 923 K annealed sample parallel to the pressing direction, a relatively high value compared with that of other thermoelectric materials.29,30 Moreover, Fig. 4(a) shows that the sample synthesized with 923 K powder has the lowest thermal conductivity among others, probably because it consists of a large number of very thin and small SnS nanosheets that enhance the phonon scattering. The minimum thermal conductivity is 0.29 W (m K)−1 at 848 K, comparable to the lowest value of SnSe.
Effects of annealing temperature on ZT
The ZT values of SnS at different temperatures along different directions are shown in Fig. 5. The bulk sample parallel to the pressing direction synthesized with 923 K powder exhibits the highest ZT value among the other samples. ZT curves of all samples show a significant upward trend at temperatures above 550 K, especially for the 923 K parallel to the pressing direction bulk sample, increasing from 0.03 at 548 K to 0.41 at 848 K, as shown in Fig. 5(a). This dramatic increase is due to the sharp increase in the electrical conductivity and the continuous decrease in the thermal conductivity. The very low thermal conductivity of 0.29 W (m K)−1, combined with a large Seebeck coefficient of 403 μV K−1, leads to a high ZT of 0.41 at 848 K. The present ZT is impressive among p-type metal sulfides given the fact that SnS is a wide-bandgap compound. In fact, SnS exhibits the highest ZT value among p-type materials with bandgaps above 1.0 eV.25 The work on SnS doping shows that proper doping can greatly improve the power factor of SnS and reduce the thermal conductivity, so further improvement of thermoelectric properties of SnS can be expected by proper doping based on this work.
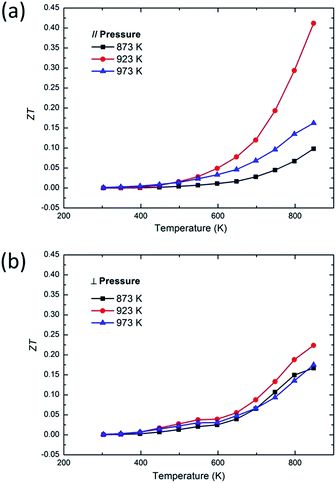 |
| | Fig. 5 Temperature dependence of (a) ZT ∥ to the pressing direction, (b) ZT ⊥ to the pressing direction of SnS bulk samples using the powders with different annealed temperatures. | |
Conclusions
High-performance tin sulfide (SnS) as thermoelectric material were synthesized by a new chemical precipitation method using low-cost and environmentally friendly raw materials. The experimental results show that thermoelectric properties of SnS bulk samples can be adjusted by changing the annealing temperature of SnS powders. The highest ZT value of 0.41 with a very low thermal conductivity of 0.29 W (m K)−1 and a large Seebeck coefficient of 403 μV K−1 are observed at 848 K on the bulk samples parallel to the pressing direction that were synthesized with 923 K powders. The ZT value is two times higher than that of SnS samples prepared by mechanical alloying, indicating that high-performance SnS thermoelectric material can be synthesized using the inexpensive, simple and convenient chemical method. Moreover, the work on SnS doping indicates that further improvements of thermoelectric performance of SnS can be expected by proper doping based on this work.25
Acknowledgements
This work was supported by the National Natural Science Foundation of China under No. 51672037 and No. 61604031, the Department of Science and Technology of Sichuan Province under No. 2015JY0066, 2014GZ0151 and 2016JQ0022, the Fundamental Research Funds for the Central Universities under No. ZYGX2013J115, ZYGX2014J087 and ZYGX2015J029, the open fund of State Key Laboratory of Advanced Welding and Joining of HIT (No. AWJ-M16-07).
Notes and references
- X. Zhang and L.-D. Zhao, J. Materiomics, 2015, 1, 92–105 CrossRef.
- L. E. Bell, Science, 2008, 321, 1457–1461 CrossRef CAS PubMed.
- G. J. Snyder and E. S. Toberer, Nat. Mater., 2008, 7, 105–114 CrossRef CAS PubMed.
- Z.-G. Chen, G. Han, L. Yang, L. Cheng and J. Zou, Prog. Nat. Sci.: Mater. Int., 2012, 22, 535–549 CrossRef.
- P. Sundarraj, D. Maity, S. S. Roy and R. A. Taylor, RSC Adv., 2014, 4, 46860–46874 RSC.
- M. Rull-Bravo, A. Moure, J. Fernandez and M. Martin-Gonzalez, RSC Adv., 2015, 5, 41653–41667 RSC.
- Z. Liu, H. Geng, J. Mao, J. Shuai, R. He, C. Wang, W. Cai, J. Sui and Z. Ren, J. Mater. Chem. A, 2016, 4, 16834–16840 CAS.
- L.-D. Zhao, S.-H. Lo, Y. Zhang, H. Sun, G. Tan, C. Uher, C. Wolverton, V. P. Dravid and M. G. Kanatzidis, Nature, 2014, 508, 373–377 CrossRef CAS PubMed.
- L.-D. Zhao, G. Tan, S. Hao, J. He, Y. Pei, H. Chi, H. Wang, S. Gong, H. Xu and V. P. Dravid, Science, 2016, 351, 141–144 CrossRef CAS PubMed.
- Q. Tan and J.-F. Li, J. Electron. Mater., 2014, 43, 2435–2439 CrossRef CAS.
- M. Gunasekaran and M. Ichimura, Sol. Energy Mater. Sol. Cells, 2007, 91, 774–778 CrossRef CAS.
- S. Hao, V. P. Dravid, M. G. Kanatzidis and C. Wolverton, APL Mater., 2016, 4, 104505 CrossRef.
- M. S. Dresselhaus, G. Chen, M. Y. Tang, R. Yang, H. Lee, D. Wang, Z. Ren, J. P. Fleurial and P. Gogna, Adv. Mater., 2007, 19, 1043–1053 CrossRef CAS.
- K. Biswas, J. He, I. D. Blum, C.-I. Wu, T. P. Hogan, D. N. Seidman, V. P. Dravid and M. G. Kanatzidis, Nature, 2012, 489, 414–418 CrossRef CAS PubMed.
- L.-D. Zhao, V. P. Dravid and M. G. Kanatzidis, Energy Environ. Sci., 2014, 7, 251–268 CAS.
- R. Sharma and Y. Chang, J. Phase Equilib., 1986, 7, 269–273 CAS.
- A. Ettema, R. De Groot, C. Haas and T. Turner, Phys. Rev. B: Condens. Matter Mater. Phys., 1992, 46, 7363 CrossRef CAS.
- T. Chattopadhyay, A. Werner, H. Von Schnering and J. Pannetier, Rev. Phys. Appl., 1984, 19, 807–813 CrossRef CAS.
- T. Chattopadhyay, J. Pannetier and H. Von Schnering, J. Phys. Chem. Solids, 1986, 47, 879–885 CrossRef CAS.
- W. Albers, C. Haas, H. Vink and J. Wasscher, J. Appl. Phys., 1961, 32, 2220–2225 CrossRef CAS.
- M. Nair and P. Nair, Semicond. Sci. Technol., 1991, 6, 132 CrossRef CAS.
- E. Guneri, C. Ulutas, F. Kirmizigul, G. Altindemir, F. Gode and C. Gumus, Appl. Surf. Sci., 2010, 257, 1189–1195 CrossRef CAS.
- R. Mane and C. Lokhande, Mater. Chem. Phys., 2000, 65, 1–31 CrossRef CAS.
- S. Sohila, M. Rajalakshmi, C. Ghosh, A. Arora and C. Muthamizhchelvan, J. Alloys Compd., 2011, 509, 5843–5847 CrossRef CAS.
- Q. Tan, L.-D. Zhao, J.-F. Li, C.-F. Wu, T.-R. Wei, Z.-B. Xing and M. G. Kanatzidis, J. Mater. Chem. A, 2014, 2, 17302–17306 CAS.
- Y.-L. Pei, J. He, J.-F. Li, F. Li, Q. Liu, W. Pan, C. Barreteau, D. Berardan, N. Dragoe and L.-D. Zhao, NPG Asia Mater., 2013, 5, e47 CrossRef CAS.
- G.-K. Ren, J.-l. Lan, S. Butt, K. J. Ventura, Y.-H. Lin and C.-W. Nan, RSC Adv., 2015, 5, 69878–69885 RSC.
- C. Chang, Q. Tan, Y. Pei, Y. Xiao, X. Zhang, Y.-X. Chen, L. Zheng, S. Gong, J.-F. Li, J. He and L.-D. Zhao, RSC Adv., 2016, 6, 98216–98220 RSC.
- E. S. Toberer, A. Zevalkink and G. J. Snyder, J. Mater. Chem., 2011, 21, 15843–15852 RSC.
- J. Shuai, H. Geng, Y. Lan, Z. Zhu, C. Wang, Z. Liu, J. Bao, C.-W. Chu, J. Sui and Z. Ren, Proc. Natl. Acad. Sci. U. S. A., 2016, 113, E4125–E4132 CrossRef CAS PubMed.
Footnote |
| † These authors contributed equally to this work. |
|
| This journal is © The Royal Society of Chemistry 2017 |
Click here to see how this site uses Cookies. View our privacy policy here.  Open Access Article
 *,
Yide Chen†,
Jing Jiang†,
Rui Zhang,
Yi Niu,
Ting Zhou,
Junfeng Xia,
Hanqing Tian,
Jun Hu and
Ping Yang*
![[thin space (1/6-em)]](https://www.rsc.org/images/entities/char_2009.gif) :
:![[thin space (1/6-em)]](https://www.rsc.org/images/entities/char_2009.gif) 1, and the synthesis of SnS precursor was carried out in atmosphere. For deposition, 1 M SnCl2 was mixed with 0.3 M ethylenediaminetetraacetic acid (EDTA) and 48 g L−1 triethanolamine (TEA) with vigorous stirring. 1 M Na2S2O3 was dissolved in deionized water, then 20 g L−1 ammonia (NH3·H2O) and 1 M Na2S2O3 solution were successively added into the SnCl2 one under magnetic stirring for 20 minutes. The colorless solution slowly turned dark brown, indicating the formation of SnS precursor. The product was then separated from the mixed solution by filtering and washed with deionized water and alcohol several times, and dried in vacuum at 333 K for 12 hours. The powders were followed by annealing treatment for 4 hours, with different temperatures to improve the grain structure, and the heating rate of 5 K s−1. According to the binary phase diagrams of SnS, there is a solid-state phase transition at 875 K for SnS.16 Therefore, the annealing temperatures were set to 873 K, 923 K, and 973 K. Then, the three types of powders were loaded into three graphite dies respectively, and the bulk samples were prepared by a homemade hot-pressing machine at 853 K under 75 MPa in vacuum for 6 minutes.
1, and the synthesis of SnS precursor was carried out in atmosphere. For deposition, 1 M SnCl2 was mixed with 0.3 M ethylenediaminetetraacetic acid (EDTA) and 48 g L−1 triethanolamine (TEA) with vigorous stirring. 1 M Na2S2O3 was dissolved in deionized water, then 20 g L−1 ammonia (NH3·H2O) and 1 M Na2S2O3 solution were successively added into the SnCl2 one under magnetic stirring for 20 minutes. The colorless solution slowly turned dark brown, indicating the formation of SnS precursor. The product was then separated from the mixed solution by filtering and washed with deionized water and alcohol several times, and dried in vacuum at 333 K for 12 hours. The powders were followed by annealing treatment for 4 hours, with different temperatures to improve the grain structure, and the heating rate of 5 K s−1. According to the binary phase diagrams of SnS, there is a solid-state phase transition at 875 K for SnS.16 Therefore, the annealing temperatures were set to 873 K, 923 K, and 973 K. Then, the three types of powders were loaded into three graphite dies respectively, and the bulk samples were prepared by a homemade hot-pressing machine at 853 K under 75 MPa in vacuum for 6 minutes.


