 Open Access Article
Creative Commons Attribution 3.0 Unported Licence
Elevated photoelectrochemical activity of FeVO4/ZnFe2O4/ZnO branch-structures via slag assisted-synthesis
Xuefeng She†
a,
Zhuo Zhang†b,
Minki Baekb and
Kijung Yong *b
*b
aState Key Laboratory of Advanced Metallurgy, University of Science and Technology of Beijing (USTB), Beijing 100083, P. R. China
bSurface Chemistry Laboratory of Electronic Materials, Department of Chemical Engineering, Pohang University of Science and Technology (POSTECH), Pohang 790-784, Korea. E-mail: kyong@postech.ac.kr
First published on 16th March 2017
Abstract
Efficient recycling of industrial slag and renewable energy harvesting have become two global subjects. In this work, by recycling rare-earth oxide (REO) slag as the iron source, FeVO4/ZnFe2O4/REO (FVO/ZFO/REO) core–shell–shell nanorods (NRs) are fabricated on ZnO NRs and exhibit obviously enhanced photoelectrochemical (PEC) efficiency. The results confirm that the enhanced light absorption and conversion are attributed to the narrow band gap of ZFO. The improved electron–hole separation and charge migration can be facilitated by the cascade band alignment of ZFO, FVO and ZnO, and the branched nanotaper structures; the lifetime of the electron can be prolonged by the REO passivation layers, leading to efficient PEC enhancement. This study broadens the application of REO slag as a building block for PEC anodes and demonstrates a novel hetero-PEC anode. Overall, recycling of industrial slag could make a crucial contribution to the clean and renewable energy.
Introduction
Skyrocketing energy consumption and the accumulation of industrial waste have already become two serious issues, so there is an urgent need to investigate how to improve the harvesting of green energy and efficiently recycle the industrial waste. For the former issue, solar-hydrogen generation, e.g., photoelectrochemical (PEC) processes, has been proven to be a highly effective strategy.1–5 During the PEC reaction, electron–hole pairs can be generated as the photosensitive semiconductor absorbs photons with energy exceeding its band gap.6–8 For example, n-type semiconductor BiVO4 has demonstrated enhanced PEC efficiencies due to its narrow band gap of 2.4 eV as well as the very small difference between its conduction band edge and the thermodynamic potential for H2 evolution.9 Nonetheless, the resulting electron–hole separation and chemical stability are suboptimal. Comparatively, iron-based n-type semiconductors, such as ZnFe2O4 and FeVO4, have recently emerged as promising PEC anodes due to not only their narrow band gaps and good chemical stability, but also their abundance in the earth, as well as their nontoxic and easy-to-fabricate properties.10–13 Hou et al. have reported that the PEC activity of the anode constructed by pure TiO2 nanotube arrays can be highly enhanced after the modification with ZnFe2O4 via an electrochemical method;14 Biswas et al. have proven that the solar water oxidation activity experiences a notable increase with the use of W-doped FeVO4 anode.15 All the previous results have suggested that ZnFe2O4 and FeVO4 are also promising materials for PEC anode, whose performance is on par with or even better than that of BiVO4.As for the latter issue, it is well known that how to recycle industrial waste efficiently constitutes another urgent worldwide challenge. As a typical type of industrial waste, iron slag is in plentiful amount and broad distribution. Slag is a glass-like product derived from its raw ore, and consists of a consolidated mixture of various compounds, e.g., CaO, SiO2, FeO, among other materials.16 Besides iron production, slag is usually used for cement production. In China's Inner Mongolia, the iron ore is commonly mixed with a large amount of rare-earth (RE) elements, such as Ce and La, making the slag rich in rare-earth oxides (REO).17 Although pure RE elements can be extracted from REO slags and have irreplaceable applications, most REO slags are wasted or inefficiently utilized with minimal economic value produced. In our previous study, CaO and La2O3 in REO can effectively prevent the hydrolysis of the sacrificial reagent in electrolyte, leading to enhanced PEC stability.18 Considering the promising n-type iron-based materials for PEC applications and the latter issue mentioned above, major economic and social benefits could be generated by fabricating n-type iron-based materials via the recycling of REO slag.
In this work, branched FeVO4/ZnFe2O4/REO (FVO/ZFO/REO) core–shell–shell nanorods (NRs) are fabricated on the ZnO NRs by recycling REO slag as the iron source. The fabricated FVO/ZFO/REO NRs demonstrate an enhanced PEC efficiency, and an economic and eco-friendly characteristic. This synthetic strategy might be of great significance to improving the design and fabrication of future PEC iron-based photoanodes, and also creating a promising prospect concerning the economic development of REO slag.
Experimental section
Fabrication
(1) ZnO nanorods (NRs): an array of ZnO NRs is grown on FTO glass using a seed-assisted hydrothermal method. First, the ZnO seed layer is deposited uniformly on the native FTO glass substrate with the aid of radio-frequency (RF) magnetron sputtering. The seeded FTO glass is then dipped into a mixed electrolyte containing hexamethylenetetramine (Sigma-Aldrich, HMTA, 20 mM) and zinc nitrate hexahydrate (Sigma-Aldrich, Zn(NO3)2·6H2O, 20 mM). The deposition process typically lasts for 12 h at 90 °C; (2) rare-earth oxide (REO) powder: first, green cylindrical briquettes with a uniform diameter of 25 mm and a height of 15 mm are formed by pressing 25 g of rare-earth Bayan Obo complex iron ore (referred to as RE ore), 12.71 g of coal and 7.8 pct of water (7.8 mL water mixed with 100.0 g RE ore) into a cylindrical mold for 1 min, followed by a desiccation at 378 K for 4 h in the oven. Dry briquettes are subsequently placed into a graphite plate and heated at 1673 ± 5 K for 0.5 h. Finally, the samples are rapidly removed from the furnace and subsequently cooled to ambient temperature; (3) FVO/ZFO/REO NRs: first, 20 g of REO powder is mixed into 100 mL of 70% sulfuric acid solution (nominally 95–98% H2SO4, Sigma-Aldrich). After stirring for 24 hours, most of Fe2+ ions are extracted from REO and dissolved in the suspension. Thereafter, 0.5 M sodium hydroxide solution (NaOH, Sigma-Aldrich) is added gradually to the solution with stirring until the pH value reaches 7. Thirdly, vanadium(IV) (oxy) acetylacetonate [VO(acac)2, Sigma-Aldrich] is dissolved in acetylacetone with the concentration of 0.03 M and dropped onto the top-surface of prepared ZnO NRs. Fourthly, after drying at 95 °C for 2 h, the ZnO NRs with dried VO(acac)2 are dipped into the REO suspension, and then the REO suspension with ZnO NRs is irradiated by white light (solar simulator, AM 1.5 G filtered, 100 mW cm−2, 91160, Oriel) for 2 h. Consequently, the color of ZnO NRs is changed from green to orange. Next, after cleaning and drying, the samples are annealed in an atmosphere at 500 °C for 0.5 h. Finally, the FVO/ZFO core–shell NRs are formed by coating an REO layer, and accumulated on the top-face of ZnO NRs.Characterization
The morphologies of the prepared nanostructures are confirmed using a field-emission scanning electron microscope (FE-SEM, XL30S, Philips) operated with a 5.0 kV beam energy and a high-resolution scanning transmission electron microscope (HR-STEM; JEM-2200FS with Image Cs-corrector; JEOL) operated with a 200 kV beam energy.Measurements
(1) The optical absorbance of the samples is analyzed using a UV2501PC (Shimadzu) spectrometer with an ISR-2200 integrating sphere attachment for diffuse reflection measurements; (2) the spectra of X-ray diffractions (XRD) were measured in the range of 20–80° with a scan rate of 4° min−1 by using the diffractometer (D/MAX-2500, Rigaku) with Cu Kα radiation (40 kV, 100 mA); (3) X-ray photoelectron scanning microscopy (XPS) is performed using an ESCALAB250 instrument (VG Scientific Company, USA) with Al Kα radiation as the excitation source; (4) IPCE tests: incident photon-to-current efficiency (IPCE) is measured using a 300 W Xe lamp (66–905, Oriel Instruments) with a monochromator (74–004, Oriel Cornerstone 130 1/8 m) whose wavelength ranges from 300 to 700 nm at an interval of 20 nm; (5) photocurrent–voltage (I–V) measurements, EIS, electron lifetime, PEC stability and Mott–Schottky tests are performed using a typical three-electrode potentiostat system (potentiostat/galvanostat, model 263A, EG&G Princeton Applied Research) with a Pt counter electrode and a saturated calomel reference electrode (SCE). The electrolyte for I–V measurements, EIS, electron lifetime and PEC stability is the aqueous solution of 0.25 M Na2S and 0.35 M Na2SO3, through which nitrogen is bubbled. The working electrode is illuminated from the front with a solar simulator (AM 1.5 G filtered, 100 mW cm−2, 91160, Oriel). Especially, the Mott–Schottky measurements are performed in the dark with a frequency of 10 kHz, and by using the aqueous solution of 0.5 M Na2SO4.Results and discussion
Morphologies and growth mechanism
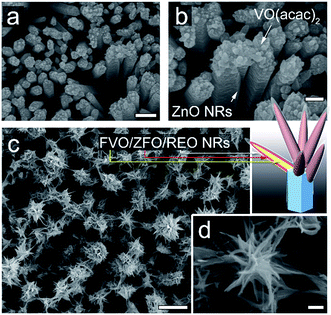
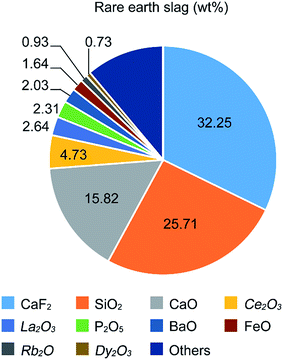
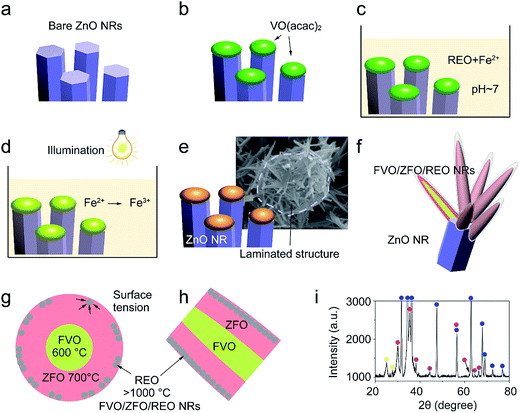
The morphologies evolving from the bare ZnO NRs with dried VO(acac)2 to the ZnO NRs fully covered with FVO/ZFO/REO NRs are shown in Fig. 1. Fig. 1a shows that an array of ZnO NRs is distributed with high density on the FTO glass. The enlarged view in Fig. 1b exhibits that the dried VO(acac)2 nanoparticles are evenly distributed on the top end of ZnO NR. For FVO/ZFO/REO NRs, a branched structure is constructed and used to fully cover the ZnO NRs (Fig. 1c). The enlarged view in Fig. 1d shows the diameters of FVO/ZFO/REO NRs are about 10–20 nm. After that, the synthesis process is carried out. Here, the major ingredients of REO slag are CaF2, SiO2, CaO and REO, and the REOs are indicated with italics (Fig. 2). Only FeO with a combined amount of 1.64 wt% can be employed as iron source. Thus, SiO2 and the compounds containing Ca should be removed. The synthesis process is described as follows. First, the bare ZnO NRs are prepared via hydrothermal method (Fig. 3a). Next, the VO(acac)2 is coated onto the top-surface of ZnO NRs and then dried (Fig. 3b). Subsequently, the REO powder is mixed into H2SO4 solution with the concentration of 70%. So the Fe2+ ions could be extracted from REO and dissolved in the REO suspension (Fig. 3c). NaOH solution is then gradually dripped into the solution until the pH value increases to about 7. Fifthly, ZnO NRs with dried VO(acac)2 are dipped into REO suspension and irradiated by the white light (Fig. 3d). Under the illumination, the electrons and holes are generated from the surface of ZnO. The electrons reduce the H+ ions in the water to generate H2 gas, and the holes oxidize the Fe2+ ions in contact with ZnO to Fe3+.19 During the release of H2, the VO2+ in VO(acac)2 is oxidized to V3+ and the concentration of OH− increases in the suspension. Here, Fe3+ could be reacted with OH−, thus a laminated compound containing Fe3+ and REO is deposited on the ZnO NRs and the dried VO(acac)2 nanoparticles (Fig. 3e). The chemical reactions involved are listed below:| 2H+ + 2e− (electron) → H2↑ (gas), | (1) |
| Fe2+ + h+ (hole) → Fe3+, | (2) |
| h+ + 2H+ + VO2+ → V5+ + H2O, | (3) |
| Fe3+ + 3OH− → Fe(OH)3↓, | (4) |
After cleaning and drying, the precipitated compound assumes a porous structure (Fig. 2b and 3e). Finally, the FVO/ZFO core–shell nanotapers wrapped with a layer of REO are fabricated after annealing in the air at 500 °C (Fig. 3f).
 | (5) |
 | (6) |
 | (7) |
 | (8) |
Here, the melting points of nano-sized FVO and ZFO are lower than 600 (ref. 20) and 700 °C,21 respectively. While that of REO particles is higher than 1000 °C. In our experiment, the annealing temperature is 500 °C. So the FVO and ZFO are pre-melted at 500 °C, yet REO particles does not melt and still exist in solid state. As shown in Fig. 3g, surface tension will force the REO particles migrate to the surface of ZFO structure.22 Similarly, the ZFO is also formed outside the FVO. As a result, the FVO/ZFO/REO core–shell–shell structure is synthesized (Fig. 3h). Here, the FVO/ZFO core–shell NRs are only grown on the top of ZnO NRs. Because, firstly, hexagonal ZnO NR in our samples has a polar structure. The top surface is polar face and has much more defects, such as oxygen vacancies, than non-polar surfaces. So its top surface is easier to adsorb other materials than side surface. Second, Fe(OH)3 precipitate could be generated via reaction (4) and has higher possibility to deposit on the top-surface of ZnO NRs due to the gravity. Therefore, almost all the FVO/ZFO NRs selectively deposited on the top of ZnO NR. Moreover, X-ray diffraction (XRD) measurement is carried out to explore the crystal characters of FVO and ZFO. Fig. 3i demonstrates that ZnO having hexagonal wurtzite structure and SnO2 in FTO substrate are confirmed and marked with blue and pink dots, respectively. The diffraction peaks at 25.0 and 27.7 reflect (120) and (−220) faces of FVO.23 Other peaks at 30.0, 35.4, 56.7 and 62.2 correspond to (220), (311), (511) and (440) faces of ZFO.24 The peaks of FVO and ZFO are marked with yellow and red dots, respectively, and together confirm their well-crystalline characters.
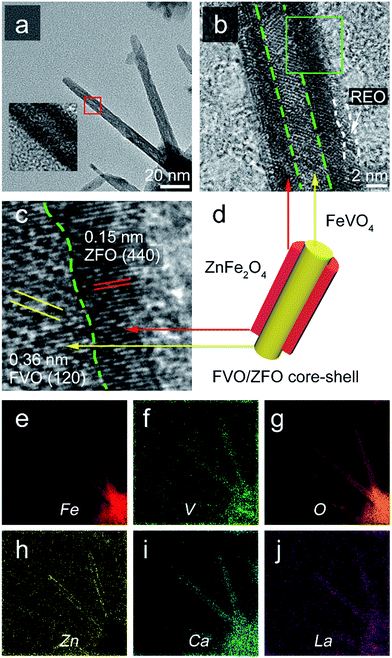
To clearly reveal the crystal properties of the FVO/ZFO/REO NRs, TEM observation is performed. Fig. 4a shows that the FVO/ZFO/REO NRs with diameters about 10 nm share a core–shell structure. The enlarged view of Fig. 4b clearly demonstrates this core–shell morphology with the core diameter being about 3 nm, which is wrapped by a layer of REO less than 2 nm thickness. A close-up view of the boxed region in Fig. 4b is shown in Fig. 4c, which illustrates the HRTEM image indicating that the FVO/ZFO portion is a well-crystalline core–shell structure. The (120) planes of FVO20 and (440) planes of ZFO are confirmed respectively by measuring the distances between crystal planes.25 The FVO-ZFO core–shell structure is illustrated in Fig. 4d. The EELS element mappings in Fig. 4e–h demonstrate that Fe, V, O and Zn are evenly and accurately located at their respective positions. In our previous study, element Ca and La in REO can efficiently enhance the PEC performance by preventing the hydrolysis of sacrificial chemicals, such as SO32−, in PEC electrolyte. So the mappings of Ca and La are also exhibited in Fig. 4i and j. It should be noted that the element mapping of Zn in Fig. 4h clearly confirms this core–shell structure.
In addition to the morphological observations, X-ray photoelectron spectroscopy (XPS) analysis is carried out to further study the chemical binding states of the synthesized materials. For FVO/ZFO/REO NRs, O 1s, Fe 2p, Zn 2p and V 2p are collected in Fig. 5a through Fig. 5d, respectively. Via deconvolution of the XPS peak, it can be seen from Fig. 5a that O 1s spectra consist of three sub-peaks due to spin–orbit coupling at 529.1, 529.7, 531.1 and 533.2 eV, corresponding to the chemical bonding of V–O,26 Fe–O,27 Zn–O28 and O–H, respectively. Fig. 5b demonstrates that the Fe 2p spectra consist of two groups of sub-peaks due to spin–orbit coupling at the 2p1/2 and 2p3/2 states. For each group, it possesses three sub-peaks corresponding to octahedral and tetrahedral structures, as well as satellite peak, respectively.29,30 As the binding energies of octahedral and tetrahedral structures for 2p1/2 are very close, no deconvolution is performed here. The Zn 2p spectra in Fig. 4c also have two sub-peaks at 1022 and 1047 eV, corresponding to 2p1/2 and 2p3/2 states, respectively.28 Similar with Zn 2p, the V 2p spectra in Fig. 5d also have two sub-peaks, corresponding to 2p1/2 and 2p3/2 states, respectively.26 Besides, a weak V4+ peak is present at 517 eV because of oxygen vacancies. The TEM and XPS measurements demonstrate that the FVO/ZFO/REO NRs are constructed by highly crystalline FVO and ZFO core–shell materials and can serve as an ideal candidate for PEC anode.
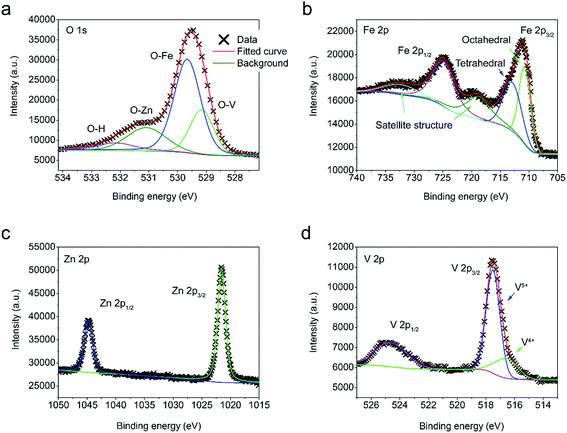 | ||
| Fig. 5 (a–d) XPS spectra of O 1s (a), Fe 2p (b), Zn 2p (c) and V 2p (d) obtained from ZnO NRs decorated with FVO/ZFO/REO NRs. | ||
PEC performances
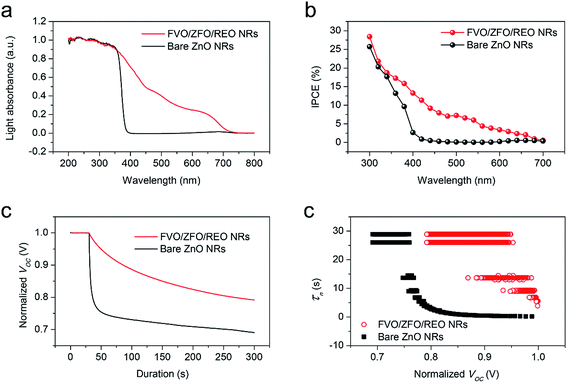
To obtain enhanced PEC efficiency in this work, the light absorptions and photon-to-electron conversion efficiencies (IPCEs) of the FVO/ZFO/REO NRs under the illumination with various wavelengths are evaluated. The light absorbances of the bare ZnO NRs (black) and FVO/ZFO/REO NRs (red) are selected and compared in Fig. 6a. Bare ZnO NRs have enhanced light absorption only in UV region with the wavelength less than 400 nm, and the light absorption of the FVO/ZFO/REO NRs is enhanced in UV to visible light region. The IPCE spectra of the bare ZnO NRs (black) and FVO/ZFO/REO NRs (red) are collected and compared in Fig. 6b as the electrodes at 0 V versus Ag/AgCl. The IPCE value at a given wavelength can be calculated via the following equation:31
 | (9) |
Subsequently, to understand the enhanced charge transport performance of our FVO/ZFO/REO NRs with respect to the excited electron–hole recombination, open-circuit voltage decay (OCVD) measurements are performed. Fig. 6c shows the OCVD curves of bare ZnO NRs (black) and FVO/ZFO/REO NRs (red) as a function of time. These samples are illuminated for approximately 30 s to obtain a uniform open-circuit voltage (Voc), and the Voc decay is then measured with the absence of illumination. Bare ZnO NRs exhibit a faster Voc decay due to the processes where holes accumulate on the surface of the ZnO NRs, and consequently the oxidation reactions involving the holes occur at the NRs/electrolyte interface. This promotes electron–hole recombination and the dissolution of ZnO. FVO/ZFO/REO NRs demonstrate better Voc decay because the three-stage band alignment of ZFO/FVO/ZnO and the branched structures possess the highest light-conversion, and the photoelectron can migrate quickly through branches as pathways, leading to weaker electron–hole recombination. Besides, the passivation effect of the REO layer also slows down the Voc decay. Based on the Voc decay rate, the electron lifetime curves can be deduced from the following equation:32
 | (10) |
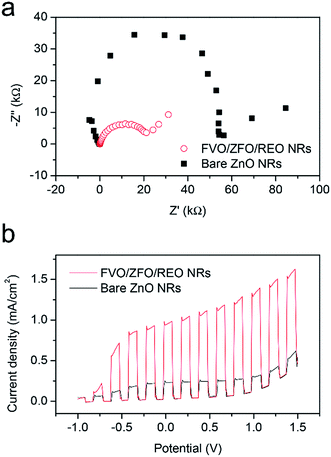
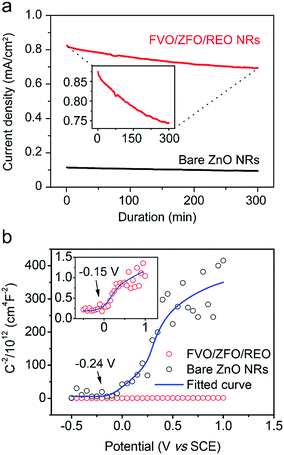
To further study the contributions of the FVO/ZFO/REO NRs to the overall PEC efficiency, electrochemical impedance spectroscopy (EIS) and photocurrent–potential (J–V) measurements are performed subsequently. EIS provides information about the interfacial properties of electrodes. The diameter of the semicircle in EIS correlates with the electron transfer resistance, reflecting the electron transfer kinetics of the redox probe at the electrode interface. The typical EIS plots of the bare ZnO NRs (black square) and FVO/ZFO/REO NRs (red circle) in our PEC solution under illumination are shown in Fig. 7a. The EIS semicircle of the FVO/ZFO/REO NRs has a smaller diameter than that of the bare ZnO NRs, which indicates the faster charge transfer and lower charge recombination at the anode/electrolyte interface, possibly due to enhanced light absorption and photoconversion of ZFO. J–V measurements of the bare ZnO NRs (black) and FVO/ZFO/REO NRs (red) are performed under white light illumination. Fig. 7b shows that the FVO/ZFO/REO NRs have an enhanced current density of 0.99 mA cm−2, which is higher than the current density of 0.24 mA cm−2 in bare ZnO NRs. This is due to the higher photo-conversion efficiency induced by enhanced light absorption and photoconversion of ZFO, as well as the efficient electron–hole separation via cascade band alignment of ZFO, FVO and ZnO. In addition to PEC efficiency, the stability is also very important. Fig. 8 demonstrates that both of FVO/ZFO/REO NRs and bare ZnO NRs have well stabilities. It can be seen from the inset that the current density of FVO/ZFO/REO NRs is only decreased from 0.825 to 0.693 mA cm−2 with the duration of 300 min. That is the decrease is only 15%. The enhanced stability is mainly caused by the cascade band alignment of ZnO, FVO and ZFO, and the passivation layer of REO. Besides the stability test, Mott–Schottky measurements also have been carried out to evaluate the intrinsic electronic properties of the FVO/ZFO/REO NRs.33 Fig. 8b shows the Mott–Schottky plots as 1/C2 vs. potential (V) for bare ZnO NRs and FVO/ZFO/REO NRs. The measurements were performed at 10 kHz. The slopes of the linear parts in Mott–Schottky plots are positive, revealing that both of the two samples are n-type semiconductors. The donor density Nd could be derived by the slope of the Mott–Schottky plot and calculated via the equation: Nd = −(2/eε0ε) × [d(1/C2)/dV]−1, where C is the space charge capacitance of the semiconductor, e is the fundamental charge constant, ε0 is the permittivity of the vacuum and ε is the relative permittivity of the semiconductor.34 Higher slope for the plot of FVO/ZFO/REO NRs demonstrates higher carrier concentration than that of bare ZnO NRs. The flat bands (VFB) are identified as −0.24 and −0.15 V for bare ZnO NRs and FVO/ZFO/REO NR, respectively.
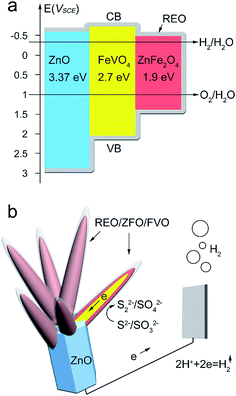
Based on the above studies and results, Fig. 9a and b exhibit schemes to explain the cascade band alignment of ZFO and ZnO, and the PEC enhancement observed for FVO/ZFO/REO NRs, respectively. Overall, a cascade band structure is constructed (Fig. 9a) as dictated by the band gaps of 1.9 eV, 2.7 eV and 3.37 eV for ZFO, FVO and ZnO, respectively, which facilitates the transport of electrons and holes, and prevents their recombination. Under illumination, photogenerated electrons in the conduction band (CB) of ZFO are then injected into FVO and ZnO. Those electrons ultimately arrive at the Pt counter electrode to reduce the hydrogen ions to hydrogen gas (Fig. 9b). Most of the holes accumulated on the surface of the REO layers oxidize the S2− ions to S22− ions. The role of the sacrificial reagent in the electrolyte (SO32−) is to prevent a reverse reaction by reducing S22− to S2−.35 For the branched structures, the large surface area can absorb more light irradiation and provide plenty of the interfacial area with electrolyte for PEC reaction. Besides, a great number of nanotapers can act as numerous pathways to facilitate the charge transfer, leading to the enhanced PEC efficiency. Our previous studies confirm that the REO can also be used as the OH− supplier to block hydrolysis of Na2S and Na2SO3 in the PEC electrolyte. As a result, the PEC performance and the electron lifetime can be obviously enhanced by the FVO/ZFO/REO NRs.
Conclusions
FVO/ZFO/REO core–shell–shell NRs are formed on the ZnO NRs by using REO powder as iron source, giving rise to efficient PEC anodes for hydrogen generation. The REO layer can tightly wrap around the VO/ZFO core–shell NRs and act as a passivation layer, leading to improved electron lifetime. Moreover, the PEC enhancement can also be ascribed to the cascade band alignment of ZFO, FVO and ZnO, and the clustered structures. The products and fabrication methods presented in the current study are highly suitable for developing various heteronanostructures for energy devices. Overall, the FVO/ZFO/REO NRs can increase the PEC efficiency obviously compared with bare ZnO NRs and demonstrate the potential application for future PEC anodes.Acknowledgements
This research was supported by the National Research Foundation of Korea (NRF-2016R1A2B2011416).References
- M. Grätzel, Nature, 2001, 414, 338 CrossRef PubMed.
- A. Paracchino, V. Laporte, K. Sivula, M. Grätzel and E. Thimsen, Nat. Mater., 2011, 10, 456 CrossRef CAS PubMed.
- H. G. Cha and K.-S. Choi, Nat. Chem., 2015, 7, 328 CrossRef CAS PubMed.
- Q. H. Liu, J. F. He, T. Yao, Z. H. Sun, W. R. Cheng, S. He, Y. Xie, Y. H. Peng, H. Cheng, Y. F. Sun, Y. Jiang, F. C. Hu, Z. Xie, W. S. Yan, Z. Y. Pan, Z. Y. Wu and S. Q. Wei, Nat. Commun., 2014, 5, 5122 CrossRef CAS PubMed.
- S. Licht, Nature, 1987, 330, 148 CrossRef CAS.
- H. D. Rubin, B. D. Humphrey and A. B. Bocarsly, Nature, 1984, 308, 339 CrossRef CAS.
- R. G. Li, F. X. Zhang, D. G. Wang, J. X. Yang, M. R. Li, J. Zhu, X. Zhou, H. X. Han and C. Li, Nat. Commun., 2013, 4, 1432 CrossRef PubMed.
- S. C. Warren, K. Voïtchovsky, H. Dotan, C. M. Leroy, M. Cornuz, F. Stellacci, C. Hébert, A. Rothschild and M. Grätzel, Nat. Mater., 2013, 12, 842 CrossRef CAS PubMed.
- J. Su, L. Guo, N. Bao and C. A. Grimes, Nano Lett., 2011, 11, 1928 CrossRef CAS PubMed.
- Z. Yuan, J. Mater. Chem., 2001, 11, 1265 RSC.
- X. Li, Y. Hou, Q. Zhao and G. Chen, Langmuir, 2011, 27, 3113 CrossRef CAS PubMed.
- Y. Bi, W. Wang and L. Wang, J. Mater. Chem. A, 2017, 5, 2478 Search PubMed.
- J. Li, W. Zhao, Y. Guo, Z. Wei, M. Han, H. He, S. Yang and C. Sun, Appl. Surf. Sci., 2015, 351, 270 CrossRef CAS.
- Y. Hou, X. Li, Q. Zhao, X. Quan and G. Chen, Environ. Sci. Technol., 2010, 44, 5098 CrossRef CAS PubMed.
- S. K. Biswas and J. O. Baeg, Int. J. Hydrogen Energy, 2013, 38, 14451 CrossRef CAS.
- T. Xu and H. Peng, J. Rare Earths, 2009, 27, 1096 CrossRef.
- F. E. Lichte, A. L. Meier and J. G. Crock, Anal. Chem., 1987, 59, 1150 CrossRef CAS.
- X. She, Z. Zhang, M. Baek, M. Choi, K. Yong, J. Wang and Q. Xue, ChemElectroChem, 2016, 3, 1890 CrossRef CAS.
- U. Koch, A. Fojtik, H. Weller and A. Henglein, Chem. Phys. Lett., 1985, 122, 507 CrossRef CAS.
- V. D. Nithya, R. K. Selvan, C. Sanjeeviraja, D. Mohan Radheep and S. Arumugam, Mater. Res. Bull., 2011, 46, 1654 CrossRef CAS.
- M. A. Valenzuela, P. Bosch, J. Jiménez-Becerrill, O. Quiroz and A. I. Páez, J. Photochem. Photobiol., A, 2002, 148, 177 CrossRef CAS.
- G. McHale and M. I. Newton, Soft Matter, 2015, 11, 2530 RSC.
- W. Wong-Ng, H. F. McMurdie, B. Paretzkin, Y. Zhang, C. R. Hubbard, A. L. Dragoo and J. M. Stewart, Powder Diffr., 1988, 3, 47 CrossRef CAS.
- E. Riedel, G. Colsmann and B. Reuter, Ber. Bunsenges. Phys. Chem., 1968, 72, 880 CAS.
- Z. Xing, Z. Ju, J. Yang, H. Xu and Y. Qian, Nano Res., 2012, 5, 477 CrossRef CAS.
- A. Dixit, P. Chen, G. Lawes and J. L. Musfeldt, Appl. Phys. Lett., 2011, 99, 141908 CrossRef.
- S. Bera, A. A. M. Prince, S. Velmurugan, P. S. Raghavan, R. Gopalan, G. Panneerselvam and S. V. Narasimhan, J. Mater. Sci., 2001, 36, 5379 CrossRef CAS.
- P. T. Hsieh, Y. C. Chen, K. S. Kao and C. M. Wang, Appl. Phys. A, 2008, 90, 317 CrossRef CAS.
- M. Wang, Z. Ai and L. Zhang, J. Phys. Chem. C, 2008, 112, 13163 CAS.
- E. Paparazzo, J. Electron Spectrosc. Relat. Phenom., 1987, 43, 97 CrossRef CAS.
- J. W. Jang, S. Cho, G. Magesh, Y. J. Jang, J. Y. Kim, W. Y. Kim, J. K. Seo, S. Kim, K. H. Lee and J. S. Lee, Angew. Chem., 2014, 126, 5962 CrossRef.
- M. Choi and K. Yong, Nanoscale, 2014, 6, 13900 RSC.
- A. Allagui, H. Alawadhi, M. Alkaaby, M. Gaidi, K. Mostafa and Y. Abdulaziz, Phys. Status Solidi A, 2016, 213, 139 CrossRef CAS.
- M. Wang, L. Sun, J. Cai, P. Huang, Y. Su and C. Lin, J. Mater. Chem. A, 2013, 1, 12082 CAS.
- Z. Zhang, M. Choi, M. Baek and K. Yong, Nanoscale, 2015, 7, 8748 RSC.
Footnote |
| † These authors contributed equally to this work. |
| This journal is © The Royal Society of Chemistry 2017 |

