 Open Access Article
Creative Commons Attribution 3.0 Unported Licence
Heavy-metal pollution alters dissolved organic matter released by bloom-forming Microcystis aeruginosa
Haiming Wua,
Li Linb,
Guangzhu Shena and
Ming Li *ac
*ac
aCollege of Resources and Environment, Northwest A&F University, Yangling 712100, PR China. E-mail: lileaf@163.com
bDepartment of Water Environment Research, Changjiang River Scientific Research Institute, Wuhan 430010, P. R. China
cKey Laboratory of Plant Nutrition and the Agri-environment in Northwest China, Ministry of Agriculture, PR China
First published on 27th March 2017
Abstract
The risk of heavy metals to aquatic ecosystems has been paid much attention worldwide in recent years, however, the knowledge on effects of heavy metals on dissolved organic matter (DOM) released by Microcystis was quite poor, especially in eutrophic lakes. The aim of this study is to investigate effects of heavy metals on DOC release of Microcystis using EEM-PAFAFAC analysis. Microcystis aeruginosa was batch cultured for 18 days in BG-11 medium treated with a range of concentrations of Cu2+ (0.02, 0.05, 0.10 and 0.25 mg L−1) and Zn2+ (0.10, 0.20, 0.50 and 1.00 mg L−1), to investigate the effects of heavy metals on DOM release of Microcystis. The cultures without addition of Cu2+ or Zn2+ were set as controls. Cell density in the treatment of 0.25 mg L−1 Cu2+ was 25% less than that in the control, but addition of 0.25 mg L−1 Zn2+ had little effect on Microcystis growth. Moderate levels of Cu2+ (0.05 and 0.10 mg L−1) and high level of Zn2+ (1.00 mg L−1) stimulated DOC production of M. aeruginosa on day 10; moderate levels of Zn2+ (0.10–0.50 mg L−1) stimulated DOC production on day 18 compared to the control. Four components of DOM: two humic-like components (C1 and C3) and two protein-like components (C2 and C4), were identified by fluorescence excitation – emission matrix spectroscopy combined with parallel factors (EEM-PAFAFAC) analysis. The fluorescence intensity of the four components increased when Microcystis was treated with moderate level of Cu2+ (0.05 and 0.10 mg L−1) on day 10. In addition, the composition of DOM produced by Microcystis was not affected by heavy metals. Our results suggested that Microcystis increased DOM production in logarithmic phase by altering cellular secretion, but large biomass was the effective measure for M. aeruginosa to reduce toxicity of heavy metals in the stationary phase.
1. Introduction
Heavy metal pollution is a serious issue resulting from anthropogenic activities that poses a severe risk to the environment, ecosystems, and human health.1 The risks to humans of heavy-metal pollution in freshwater ecosystems are especially high because of the enrichment of heavy metals in aquatic food chains.2 Despite the application of many environmental technologies to keep heavy-metal concentrations within safe levels, the distribution of heavy metals in aquatic ecosystems, and their toxicity to fish, phytoplankton, and other aquatic animals, still requires investigation to gain a better understanding of the risks of heavy metal pollution in aquatic ecosystems over the last several decades.3,4Cyanobacterial bloom in lakes and reservoirs is another environmental issue resulting from anthropogenic activities.5 This phenomenon causes serious environmental problems, such as oxygen depletion, unpleasant odors, and toxin production.6 However, bloom-forming cyanobacteria, including the most widely distributed example, Microcystis, have been reported as carbon sources for zooplankton in eutrophic lakes.7 Microcystis also releases dissolved organic matter (DOM) into water, including polysaccharides and amino acids.8 DOM is an important energy source for heterotrophic bacteria, which vary dramatically in response to varying environments.9,10 Therefore, the variation in DOM released by Microcystis under different environmental conditions should be well understood.
The concentration of dissolved organic carbon (DOC) has been shown to increase with decreasing nitrate in a eutrophic lake (Lake Taihu, China) with Microcystis blooms.10 Furthermore, Yang and Kong11 reported that the concentrations of extracellular polysaccharides (EPS) and the main component of DOM released by Microcystis were higher when treated with a lower nutrient concentration. These results demonstrated that DOM concentration is negatively correlated with nutrient level. The effects of temperature and light intensity on the EPS of Microcystis have also been well studied.12 Bi et al.13 indicated that increasing Pb concentration promoted EPS production in Microcystis. Herzi et al.14 showed that the DOC concentration of Alexandrium catenella varied greatly when exposed to different concentrations of Pb and Zn. Therefore, it could be deduced that heavy metals can affect DOM production by Microcystis. Accordingly, heavy metal pollution can affect DOM dynamics in aquatic ecosystems by influencing DOM release from Microcystis, especially in eutrophic lakes where Microcystis blooms occur frequently. However, the effects of heavy metals on DOM release by Microcystis are poorly understood, and should be investigated with regard to quantity and quality.
Fluorescence excitation–emission matrix spectroscopy combined with parallel factor analysis (EEM-PAFAFAC) is a rapid and effective method for identifying the composition of complex organic matter, and has been widely applied to characterize DOC in lakes and algal EPS.15–17 Xu et al.18 analyzed extracellular polymeric substances from Microcystis by EEM-PARAFAC and successfully determined four components belonging to protein-like and humic-like substances. Additionally, Herzi et al.14 analyzed the DOM released by Alexandrium catenella exposed to heavy metals using the same method.
The aim of this study is to investigate the effects of heavy metals on DOC release in Microcystis using EEM-PAFAFAC analysis. Microcystis aeruginosa, a common bloom-forming Microcystis species distributed worldwide, was chosen as the test organism. Cu and Zn were chosen as the test heavy metals because copper sulfate is often added into lakes as an agent to remove Microcystis19 and the Zn concentration is always higher than those of other heavy metals in lakes and reservoirs.20 Furthermore, Cu and Zn are necessary trace elements for photosynthesis.21 The results of this work increase understanding of the effects of heavy metals on energy flows and carbon cycles in aquatic ecosystems.
2. Materials and methods
2.1 Organisms
M. aeruginosa (FACHB 469) was provided by the Freshwater Algae Culture Collection of the Institute of Hydrobiology, Chinese Academy of Sciences. This strain was cultivated axenically in BG-11 medium for more than three months and existed as single cells before experiments.2.2 Culture conditions
The alga was batch cultured in BG-11 medium (120 mL) in a 250 mL conical flask with varying Cu2+ and Zn2+ concentrations. The concentrations were adjusted to 0, 0.02, 0.05, 0.10, and 0.25 mg L−1 Cu2+ and 0, 0.10, 0.20, 0.50, and 1.00 mg L−1 Zn2+ using CuCl2 (5 mg L−1) and ZnCl2 (10 mg L−1) solutions, respectively. Different Cu2+ and Zn2+ concentration ranges were selected because Cu2+ was more toxic than Zn2+ to Microcystis.22 Concentrations of 0 mg L−1 were used as the control. Six replicates were carried out for each treatment. All samples were cultured at 25 °C in a light–dark cycle (12 hours each) using 50 μmol per photons per m2 per s. The culture experiment was performed for 18 days. The flasks were shaken two or three times daily by hand to prevent cells from adhering to the inner flask walls.2.3 Culture enumeration
The cell density of M. aeruginosa was measured every two days by counting cells in a hemocytometer three times under an optical microscope (Olympus CX31, Olympus Corporation) at 400× magnification. If the three counts differed by less than 10%, the average value was calculated as the final cell density. Otherwise, additional counting was carried out.2.4 Analysis of DOM and DOC
Samples were collected twice, on days 10 and 18, as three replicates. The first collection represented the logarithmic phase, while the second represented the stationary phase. The algal sample was centrifuged at 16![[thin space (1/6-em)]](https://www.rsc.org/images/entities/char_2009.gif) 000 × g for 10 min and the supernatants were then filtered through a membrane with 0.45 μm pore size. The filtrate was used for the analysis of DOC concentration and fluorescence EEM spectra. DOC concentration was analyzed using a total organic carbon analyzer (TOC-L CPN, Shimadzu, Japan). Fluorescence EEM spectra were measured using a fluorescence spectrometer (F97 Pro, Lengguang Tech., China) in scan mode with a xenon lamp (700 V) at room temperature. All cuvettes were rinsed with 5% HNO3 solution before analysis. The excitation (Ex) wavelengths were 200–450 μm with a step length of 5 nm, while the emission (Em) wavelengths were 250–500 μm with step length of 2 nm. The scan speed was set at 6000 nm min−1.
000 × g for 10 min and the supernatants were then filtered through a membrane with 0.45 μm pore size. The filtrate was used for the analysis of DOC concentration and fluorescence EEM spectra. DOC concentration was analyzed using a total organic carbon analyzer (TOC-L CPN, Shimadzu, Japan). Fluorescence EEM spectra were measured using a fluorescence spectrometer (F97 Pro, Lengguang Tech., China) in scan mode with a xenon lamp (700 V) at room temperature. All cuvettes were rinsed with 5% HNO3 solution before analysis. The excitation (Ex) wavelengths were 200–450 μm with a step length of 5 nm, while the emission (Em) wavelengths were 250–500 μm with step length of 2 nm. The scan speed was set at 6000 nm min−1.
2.5 Data analysis
All data were presented as mean ± standard deviation. PARAFAC modeling was executed in MATLAB 7.0 software (Mathworks, Natick, MA) using the DOMFluor toolbox.23 There was no outlier sample in the leverage comparison. Residual and split-half analyses were used to determine the correct numbers of components. Analysis of variance (ANOVA) was conducted to analyze the differences among different treatments using Tukey's post hoc test with SPSS 10.0 software.3. Results and discussion
3.1 Growth of M. aeruginosa
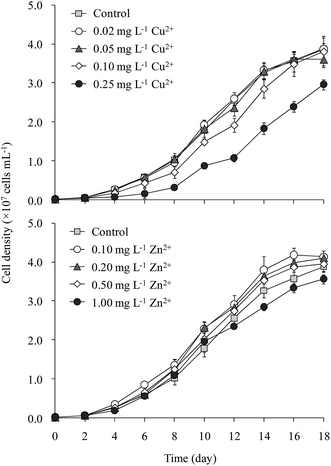
The cell density of M. aeruginosa increased rapidly from day 2 to day 14, after which the growth slowed gradually (Fig. 1). The cell density in the 0.25 mg L−1 Cu2+ treatment was 25% lower than that in the control throughout incubation. M. aeruginosa growth in the 0.02 and 0.05 mg L−1 Cu2+ treatments was similar to that of the control. Cell density in the 0.10 mg L−1 Cu2+ treatment (3.8 × 10⁷ cells per mL) was slightly lower than that of the control (3.9 × 10⁷ cells per mL). The maximum cell densities were 3.8, 4.1, 4.1, 3.9, and 3.7 × 10⁷ cells per mL, respectively, in the control and 0.10, 0.20, 0.50, and 1.00 mg L−1 Zn2+ treatments, respectively.Tsai24 reported that the minimum amount of Cu2+ required to inhibit M. aeruginosa growth was 0.16 mg L−1. Wu et al.25 indicated that 0.25 mg L−1 Cu2+ significantly inhibited Microcystis growth. Deng et al.26 showed that 0.10 mg L−1 Cu2+ significantly decreased the Chl-a content in M. aeruginosa. Polyak et al.27 demonstrated that 0.25 mg L−1 Zn2+ inhibited M. aeruginosa growth. Our results matched with the toxicities of Cu2+ and Zn2+ reported elsewhere.
3.2 DOC concentrations
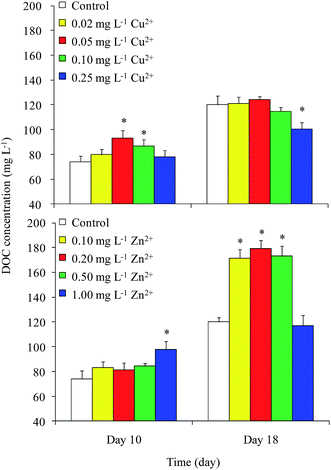
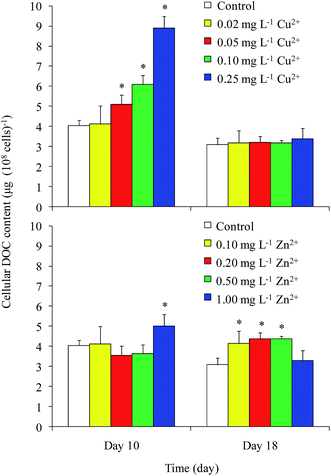
DOC concentrations in the control were 74 and 120 mg L−1 on days 10 and 18, respectively (Fig. 2). On day 10, the DOC concentrations in the 0.05 and 0.10 mg L−1 Cu2+ and 1 mg L−1 Zn2+ treatments were greater than that of the control. The maximum value of approximately 98 mg L−1 appeared in the 1 mg L−1 Zn2+ treatment. On day 18, the DOC concentrations in all Zn2+ treatments were significantly higher than that of the control, except for that of the highest Zn2+ treatment. Unexpectedly, the DOC concentration in the sample treated with the highest level of Cu2+ decreased to 100 mg L−1, while samples treated with moderate levels of Cu2+ showed no obvious differences compared with the control. Reports on the effects of heavy metals on DOC concentration in Microcystis are rare. Bi et al.13 reported that Pb stimulated the production of extracellular polysaccharide (EPS) in Microcystis. Herzi et al.14 indicated that the DOM released by A. catenella was promoted by 0.78 mg L−1 Zn2+, with the results similar to ours obtained from M. aeruginosa in this study. These results indicated that heavy metals may promote DOC production in Microcystis.The cellular DOC content is shown in Fig. 3. In general, the cellular DOC content on day 10 was larger than that on day 18. The cellular DOC content increased with increasing Cu2+ concentration on day 10, but differences among different Cu2+ treatments were not significant on day 18. Zn2+ addition had little effect on the cellular DOC content on day 10, except in the case of 1 mg L−1 Zn2+ treatment. However, the production of cellular DOC content was promoted when treated with moderate levels of Zn2+.
The DOC concentrations in culture medium exposed to different levels of Cu2+ on day 18 were found to be significantly lower than those in the medium amended with different levels of Zn2+. Although both Cu and Zn are necessary trace elements for photosynthesis, the Zn content (15–50 mg kg−1 dry weight) in plants is always higher than that of Cu (1–20 mg kg−1 dry weight).21 In the current study, the growth and cellular DOC content of Microcystis on day 18 were significantly promoted when treated with moderate levels of Zn2+, but inhibited when treated with Cu2+. This result implied that Microcystis photosynthesis was promoted when treated with moderate level of Zn2+, causing the DOC concentration to increase.
3.3 Composition of EEM spectra
All fluorescence EEM spectra of DOM were successfully decomposed into a four-component model based on residual and split-half analyses. The contours and Ex/Em loadings of the four components are shown in Fig. 4. The first component (C1) gave a peak at λEx/Em = 355/458 nm. This component was a humic acid-like compound28 also described in Region V by Chen et al.29 The second component (C2) gave maximum intensities at an excitation wavelength of 235 nm and centered between emission wavelengths of 250 and 400 nm. This component was identified as an aromatic protein-like compound.29–31 The third component (C3) gave two peaks (λEx/Em = 280/474 nm and λEx/Em = 415/474 nm) and was defined as a UVC humic acid-like compound with a high molecular weight.30,32,33 The last component (C4) gave a peak at λEx/Em = 285/358 nm and was defined as a protein-like compound containing tryptophan.18,29,34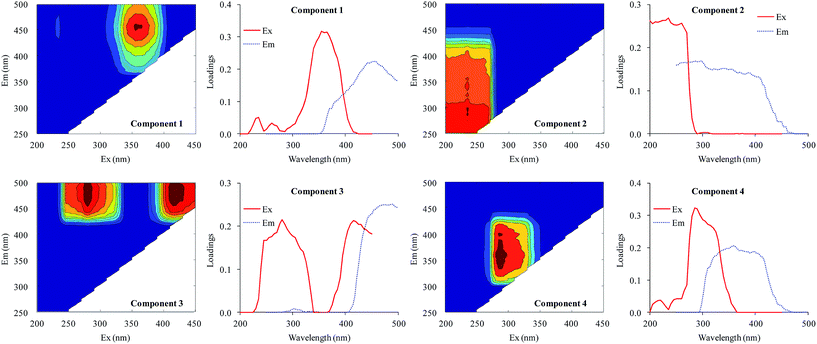 | ||
| Fig. 4 EEM contours, and excitation and emission loadings of the four components identified by EEM-PARAFAC analysis. | ||
Therefore, the four components identified from the fluorescence spectra were two humic-like components (C1 and C3) and two protein-like components (C2 and C4). Xu et al.18 identified three protein-like compounds and a humic-like compound in the EPS of Microcystis. Aoki et al.35 found a fulvic acid-like compound, a protein-like compound, and an unknown compound in the DOM of M. aeruginosa. Yang et al.36 distinguished a tryptophan-like component and two humic acid-like compounds. The wavelength coverage of excitation and emission in the current study was much wider than previous studies, resulting in more humic acid-like components being identified.
3.4 Variations in fluorescence contributions
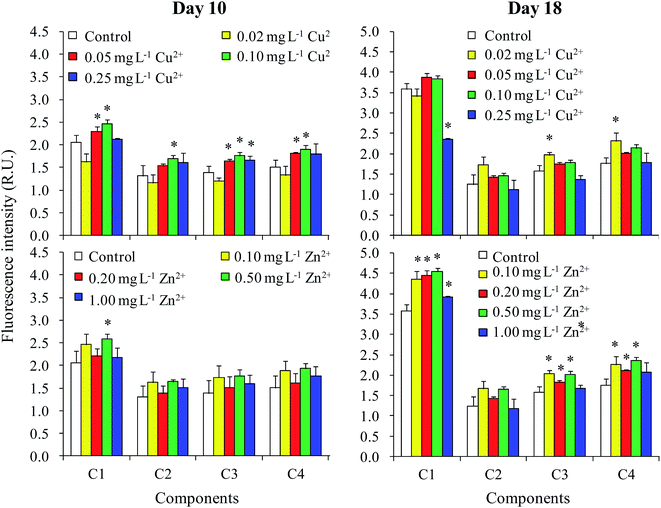
The fluorescence intensity of all four components in the DOM had increased by day 10 when treated with moderate levels of Cu2+ (0.05 and 0.10 mg L−1) (Fig. 5). However, Zn2+ had only a small effect on fluorescence intensity. Nevertheless, the fluorescence intensity of C1 increased when treated with 0.10 mg L−1 Cu2+ and 0.50 mg L−1 Zn2+. The results in the stationary phase were completely different than in the logarithmic phase. For Cu2+ treatments, no significant difference was observed between the fluorescence intensities of different treatments and the control, except that the values of C3 and C4 treated with 0.02 mg L−1 Cu2+ were significantly higher than those of the control. Additionally, the fluorescence intensities of C1, C3, and C4 in the DOM improved when treated with moderate levels of Zn2+ (0.10–0.50 mg L−1).The relationships among the fluorescence intensities of different components, cell densities, and DOC concentrations in the logarithmic phase (day 10) and stationary phase (day 18) are shown in Tables 1 and 2, respectively. On day 10, the DOC concentration was neither significantly related to the fluorescence intensities of all components, nor significantly related to cell density (Table 1). Furthermore, we found that there was no significant difference in the percentage of the four components calculated from their fluorescence intensities among the different treatments on day 10 (data not shown). These results showed that the increase in fluorescence intensity of the four components on day 10 was due to increased DOC production, but with no change in DOM composition. Moreover, the DOC concentration was not correlated with cell density on day 10, indicating that the increase in DOC concentration induced by the addition of Cu2+ and Zn2+ (Fig. 2) was not caused by the influence of heavy metals on the biomass of M. aeruginosa, but by the variation in cellular secretion of DOM during the logarithmic phase (Fig. 3).
| Cell density | DOC | Total | C1 | C2 | C3 | C4 | |
|---|---|---|---|---|---|---|---|
| a Total indicates total fluorescence intensity. *Correlation is significant at the 0.05 level (two-tailed); **correlation is significant at the 0.01 level (two-tailed). | |||||||
| Cell density | 1.000 | ||||||
| DOC | 0.315 | 1.000 | |||||
| Total | 0.291 | 0.461 | 1.000 | ||||
| C1 | 0.479 | 0.359 | 0.961** | 1.000 | |||
| C2 | 0.118 | 0.465 | 0.978** | 0.889** | 1.000 | ||
| C3 | 0.227 | 0.483 | 0.995** | 0.931** | 0.989** | 1.000 | |
| C4 | 0.222 | 0.537 | 0.990** | 0.918** | 0.987** | 0.996** | 1.000 |
| Cell density | DOC | Total | C1 | C2 | C3 | C4 | |
|---|---|---|---|---|---|---|---|
| a Total indicates total fluorescence intensity. *Correlation is significant at the 0.05 level (two-tailed); **correlation is significant at the 0.01 level (two-tailed). | |||||||
| Cell density | 1.000 | ||||||
| DOC | 0.739* | 1.000 | |||||
| Total | 0.783** | 0.812** | 1.000 | ||||
| C1 | 0.842** | 0.827** | 0.912** | 1.000 | |||
| C2 | 0.592 | 0.590 | 0.829** | 0.547 | 1.000 | ||
| C3 | 0.713* | 0.729* | 0.960** | 0.769** | 0.942** | 1.000 | |
| C4 | 0.409 | 0.588 | 0.865** | 0.617 | 0.871** | 0.920** | 1.000 |
Although DOC concentrations of the cell and the culture medium treated with moderate levels of Zn2+ were greater than that in the control sample on day 18 (Fig. 2 and 3), the cellular DOC content showed no obvious variations on day 18 under treatment with varying concentrations of Cu2+. Moreover, the DOC concentration was significantly correlated with cell density on day 18 (Table 2). Therefore, it was deduced that the increase in DOC concentration induced by Cu2+ and Zn2+ treatment in the stationary phase (Fig. 2) was caused by the influence of heavy metals on biomass of M. aeruginosa, but not by variations in cellular secretion. The component percentage amounts calculated from their fluorescence intensities on day 18 were similar among different treatments. On day 18, the fluorescence intensities of all four components were significantly related to the total fluorescence intensity. Therefore, similar to day 10, the DOM composition was not affected by heavy metal addition on day 18.
Extracellular polymeric substances (EPS) are the main components of DOM released by Microcystis.18 EPS has been reported to play a role in protecting algae against heavy metal toxicity37,38 and other chemical stresses.39,40 Humic acid-like compounds have been used to chelate heavy metals.30 Herzi et al.14 also suggested that both tryptophan-like compounds and proteins could chelate heavy metals to reduce their toxicity. Our results showed that the DOM composition produced by Microcystis was not affected by heavy metal addition, but that the concentration of each component increased when treated with heavy metal. It was deduced that all four compounds identified in the current study could be used to chelate heavy metals to reduce their toxicity toward M. aeruginosa. However, Microcystis increased DOM production in the logarithmic phase by altering cellular secretion, but high biomass was the effective measure for M. aeruginosa to reduce the toxicity of heavy metals in the stationary phase. Xu et al.18 indicated that two protein-like components and a humic acid-like component were significantly correlated with the cell density of M. aeruginosa culture in low nutrient medium and standard medium. Our results differed from theirs because heavy metal addition in the current study altered the DOM production of M. aeruginosa.
Our results demonstrated that 0.05 and 0.1 mg L−1 Cu2+ improved DOM production in M. aeruginosa during the logarithmic phase, but 0.25 mg L−1 Cu2+ reduced DOM production. In addition, 0.10–1.00 mg L−1 Zn2+ stimulated DOM release from M. aeruginosa in different growth phases. All above concentrations of Cu2+ and Zn2+ have been detected in natural waters bodies, including Lake Taihu20 and Lake Qarun.41 Therefore, the DOC concentrations in these waters would increase due to the effects of heavy metals on DOM release by Microcystis and other phytoplankton. The increasing DOC would affect carbon and nitrogen cycles,42 the abundance and community of aquatic microorganisms,43 and the fate and transport of hazardous materials44,45 in natural waters. Therefore, the effects of heavy metals in relatively safe concentrations on aquatic ecosystems should be considered because they can alter DOM production by phytoplankton especially for Microcystis.
4. Conclusions
(1) During the logarithmic phase, moderate levels of Cu2+ (0.05 and 0.10 mg L−1) and high levels of Zn2+ (1.00 mg L−1) stimulated DOC production of M. aeruginosa. In the stationary phase, moderate levels of Zn2+ (0.10–0.50 mg L−1) stimulated DOC production, but high levels of Cu2+ (0.10 mg L−1) decreased DOC concentration compared with the control.(2) Four components were identified from fluorescence spectra by EEM-PARAFAC, consisting of two humic-like components (C1 and C3) and two protein-like components (C2 and C4). The fluorescence intensities of all four components in the DOM were improved on day 10 when treated with moderate levels of Cu2+ (0.05 and 0.10 mg L−1), but the fluorescence intensities of C1, C3, and C4 in the DOM on day 18 were improved when treated with moderate levels of Zn2+ (0.10–0.50 mg L−1).
(3) The DOM composition produced by Microcystis was not affected by heavy metal addition. Microcystis increased DOM production in the logarithmic phase by altering cellular secretion, but high biomass was the effective measure for M. aeruginosa to reduce the toxicity of Cu and Zn in the stationary phase.
Acknowledgements
This study was sponsored by the National Natural Science Foundation of China (Grant 51409216, 51508466) and the Special Funds Projects for Control Water Pollution in Lake Taihu, Section Ten (Grant JSZC-G2016-198).References
- J. W. Moore and S. Ramamoorthy, Organic Chemicals in Natural Waters Applied Monitoring & Impact Assessment, Springer Series on Environmental Management, 2012 Search PubMed.
- A. Altındağ and S. Yiğit, Chemosphere, 2005, 60, 552–556 CrossRef PubMed.
- R. Dallinger, F. Prosi, H. Segner and H. Back, Oecologia, 1987, 73, 91–98 CrossRef CAS PubMed.
- E. Pinto, T. Sigaud-kutner, M. A. Leitao, O. K. Okamoto, D. Morse and P. Colepicolo, J. Phycol., 2003, 39, 1008–1018 CrossRef CAS.
- K. D. Joehnk, J. E. F. Huisman, J. Sharples, B. E. N. Sommeijer, P. M. Visser and J. M. Stroom, Summer heatwaves promote blooms of harmful cyanobacteria, Global Change Biol., 2008, 14, 495–512 CrossRef.
- H. W. Paerl, R. S. Fulton, P. H. Moisander and J. Dyble, Sci. World J., 2001, 1, 76–113 CrossRef CAS PubMed.
- A. de Kluijver, J. L. Yu, M. Houtekamer, J. J. Middelburg and Z. W. Liu, Limnol. Oceanogr., 2012, 57, 1245–1254 CrossRef CAS.
- T. B. Bittar, A. A. Vieira, A. Stubbins and K. Mopper, Limnol. Oceanogr., 2015, 60, 1172–1194 CrossRef CAS.
- I. Sundh, Appl. Environ. Microbiol., 1992, 58, 2938–2947 CAS.
- L. Ye, X. Shi, X. Wu and F. Kong, J. Limnol., 2012, 71, 67–71 Search PubMed.
- Z. Yang and F. Kong, Chin. J. Oceanol. Limnol., 2013, 31, 796–802 CrossRef CAS.
- M. Li, W. Zhu, L. Gao and L. Lu, J. Appl. Phycol., 2013, 25, 1023–1030 CrossRef CAS.
- X. D. Bi, S. L. Zhang, W. Dai, K. Z. Xing and F. Yang, Water Sci. Technol., 2013, 67, 803–809 CrossRef CAS PubMed.
- F. Herzi, N. Jean, A. Sakka Hlaili and S. Mounier, J. Phycol., 2014, 50, 665–674 CrossRef CAS PubMed.
- Y. Yamashita, R. Jaffé, N. Maie and E. Tanoue, Limnol. Oceanogr., 2008, 53, 1900–1908 CrossRef CAS.
- H. Xu, H. Jiang, G. Yu and L. Yang, Chemosphere, 2014, 117, 815–822 CrossRef CAS PubMed.
- H. Xu, L. Guo and H. Jiang, Chemosphere, 2016, 145, 551–559 CrossRef CAS PubMed.
- H. Xu, H. Cai, G. Yu and H. Jiang, Water Res., 2013, 47, 2005–2014 CrossRef CAS PubMed.
- L. García-Villada, M. Rico, M. Altamirano, L. Sánchez-Martín, V. López-Rodas and E. Costas, Water Res., 2004, 38, 2207–2213 CrossRef PubMed.
- Y. Tao, Z. Yuan, M. Wei and H. Xiaona, Environ. Monit. Assess., 2012, 184, 4367–4382 CrossRef CAS PubMed.
- R. Hänsch and R. R. Mendel, Curr. Opin. Plant Biol., 2009, 12, 259–266 CrossRef PubMed.
- S. P. Gouvêa, G. L. Boyer and M. R. Twiss, Harmful Algae, 2008, 7, 194–205 CrossRef.
- C. A. Stedmon and R. Bro, Limnol. Oceanogr.: Methods, 2008, 6, 572–579 CrossRef CAS.
- K. P. Tsai, Ecotoxicol. Environ. Saf., 2015, 120, 428–435 CrossRef CAS PubMed.
- Z. X. Wu, N. Q. Gan, Q. Huang and L. R. Song, Environ. Pollut., 2007, 147, 324–330 CrossRef CAS PubMed.
- C. Deng, X. Pan, S. Wang and D. Zhang, Biol. Trace Elem. Res., 2014, 160, 268–275 CrossRef CAS PubMed.
- Y. Polyak, T. Zaytseva and N. Medvedeva, Water, Air, Soil Pollut., 2013, 224, 1–14 CrossRef CAS.
- C. J. Williams, Y. Yamashita, H. F. Wilson, R. Jaffé and M. A. Xenopoulos, Limnol. Oceanogr., 2010, 55, 1159–1171 CrossRef CAS.
- W. Chen, P. Westerhoff, J. A. Leenheer and K. Booksh, Environ. Sci. Technol., 2003, 37, 5701–5710 CrossRef CAS PubMed.
- A. M. McIntyre and C. Guéguen, Chemosphere, 2013, 90, 620–626 CrossRef CAS PubMed.
- Y. Wang, D. Zhang, Z. Shen, C. Feng and J. Chen, PLoS One, 2013, 8, e76633 CAS.
- J. B. Fellman, E. Hood and R. G. Spencer, Limnol. Oceanogr., 2010, 55, 2452–2462 CrossRef CAS.
- F. Qu, H. Liang, Z. Wang, H. Wang, H. Yu and G. Li, Water Res., 2012, 46, 1490–1500 CrossRef CAS PubMed.
- J. Hur, B. M. Lee and K. H. Shin, Chemosphere, 2014, 111, 450–457 CrossRef CAS PubMed.
- S. Aoki, S. Ohara, K. Kimura, H. Mizuguchi, Y. Fuse and E. Yamada, Anal. Sci., 2008, 24, 389–394 CrossRef CAS PubMed.
- C. Yang, Y. Liu, Y. Zhu and Y. Zhang, Mar. Pollut. Bull., 2016, 104, 113–120 CrossRef CAS PubMed.
- L. R. Andrade, R. N. Leal, M. Noseda, M. E. R. Duarte, M. S. Pereira, P. A. Mourão, M. Farina and G. M. Amado Filho, Mar. Pollut. Bull., 2010, 60, 1482–1488 CrossRef CAS PubMed.
- S. Ozturk, B. Aslim and Z. Suludere, Bioresour. Technol., 2010, 101, 9742–9748 CrossRef CAS PubMed.
- L. Gao, X. Pan, D. Zhang, S. Mu, D. J. Lee and U. Halik, Water Res., 2015, 69, 51–58 CrossRef CAS PubMed.
- H. Yoshimura, T. Kotake, T. Aohara, Y. Tsumuraya, M. Ikeuchi and M. Ohmori, J. Appl. Phycol., 2012, 24, 237–243 CrossRef CAS.
- S. A. Mansour and M. M. Sidky, Food Chem., 2002, 78, 15–22 CrossRef CAS.
- C. L. Goodale, J. D. Aber, P. M. Vitousek and W. H. McDowell, Ecosystems, 2005, 8, 334–337 CrossRef CAS.
- K. E. Judd, B. C. Crump and G. W. Kling, Ecology, 2006, 87, 2068–2079 CrossRef PubMed.
- C. Gourlay, M. H. Tusseau-Vuillemin, J. M. Mouchel and J. Garric, Ecotoxicol. Environ. Saf., 2005, 61, 74–82 CrossRef CAS PubMed.
- K. Kalbitz and R. Wennrich, Sci. Total Environ., 1998, 209, 27–39 CrossRef CAS PubMed.
| This journal is © The Royal Society of Chemistry 2017 |

