 Open Access Article
Creative Commons Attribution 3.0 Unported Licence
Digital immunoassay of a prostate-specific antigen using gold nanorods and magnetic nanoparticles†
Liang Zhu‡
ab,
Guohua Li‡ab,
Shuqing Sun *ab,
Hui Tan*c and
Yonghong He
 *ab
*ab
aInstitute of Optical Imaging and Sensing, Shenzhen Key Laboratory for Minimal Invasive Medical Technologies, Graduate School at Shenzhen, Tsinghua University, Shenzhen 518055, People's Republic of China. E-mail: sun.shuqing@sz.tsinghua.edu.cn; heyh@sz.tsinghua.edu.cn
bDepartment of Physics, Tsinghua University, Beijing 100084, People's Republic of China
cThe First Affiliated Hospital of Shenzhen University, Shenzhen Key Laboratory of Neurosurgery, Shenzhen, 518035, China. E-mail: tanhui@iccas.ac.cn
First published on 23rd May 2017
Abstract
Herein, a digital immunoassay was developed by counting highly confined gold nanorod (AuNR) probes with the aid of magnetic nanoparticles (MNPs). MNPs were conjugated with capture antibodies to concentrate the target analytes. AuNRs were conjugated with a mixture of the detection antibody and randomly selected DNA, where the detection antibody was applied to signal the target binding event and DNA was applied to provide sufficient negative charges. The bicomponent AuNR probes in the target-mediated immunocomplexes were eluted and confined onto a positively charged glass slide on the basis of electrostatic attraction for accurate counting. The combination of the magnetic concentration of the target analytes and the confinement of the DNA/antibody AuNR probes results in improved detection efficiency; a good linear range from 0.01 to 10 pg mL−1 and a detection limit of 8 fg mL−1 (∼226 aM) were achieved for the detection of prostate-specific antigen (PSA). The proposed method offers the simultaneous advantages of high sensitivity, digital quantification accuracy, lack of requirement for signal or target amplification, wide dose response curve and low detection cost; thus, it shows good potential in practical applications.
Introduction
Affinity-based immunoassays of antibody–antigen binding are of great importance in the areas of biomedical research and disease diagnostics.1,2 Quantitative analysis methods based on single-molecule detection (SMD) or digital detection are among the most promising immunoassay methods; these systems have aroused a vast amount of attention because they are capable of providing superior resolution and sensitivity compared to ensemble measurements.3–7 The most significant advantage of SMD over ensemble measurements is that it is independent of the signal intensity, which can be influenced by various factors. It is generally accepted that reading a binary signal of 0 or 1 is more reliable than precise measurement of ensemble quantities.Currently, fluorescence imaging approaches are the most popular techniques in SMD. These methods commonly involve two important components: a high-performing optical system and a high-intensity fluorophore reporter. Typical optical systems involve confocal microscopy, flow-based ultrasensitive single-molecule counting systems8 or total internal reflection fluorescence microscopy (TIRFM).9,10 These systems often require high-efficiency collection optics, excellent detectors with high quantum efficiency and low dark noise, prebleaching of impurities and specific facilities to reduce background. Therefore, all these will significantly increase the operational complexity and instrument cost, limiting the practical applications of SMD methods. Fluorophore reporters include organic dyes,9,11,12 quantum dots (Qds),10,13,14 and fluorescent nanoparticles.15–17 However, fluorescent organic dyes are limited by low absorption cross sections,18 photobleaching19 and photoquenching.20 Qds demonstrate the drawbacks of photoblinking and biological toxicity.21 The inherent defects of the fluorophore reporters result in inaccurate detection results; therefore, they represent an important limit to SMD methods.
Gold nanorods (AuNRs) with effective sizes ranging from 10s to 100s of nanometers are plasmonic nanoparticles that have gained much attention because of their extraordinary localized surface plasmon resonance (LSPR) properties.22 A remarkable property of AuNRs is extremely strong selective scattering in the visible region based on their sizes, components and shapes. Typically, the scattering intensity of an individual AuNR may be several orders of magnitude higher than that of a strong fluorescent dye.23 Thus, AuNRs are easily and unambiguously identified from the background using cost-effective and easy-attainable dark-field microscopy. In addition, AuNRs are readily distinguished from impurity particles because of their specific scattering spectrum characterization. These excellent optical properties have enabled many promising applications, such as analytical chemistry, cell imaging,24 photothermal therapy25 and real-time monitoring of chemical reactions at the single-particle level.26 In addition, AuNRs have excellent optical and chemical stability, which is another significant advantage over conventional fluorescence reagents. However, even with these remarkable advantages in their optical properties and detection costs, there are few reports on the application of AuNRs in SMD-based quantitative analysis.
Magnetic beads have gained widespread traction due to their superior performance in the separation and purification of biomolecules.27,28 The main merit of the utilization of magnetic nanoparticles is that the magnetic separation process can be rapidly performed using only a common magnet without the requirement of expensive instrumentation. This simplicity is not available for conventional separation methods, such as centrifugation and bead-packed columns. An interesting feature of magnetic beads is that they can be functionalized with specific biomolecules for DNA hybridization and immunoassays.
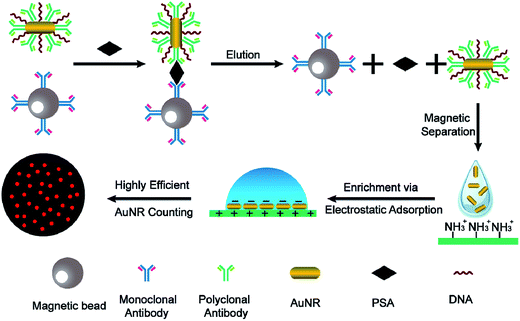
Herein, we report on the proof of concept of a novel digital immunoassay based on single-countable AuNRs and magnetic nanoparticles (MNPs) (Fig. 1). Prostate-specific antigen (PSA) was chosen in this study as the initial target because it is an important indicator for prostate cancer, which is one of the most common diseases in elderly men. MNPs are modified with monoclonal antibodies and AuNRs are modified with a mixture of polyclonal antibodies and randomly selected DNA sequences. In the presence of the target, AuNRs and MNP sandwich the PSA target, forming a PSA-mediated immunocomplex because of the target-specific binding. After removing the excess unbound AuNRs, the binding interactions are disrupted by the addition of elution buffer. Each PSA molecule in the sample solution corresponds to a released AuNR in the elution buffer. Therefore, a positive correlation exists between the target concentration and the number of AuNRs in the elution buffer. The sensitivity to detect PSA is directly related to the sensitivity to detect AuNRs. To enumerate the AuNRs more effectively, the AuNRs are modified with randomly selected DNA sequences to provide sufficient negative charges arising from the phosphate backbone of DNA. This treatment enables the AuNRs to be easily immobilized and subsequently highly confined onto a positively charged APTES-modified glass slide via electrostatic attraction. Simply counting the AuNRs in the confined ensures a relatively high sampling rate. Combined with the single particle identification, an extremely low concentration of AuNRs can also be detected.
Materials and methods
Materials and instruments
Carboxyl-modified magnetic nanoparticles were provided by Enriching Biotechnology Ltd (China). Monoclonal antibody to prostate-specific antigen was purchased from Exbio (11-289-C100, Czech Republic). Rabbit polyclonal to human prostate-specific antigen was purchased from GeneTex. HAuCl4·3H2O, NaBH4, AgNO3, cetyltrimethylammonium bromide (CTAB), prostate-specific antigen (P3235), Traut's reagent, tris(2-carboxyethyl)phosphine (TCEP), Tris–HCl, bovine serum albumin (BSA), sodium citrate, 2-(N-morpholino)ethanesulfonic acid (MES) and polyvinylpyrrolidone (PVP, M.W. 8000) were purchased from Sigma-Aldrich. 1-Ethyl-3-(3-dimethylaminopropyl) carbodiimide hydrochloride (EDC) was purchased from the Tokyo Kasei Kogyo Co. (Japan); working solutions were prepared with ice-cold ultrapure water immediately before use. The nucleic acid sequence (5′-GTG TGG ATA ATA GAG A10-(CH2)6-SH-3′) was purchased from Beijing Genomics Institution (China). A dark field microscope (BX53, Olympus, Japan) equipped with a color CCD camera (DP73, Olympus, Japan) and a 150 W halogen lamp was used to obtain images of the AuNRs. The extinction spectrum was measured by a UV-Vis-NIR spectrophotometer (Cary 5000, Varian, USA). The particle size distributions were measured by a Zetasizer Nano ZS system (Malven, U.K.). The gold content was measured by inductively coupled plasma-atomic emission spectrometry (ICP-AES, JY2000-2, Horiba, France).Conjugation of the monoclonal antibody to MNPs
Magnetic nanoparticles (MNPs, 200 nm) were functionalized with monoclonal antibody according to the manufacturer's instructions. 50 μL of 10 mg mL−1 MNPs were washed twice with 50 mM pH 5.1 MES buffer containing 0.03% SDS. 50 μL of MES buffer and 10 μL of freshly prepared 10 mg mL−1 cold EDC prepared in MES buffer were added and were mixed well by vortex. The MNPs were resuspended and incubated for half an hour at 25 °C. After the incubation, the supernatant was removed. The MNPs were collected and washed once with cold ultrapure water and twice with MES buffer as soon as possible to avoid hydrolysis of the EDC-activated carboxyl groups. The wash buffer was removed, and 5 μg of monoclonal anti-PSA in 50 μL of 50 mM MES buffer was added to the activated MNPs. The activated MNPs were resuspended and incubated for at least 1 hour at 25 °C and 2 hours at 4 °C. After the incubation process, the monoclonal antibody was successfully conjugated to the MNPs. A magnet was applied to collect the MNPs. The coated beads were incubated with 50 μL of 50 mM pH 7.4 tris buffer containing 0.1% SDS for 1 hour at room temperature to quench the non-reacted carboxyl groups. A magnet was applied to collect the MNPs, and 50 μL of 1% BSA (bovine serum albumin) in 0.01 M pH 7.4 PBS buffer was added to the pelleted beads. After incubation for 1 hour, the beads were washed four times with 100 μL of PBS buffer. The obtained monoclonal antibody-coated MNPs were resuspended and stored in 1 mL of pH 7.4 PBS buffer before use.Preparation of the AuNR probes
The synthesis of the AuNRs is described in the ESI.† The basic principle to prepare the Ab/DNA bicomponent AuNR probes is demonstrated in Fig. S1.† It is well known that thiol groups have an excellent affinity to gold element. When the antibody contains a thiol group, it is much more readily immobilized onto the AuNR surface through Au–S bonds. In view of this principle, polyclonal anti-PSA was first modified with Traut's reagent in order to introduce free thiol groups into its amines (Fig. S1a†).29–31 In our method, an aliquot (10 μL) of the polyclonal antibody solution was mixed with 10 μL of 10 mg mL−1 Traut's reagent dissolved in 0.01 M pH 7.4 PBS buffer. Afterwards, the mixture was incubated for 2 hours at 25 °C. Unreacted Traut's reagent was removed through dialysis for about 48 h. The obtained thiolated antibodies can then be used for further biofunctionalization.Subsequently, the as-synthesized AuNR solution was pipetted into a 10 mL centrifuge tube. Excess CTAB molecules on the AuNR surfaces were removed by centrifugation at 8000 rpm several times. The resulting pelleted particles were redispersed in 20 mL of PBS buffer containing 0.1% SDS and mixed well with 20 mL of 10% PVP solution in ethanol. The mixture was vigorously stirred for 24 hours at 42 °C. CTAB molecules coated on the surface of the AuNRs were replaced by a mixture of PVP and SDS (Fig. S1b†). After a period of stirring, the resulting product was centrifuged for 15 min at 8000 rpm to remove the supernatant and then redispersed in 100 μL of 0.01 M PBS buffer 3 more times. 10 μg of thiol-modified polyclonal anti-PSA was added and incubated for 1 hour at room temperature. 0.2 OD (optical density) of TCEP deprotected thiol-DNA (5′-GTG TGG ATA ATA GAG A10-(CH2)6-SH-3′) was added and incubated for 6 hours. In order to stabilize the products, salt solution (10 mM pH 8.0 PBS, 0.3 M NaCl, 4 mM MgCl2, 0.2% SDS) was added in a stepwise manner to ensure the final concentration of NaCl was 0.15 M. This salting procedure was completed in 6 hours with a time interval of 1 hour. The resulting salted AuNR solution was left at room temperature for an additional 12 hours to maximize the loading of the thiol-modified polyclonal anti-PSA and DNA onto the AuNRs. Next, 100 μL of 1% BSA solution was added followed by incubation for 1 hour to passivate the AuNRs. The products were centrifuged for 15 min at 8000 rpm and redispersed in solution containing 0.01 M PBS. This centrifugation procedure was repeated 3 more times to remove the excess unloaded thiol-modified DNA and polyclonal anti-PSA. The final obtained AuNRs were resuspended in 200 μL of solution containing 0.01 M PBS and 0.03% SDS and stored at 4 °C in a refrigerator prior to use.
Detailed detection of PSA
The confinement of the AuNR probes is described in the ESI.† In a typical PSA detection experiment, an aliquot (100 μL) of the actual PSA sample solution and 10 μL of MNP probe solution were mixed well in a 2 mL centrifugal tube and then incubated for 1 hour at room temperature with gentle shaking. A magnet was introduced to collect the MNPs. The collected MNPs were washed three times with PBS buffer. An aliquot (5 μL) of the prepared AuNR probe solution was added, followed by incubation for 2 hours with gentle shaking. The beads were washed 6 times to remove the unbound AuNR probes using a magnet. After the last washing procedure, 10 μL of 4 M urea was added to disrupt the antibody–analyte interactions in the immuno-sandwich complexes. The magnet was introduced to collect the magnetic beads, and the supernatant was transferred to a 200 μL centrifuge tube for quantification. To confine the AuNR probes, 1 μL of the AuNR probes was deposited onto an APTES-modified glass slide. After being allowed to stand for 15 min, a clean coverslip was gently placed onto the slide. The prepared glass slide can be directly observed under a dark field microscope.Results and discussion
Characterization
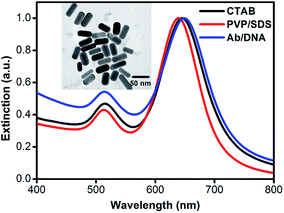
AuNRs with an average aspect ratio of 2.1 and an average effective radius of 17.1 nm were synthesized. Two plasmonic resonance modes32 corresponding to the light extinction along the long axis and the short axis can be clearly seen in Fig. 2. The longitudinal plasmonic mode can be tuned from visible to near-infrared; this is mainly determined by its geometrical shape and the chemical properties of the surrounding medium. Changes in the dielectric properties (i.e., dielectric constant or thickness) lead to peak shifts for the longitudinal modes, providing an indicator to monitor changes in the surface chemistry and the biological recognition process. The as-synthesized AuNRs are capped with CTAB bilayer to facilitate growth along the longitudinal axis and avoid aggregation. A longitudinal LSPR peak at ∼645 nm is observed. However, the CTAB bilayer is tightly packed and hinders the formation of Au–S bonds between thiolated molecules and the AuNR surface, which is not favorable for further biofunctionalization. Moreover, many biomacromolecules, such as DNA and some proteins, are negatively charged; however, CTAB is a typical cationic surfactant. The direct influence is that irreversible aggregation is liable to occur due to nonspecific electrostatic interactions. To prevent these problems, the as-synthesized AuNRs were repeatedly washed to remove superfluous CTAB, and the surfactant mixture of PVP/SDS was applied as an unstable intermediate stabilizing layer to replace the remaining CTAB.33 In addition, the interaction between the carbonyl on the pyrrolidone subunit and the gold atom is much weaker than the Au–S bond. Thiolated molecules can be more easily anchored onto the AuNR surface by replacing the surfactant mixture. A blue-shift of 6 nm in the longitudinal LSPR peak was observed after the CTAB bilayer was exchanged with the surfactant mixture. This is because the blue-shift due to the collapse of the CTAB bilayer overcomes the red-shift due to the PVP/SDS coating. Subsequently, conjugation of AuNRs with Ab/DNA complex leads to a red-shift of ∼10 nm, suggesting a significant change in the surface chemistry properties of the AuNRs. Meanwhile, the intensity ratio of the longitudinal peak to the transverse peak also decreases after Ab/DNA is conjugated onto the AuNR surfaces, which is in agreement with previous observations.34 The transverse peak has no apparent change during the conjugation process because it is insensitive to the dielectric feature. No significant changes in the shape of the extinction spectra or peak broadening are observed, indicating that the AuNRs are not aggregated during the process of biofunctionalization.35–37The successful biofunctionalization process was further confirmed by dynamic light scattering (DLS, Fig. S2†), which is a powerful tool to measure particle size distribution.36,38–40 The average hydrodynamic diameter of the AuNRs shows little change after the surfactant exchange process. However, an average increase of about 25 nm was observed after the Ab/DNA complex was conjugated onto AuNRs, also indicating the successful conjugation process.
Confirmation of the biological functionality of the AuNR probes
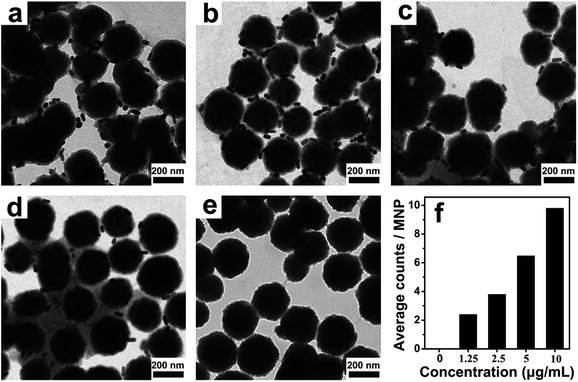
To confirm that the thiolated antibodies still have the same biological functionality to recognize PSA, the sandwich immunocomplexes obtained by the PSA-mediated two-step immunoreactions were imaged by transmission electron microscope (TEM). Unreacted AuNR probes were removed to eliminate potential interference with the experiment results. As can be seen in Fig. 3, most of the MNPs are surrounded by a few AuNRs in the presence of PSA. In contrast, few AuNR probes are seen on the surface of the MNPs in the control experiment where PSA is absent. With increasing PSA concentration, the average number of AuNRs on a single MNP also increased (statistically analyzed from more than 50 MNPs for each concentration), indicating good biological functionality and specificity. The results presented here demonstrated that PSA can be sandwiched by the AuNRs and MMP via target binding events, providing the basis for further quantitative measurements.Confinement of the AuNR probes
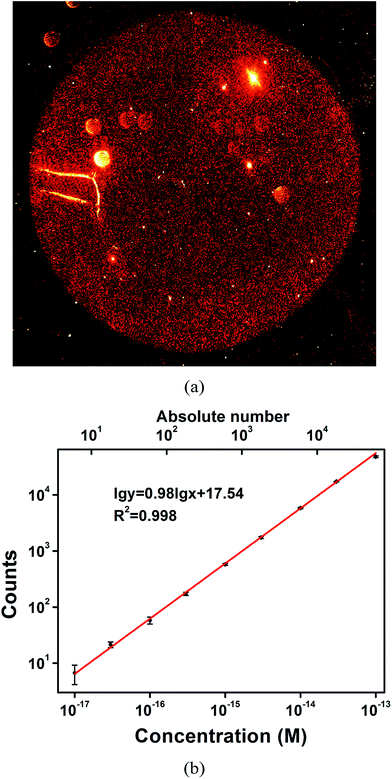
Gold nanoparticles can be immobilized onto an APTES-treated glass slide via electrostatic interactions.41,42 A self-assembled monolayer of gold nanoparticles can thus be simply obtained and has been utilized for real-time monitoring of the dynamic processes of the binding kinetics of biomolecules43 and give good quantitative results for biomolecule sensing.44 In this work, the APTES-based processing method is used to confine gold nanoparticles to ensure relatively high detection efficiency. In addition to single-particle imaging, extremely low concentrations of AuNR can be detected. To qualitatively demonstrate the confinement effect, a 10× objective was used to obtain dark field images. Considering the limited field of view (FOV) of a single dark field image, it is difficult to demonstrate the distribution of the AuNRs and the confinement effect. 1 μL of AuNR probe solution was imaged, and 4 continuous images were obtained to provide the complete picture. After using a cross-correlation algorithm to remove the overlaps between two adjacent images, a reconstructed image was obtained. This reconstructed image clearly reveals the distribution of AuNR on the glass slide surface. As is shown in Fig. 4a, the high-intensity red AuNRs are highly concentrated in a perfect circular region. Meanwhile, very few red dots can be observed outside of this region. The enormous contrast between the inside and outside of the circular region demonstrates the excellent confinement performance. Additional images with higher magnification (40×) to show the confinement effects near the boundary are displayed in Fig. S3.† Therefore, simply counting the confined AuNR probes is sufficient to ensure a high sampling rate and thus a high quantification accuracy. As a comparison, the confinement effect was not as obvious for the polyclonal antibody-conjugated AuNRs (prepared with the same experimental conditions as the AuNR probes except for the addition of DNA).An objective with smaller magnification affords a much greater FOV; however, the quality of the captured images is much poorer. To obtain clearer single AuNR images for higher accuracy in the quantification of AuNRs, a 40× objective was used instead of a 10× objective to image the AuNRs. An in-house-coded program to recognize and count AuNRs was used to reduce labour costs and eliminate the impurity particles as much as possible. Typical recognition results are shown in Fig. S4.† Quantitative results for the detection of the AuNR probes were achieved by counting the red spots in the circular region in a series of concentrations. A calibration curve with a slope of 0.98 and an excellent correlation coefficient of R2 = 0.998 was obtained within the range from 10 aM to 100 fM (Fig. 4b). Most (>90% in the range) of the AuNRs are confined by the glass slide for highly efficient detection, showing good quantitative ability for highly sensitive AuNR detection. Much higher concentrations result in significant electrostatic repulsion and counting errors due to the small distance between two adjacent AuNRs, which reduces the quantification accuracy to some extent. The level of low-attomolar detection is the foundation for accurate counting of the target PSA, which has a 1![[thin space (1/6-em)]](https://www.rsc.org/images/entities/char_2009.gif) :
:![[thin space (1/6-em)]](https://www.rsc.org/images/entities/char_2009.gif) 1 ratio in quantity in principle.
1 ratio in quantity in principle.
Application in PSA detection
PSA concentrations were detected by counting the confined AuNR probes in dark field images, where each AuNR corresponds to a PSA molecule released from the surface of an MNP. Typical subimages of the released AuNR probes at different concentrations of PSA are shown in Fig. 5. These counts have a good positive correlation with the target concentration (Fig. 6). Using the blank samples, the average of the blank signal was ∼115 and the standard deviation was ∼23. This gave an original LOD of 6 fg mL−1 (however, this may not be theoretically correct). We also performed experiments near the LOD of ∼6 fg mL−1 and found the standard deviation to be ∼48, which is much higher than the results from the blank samples. Using the standard formula of LOD = 3 × standard deviation of the signal, the blank signal plus the 3-fold standard deviation (115 + 48 × 3 = 259) was plugged into the fitting equation of log![[thin space (1/6-em)]](https://www.rsc.org/images/entities/char_2009.gif) y = 0.806
y = 0.806![[thin space (1/6-em)]](https://www.rsc.org/images/entities/char_2009.gif) log
log![[thin space (1/6-em)]](https://www.rsc.org/images/entities/char_2009.gif) x + 4.098, giving a final LOD of ∼8 fg mL−1. This is roughly equal to the results from a recent study that was also based on individual AuNRs45 and is at least 104 times higher than a recent study based on single-countable gold nanoparticles using dark field microscopy.46 Remarkably, the fitting coefficient in the log–log scale is 0.806, which is slightly off the linear relationship. This nonlinear relationship may be ascribed to several factors: the relatively high level of background signal, leading to significant errors at low concentrations of PSA; the inefficient probes on the surfaces of magnetic nanoparticles or AuNRs, leading to a low transformation rate at high concentrations of PSA; and the nonlinear isotherms in the target binding kinetics. The linear dynamic range of this method spanned approximately 3 orders of magnitude, ranging from 0.01 to 10 pg mL−1, and the dose response curve is nearly linear within this range. The intensity of the signal increases ∼400-fold when the target concentration increases 1000-fold. This is a distinct advantage over the highly sensitive methods based on signal amplification or target amplification, such as ELISA, scanometric assay47 and bio-barcode.48,49 With these methods, the signal changes are less than 10-fold when the target concentration increases 1000-fold or higher within the linear dynamic range. Remarkably, the much broader dose response curve in our method is favorable to reduce uncertainties from the detection instruments and ensures higher reproducibility.
x + 4.098, giving a final LOD of ∼8 fg mL−1. This is roughly equal to the results from a recent study that was also based on individual AuNRs45 and is at least 104 times higher than a recent study based on single-countable gold nanoparticles using dark field microscopy.46 Remarkably, the fitting coefficient in the log–log scale is 0.806, which is slightly off the linear relationship. This nonlinear relationship may be ascribed to several factors: the relatively high level of background signal, leading to significant errors at low concentrations of PSA; the inefficient probes on the surfaces of magnetic nanoparticles or AuNRs, leading to a low transformation rate at high concentrations of PSA; and the nonlinear isotherms in the target binding kinetics. The linear dynamic range of this method spanned approximately 3 orders of magnitude, ranging from 0.01 to 10 pg mL−1, and the dose response curve is nearly linear within this range. The intensity of the signal increases ∼400-fold when the target concentration increases 1000-fold. This is a distinct advantage over the highly sensitive methods based on signal amplification or target amplification, such as ELISA, scanometric assay47 and bio-barcode.48,49 With these methods, the signal changes are less than 10-fold when the target concentration increases 1000-fold or higher within the linear dynamic range. Remarkably, the much broader dose response curve in our method is favorable to reduce uncertainties from the detection instruments and ensures higher reproducibility.
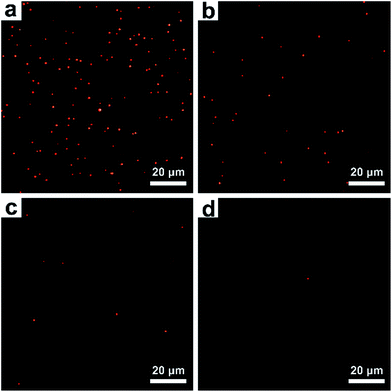 | ||
| Fig. 5 Typical dark field images of AuNRs released from the MNP surface at various PSA concentrations. (a) 100 pg mL−1, (b) 10 pg mL−1, (c) 1 pg mL−1, and (d) 0.1 pg mL−1. | ||
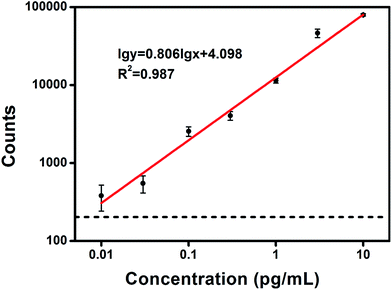 | ||
| Fig. 6 The standard calibration curve for the detection of PSA, shown in log–log scale (the raw data is shown in Table S1†). The broken line indicates the average of the zero background plus the 3-fold standard deviation of the signal near the LOD. Error bars are the standard deviation over three replicate measurements. | ||
Conclusions
In summary, we have reported a promising, highly sensitive digital immunoassay. As demonstrated above, the method proposed in this paper represents an advance in the field of analytical chemistry for three reasons. First, magnetic enrichment of the targets and electrostatic confinement of the single molecule probes ensures relatively high detection efficiency. As a result, a detection limit as low as 8 fg mL−1 for the detection of PSA was achieved in a simple manner without the requirement of target or signal amplification procedures, which are universal strategies to improve detection sensitivity. Second, we show that the proposed method has a wide and linear dose response curve over 3 orders of magnitude of the target concentration due to its digital quantification properties. Third, the utilization of AuNRs with extremely strong scattering enables the realization of digital quantification of the target with instrumentation costs far below those of SMD methods based on fluorescence detection. In the present form of this digital immunoassay, several problems also exist. The background signal is slightly high, which may be ascribed to non-specific interactions between the MNPs and AuNRs. The target binding kinetics appear to not be very effective, which may be ascribed to the immature probe preparation process. The liquid operation is labor-intensive; this may be optimized by the introduction of microfluidic chips. In addition, the repetition of the detection results should be further improved for more reliable results. It is believed that this method has the potential to facilitate earlier clinical diagnosis in the near future.Acknowledgements
This work was supported by the National Science Foundation of China (grants 21273126, 61675113 and 21573124) and the Fundamental Research Program of Shenzhen (JCYJ20140509172959966, JCYJ20160317152359560). HT is grateful for financial support from The Science Technology Innovation Commission of Shenzhen Municipality (GJHZ20160301163644983) and The Health and Family Planning Commission of Shenzhen Municipality (201601019).Notes and references
- J. L. Khatcheressian, P. Hurley, E. Bantug, L. J. Esserman, E. Grunfeld, F. Halberg, A. Hantel, N. L. Henry, H. B. Muss and T. J. Smith, J. Clin. Oncol., 2013, 31, 961–965 CrossRef CAS PubMed.
- J. Mok, M. N. Mindrinos, R. W. Davis and M. Javanmard, Proc. Natl. Acad. Sci. U. S. A., 2014, 111, 2110–2115 CrossRef CAS PubMed.
- S. Howorka and J. Hesse, Soft Matter, 2014, 10, 931–941 RSC.
- M. Cretich, G. G. Daaboul, L. Sola, Ü. M. Selim and M. Chiari, Trends Biotechnol., 2015, 33, 343–351 CrossRef CAS PubMed.
- M. Kühnemund and M. Nilsson, Biosens. Bioelectron., 2014, 67, 11–17 CrossRef PubMed.
- C. Ma and E. S. Yeung, Anal. Bioanal. Chem., 2010, 397, 2279–2284 CrossRef CAS PubMed.
- G. Li, L. Zhu, Z. Wu, Y. He, H. Tan and S. Sun, Anal. Chem., 2016, 88, 10994–11000 CrossRef CAS PubMed.
- J. Todd, B. Freese, A. Lu, D. Held, J. Morey, R. Livingston and P. Goix, Clin. Chem., 2007, 53, 1990–1995 CAS.
- L. Li, X. Tian, G. Zou, Z. Shi, X. Zhang and W. Jin, Anal. Chem., 2008, 80, 3999–4006 CrossRef CAS PubMed.
- L. Li, X. Wang, X. Zhang, J. Wang and W. Jin, Anal. Chim. Acta, 2015, 854, 122–128 CrossRef CAS PubMed.
- J. Hesse, J. Jacak, M. Kasper, G. Regl, T. Eichberger, M. Winklmayr, F. Aberger, M. Sonnleitner, R. Schlapak and S. Howorka, Genome Res., 2006, 16, 1041–1045 CrossRef CAS PubMed.
- J. Todd, B. Freese, A. Lu, D. Held, J. Morey, R. Livingston and P. Goix, Clin. Chem., 2007, 53, 1990–1995 CAS.
- Z. Wang, Q. Xue, W. Tian, L. Wang and W. Jiang, Chem. Commun., 2012, 48, 9661–9663 RSC.
- J. Zhou, Q. X. Wang and C. Y. Zhang, J. Am. Chem. Soc., 2013, 135, 2056–2059 CrossRef CAS PubMed.
- A. Agrawal, C. Zhang, T. Byassee, R. A. Tripp and S. Nie, Anal. Chem., 2006, 78, 1061–1070 CrossRef CAS PubMed.
- X. Zhao, R. Tapec-Dytioco and W. Tan, J. Am. Chem. Soc., 2003, 125, 11474–11475 CrossRef CAS PubMed.
- Q. Xue, D. Jiang, L. Wang and W. Jiang, Bioconjugate Chem., 2010, 21, 1987–1993 CrossRef CAS PubMed.
- U. Reschgenger, M. Grabolle, S. Cavalierejaricot, R. Nitschke and T. Nann, Nat. Methods, 2008, 5, 763–775 CrossRef CAS PubMed.
- P. S. Dittrich and P. Schwille, Appl. Phys. B, 2001, 73, 829–837 CrossRef CAS.
- J. Azoulay, A. Débarre, A. Richard and P. Tchénio, Phys. Rev. Lett., 2006, 96, 374–380 Search PubMed.
- X. Michalet, F. F. Pinaud, L. A. Bentolila, J. M. Tsay, S. Doose, J. J. Li, G. Sundaresan, A. M. Wu, S. S. Gambhir and S. Weiss, Science, 2005, 307, 538–544 CrossRef CAS PubMed.
- C. Burda, X. Chen, R. Narayanan and M. A. El-Sayed, Chem. Rev., 2005, 105, 1025–1102 CrossRef CAS PubMed.
- P. K. Jain, K. S. Lee, I. H. Elsayed and M. A. Elsayed, J. Phys. Chem. B, 2006, 110, 7238–7248 CrossRef CAS PubMed.
- L. Tong, Q. Wei, A. Wei and J. X. Cheng, Photochem. Photobiol., 2009, 85, 21–32 CrossRef CAS PubMed.
- X. H. Huang, I. H. EI-Sayed, W. Qian and M. A. El-sayed, J. Am. Chem. Soc., 2006, 128, 2115–2120 CrossRef CAS PubMed.
- S. Sun, M. Gao, G. Lei, H. Zou, J. Ma and C. Huang, Nano Res., 2016, 9, 1125–1134 CrossRef CAS.
- S. Berensmeier, Appl. Microbiol. Biotechnol., 2006, 73, 495–504 CrossRef CAS PubMed.
- R. S. Molday and D. Mackenzie, J. Immunol. Methods, 1982, 52, 353–367 CrossRef CAS PubMed.
- A. R. Reeves, K. L. Spiller, D. O. Freytes, G. Vunjak-Novakovic and D. L. Kaplan, Biomaterials, 2015, 73, 272–283 CrossRef CAS PubMed.
- F. M. Kievit, Z. R. Stephen, K. Wang, C. J. Dayringer, J. G. Sham, R. G. Ellenbogen, J. R. Silber and M. Zhang, Mol. Oncol., 2015, 9, 1071–1080 CrossRef CAS PubMed.
- K. Won, M. J. Park, H. H. Yoon and J. H. Kim, Ultramicroscopy, 2008, 108, 1342–1347 CrossRef CAS PubMed.
- S. Link and M. A. El-Sayed, Annu. Rev. Phys. Chem., 2003, 54, 331–366 CrossRef CAS PubMed.
- I. C. Pekcevik, L. C. Poon, M. C. Wang and B. D. Gates, Anal. Chem., 2013, 85, 9960–9967 CrossRef CAS PubMed.
- C. Wang and J. Irudayaraj, Small, 2008, 4, 2204–2208 CrossRef CAS PubMed.
- A. Wijaya and K. Hamad-Schifferli, Langmuir, 2008, 24, 9966–9969 CrossRef CAS PubMed.
- J. J. Storhoff, A. A. Lazarides, R. C. Mucic, C. A. Mirkin, R. L. Letsinger and G. C. Schatz, J. Am. Chem. Soc., 2000, 122, 4640–4650 CrossRef CAS.
- J. J. Storhoff, R. Elghanian, R. C. Mucic, C. A. Mirkin and R. L. Letsinger, J. Am. Chem. Soc., 1998, 120, 1959–1964 CrossRef CAS.
- H. Jans, X. Liu, L. Austin, G. Maes and Q. Huo, Anal. Chem., 2009, 81, 9425–9432 CrossRef CAS PubMed.
- L. Tang, S. Li, F. Han, L. Liu, L. Xu, W. Ma, H. Kuang, A. Li, L. Wang and C. Xu, Biosens. Bioelectron., 2015, 71, 7–12 CrossRef CAS PubMed.
- J. Wu, W. Jia, W. Lu and L. Jiang, ACS Appl. Mater. Interfaces, 2012, 4, 6560–6564 CAS.
- L. Xie, X. Yan and Y. Du, Biosens. Bioelectron., 2014, 53, 58–64 CrossRef CAS PubMed.
- N. Nath and A. Chilkoti, Anal. Chem., 2002, 74, 504–509 CrossRef CAS PubMed.
- K. M. Mayer, S. Lee, H. Liao, B. C. Rostro, A. Fuentes, P. T. Scully, C. L. Nehl and J. H. Hafner, ACS Nano, 2008, 2, 687–692 CrossRef CAS PubMed.
- J. Y. Byun, Y. B. Shin, T. Li, J. H. Park, D. M. Kim, D. H. Choi and M. G. Kim, Chem. Commun., 2013, 49, 9497–9499 RSC.
- P. L. Truong, C. Cao, S. Park, M. Kim and S. J. Sim, Lab Chip, 2011, 11, 2591–2597 RSC.
- C. Y. Poon, L. Wei, Y. Xu, B. Chen, L. Xiao and H. W. Li, Anal. Chem., 2016, 88, 8849–8856 CrossRef CAS PubMed.
- W. Cheng, Y. Chen, F. Yan, L. Ding, S. Ding, H. Ju and Y. Yin, Chem. Commun., 2011, 47, 2877–2879 RSC.
- B. K. Oh, J. M. Nam, S. W. Lee and C. A. Mirkin, Small, 2006, 2, 103–108 CrossRef CAS PubMed.
- C. S. Thaxton, R. Elghanian, A. D. Thomas, S. I. Stoeva, J. S. Lee, N. D. Smith, A. J. Schaeffer, H. Klocker, W. Horninger and G. Bartsch, Proc. Natl. Acad. Sci. U. S. A., 2009, 106, 18437–18442 CrossRef CAS PubMed.
Footnotes |
| † Electronic supplementary information (ESI) available: Details experimental section and additional experimental results. See DOI: 10.1039/c7ra00575j |
| ‡ These two authors contribute equally. |
| This journal is © The Royal Society of Chemistry 2017 |

