 Open Access Article
Creative Commons Attribution 3.0 Unported Licence
Experimental and computational modeling studies on silica-embedded NiO/MgO nanoparticles for adsorptive removal of organic pollutants from wastewater†
Amjad El-Qanniab,
Nashaat N. Nassar *a and
Gerardo Vitalea
aDepartment of Chemical and Petroleum Engineering, University of Calgary, Calgary, Alberta T2N 1N4, Canada. E-mail: nassar@ucalgary.ca; Fax: +1 403 210 3973; Tel: +1 403 210 9772
bDepartment of Chemical Engineering, An-Najah National University, P.O. Box 7, Nablus, Palestine
First published on 2nd March 2017
Abstract
Achieving affordable and clean water is one of the greatest global challenges of this century. This is due to the enormous upsurge in the world's population, yet at the same time, the scarcity of fresh water. Far more than that, some regions are awash in fresh water while other regions are afflicted by drought. Accordingly, new technological approaches should be brought to the forefront to tackle the water problem. Hence, this study presents three types of newly in-house prepared silica-embedded NiO and/or MgO nanoparticles, namely; SiO2–NiO, SiO2–MgO, and SiO2–(Ni0.5Mg0.5)O. The properties of these nanoparticles were characterized using XRD, BET, HRTEM, CO2-TPD, and IR spectroscopy. These nanoparticles are applied for the first time to adsorptive removal of different cationic and anionic model organic molecules with different functionalities, namely: methylene blue (MB), neutral red (NR), and acid red 27 (AR27), mimicking pollutants existing in wastewater effluents. It has been found that on a normalized surface area basis, the number of cationic model molecules adsorbed per nm2 of the SiO2–(Ni0.5Mg0.5)O nanoparticles were the highest suggesting the possible synergistic effect between Ni and Mg in the mixed oxide, however, SiO2–NiO showed the highest uptake for the anionic case due to its stability in aqueous solutions. The experimental adsorption isotherms fit well to the Sips model for MB and AR27 indicating a heterogeneous adsorption system. However, a multilayer adsorption behavior was obtained for NR which has been described by the BET model. Computational modeling and DFT calculations of the interaction between the model molecules and the surfaces of the prepared nanoparticles were carried out to get more mechanistic insights into their adsorptive behaviors. The results showed that the adsorbed molecules tend to lie flat on the surface of the materials except for NR which tends to be adsorbed slightly tilted when compared with the others. Additionally, molecular dynamics simulation was performed to gain additional insights into the adsorption behavior of NR in the presence of water. The evolved profile of total energy of the system as a function of simulation time emphasized the eccentric BET adsorption behavior of NR onto these novel nanoparticles.
1. Introduction
The arena of water and wastewater treatment is a cutting-edge topic worldwide as water is an essential resource for drinking, daily public use, industrial processes, and medicine.1 The global water pollution and shortage have been driven by several factors, including: worldwide population growth, competing demands from a variety of users, rapid world industrialization, increasing technical development and living standards, and long-term droughts.2,3 Therefore, with the ongoing spread of a wide range of industrial pollutants into surface and ground water bodies as well as the water shortage crisis, researchers, engineers, environmentalists, and decision makers are striving to find economically viable alternatives and environmentally sound techniques for water and wastewater treatment processes.4 Several physical, chemical and biochemical processes have been reported for removing organic-based pollutants from wastewater bodies.5–7 Typically, these processes are hampered by their ineffectiveness in meeting permissible disposal levels or by their high capital and operating costs. In recent years, nanotechnology, typically in the form of powder nanoparticles or particles integrated with conventional treatment processes, has shown an unprecedented rate in pollution removal and toxicity mitigation.8–12 The uniqueness of these nanoparticles, especially iron-oxide-based ones, is not only their high surface area, but also properties like magnetism, selective surface reactivity, rapid ion delivery, surface plasmonic resonance, quantum confinement, high adsorption affinity, enhanced catalytic activity, dispersibility, and intrinsic reactivity.9,13–19 Hence, these nanoparticles were successfully employed as “nanoadsorbents”,16,17,20 “nanocatalysts”,21–23 and recently as “nanosorbcats”24,25 for cleaning up wastewater. Although a simple search through any scientific search engine with the keywords “nanoadsorbents” and/or “nanocatalysis” would clearly indicate an exponential growth in scientific publications in the past few decades.23,26 However, the concept of “nanosorbcats” was introduced for the first time by our research group,24 and has since been tested by other investigators.25,27,28 It refers to the use of nanoparticles as adsorbent for sequestering the waste organic compounds from wastewater bodies and subsequently as a catalyst for decomposing the adsorbed species into new commodity product. Hence, this allows not only water recyclability and waste hydrocarbons conversion, but also nanosorbcats regeneration. However, to maximize the sustainability of the nanosorbcats, it is important that the developed nanosorbcats be earth abundant, economical and environmentally friendly. Thus, in addition to understanding the adsorption behavior of different organic species, another major purpose of this study is to develop new silica-based nanosorbcats functionalized with active species.Herein, in continuation of previous work on using nanoparticles as adsorbents and catalysts for waste hydrocarbons, we present novel nanomaterials to improve water recyclability and hydrocarbon conversion. Thus, the purposes of this study include: (1) preparing silica-embedded NiO and/or MgO nanoparticles, which are believed to be efficient nanosorbcats for organic adsorption followed by catalytic steam gasification reaction; (2) comparing the adsorptive performances of the prepared nanosorbcats for the adsorption of different pollutants with different functionalities, like methylene blue (MB), neutral red (NR), and acid red 27 (AR27); and (3) carrying out computational modelling to understand the adsorption mechanism and surface activity of the silica-embedded NiO and/or MgO nanoparticles in order to validate the experimental findings. Experimental adsorption isotherms were described by the Sips and BET models. Worth mentioning here that active nanoparticles, NiO and/or MgO, were embedded in silica to keep them robust and stable for subsequent catalytic steam gasification of the adsorbed species as well as regeneration processes. However, the catalytic activity of the prepared nanosorbcats will be addressed in future publications.
2. Materials and methods
2.1 Chemicals and reagents
In a typical preparation of silica-embedded NiO and/or MgO nanoparticles, the following chemicals and reagents were used; nickel nitrate (Ni(NO3)2·6H2O 99.99%), magnesium nitrate (Mg(NO3)2·6H2O 99%), ammonium hydroxide (NH4OH 27% (w/w)), nitric acid (HNO3 70% (w/w)), Ludox AS-40 colloidal silica (SiO2 40% (w/w)) purchased from Sigma-Aldrich (Ontario, Canada), silicic acid (H2SiO3) powder obtained from Matheson Coleman & Bell (New Jersey, USA), and granulated household sucrose (C12H22O11). Potassium bromide (KBr) obtained from Sigma-Aldrich (Ontario, Canada) was used for the infrared analysis. Liquid nitrogen (N2 99.9% ultrahigh purity) purchased from Praxair (Calgary, Canada) was used for the surface area measurements of the prepared nanoparticles. Gas cylinders of helium (He 99.9% ultrahigh purity) and carbon dioxide (CO2 99.9% ultrahigh purity) purchased from Praxair (Calgary, Canada) were used for the surface basicity measurements of the prepared nanoparticles. All chemicals were used as received without further purification.2.2 Adsorbates
Different model molecules with different functionalities and known chemical structures were used as adsorbates in preparing synthetic wastewater samples to understand the adsorption mechanisms; experimentally and computationally. Hence, methylene blue (MB, C16H18ClN3S, Mw = 374 g mol−1, λmax = 625 nm, organics content 82%) and neutral red (NR, C15H17ClN4, Mw = 289 g mol−1, λmax = 539 nm, organics content 90%) were selected as sources of cationic pollutants; while acid red 27 (AR27, C20H11N2Na3O10S3, Mw = 605 g mol−1, λmax = 520 nm, organics content 90%) was selected as a source for an anionic pollutant. All model molecules were purchased from Sigma-Aldrich (Ontario, Canada) and used as received without further purification.2.3 Synthesis of silica-embedded NiO and/or MgO nanoparticles
In brief, silica-embedded NiO (SiO2–NiO) nanoparticles were prepared by adding 4.3 g of colloidal silica to a 1 L glass beaker containing 200 mL of deionized water. The mixture was agitated using a magnetic stirrer (300 rpm) for 2 min until a homogenous solution was obtained. Then, while keeping the magnetic stirring at 300 rpm, 16.8 g of Ni(NO3)2·6H2O was added to the mixture. After complete dissolution of the nickel salt, 13.0 g of granulated household sucrose was added to the mixture. Afterward, 1.5 mL of HNO3 was added dropwise to the mixture. The mixture was magnetically stirred at 300 rpm and 293 K for 30 min to produce a homogeneous blackish solution. The second type, silica-embedded MgO (SiO2–MgO) nanoparticles were prepared by adding 4.0 mL of NH4OH dropwise to another 1 L glass beaker containing 300 mL of deionized water, then, 4.0 g of H2SiO3 was added to the mixture and agitated using a magnetic stirrer for 10 min at 300 rpm. After that, 20.0 g of granulated household sucrose and 24.0 g of Mg(NO3)2·6H2O were added to the mixture. After complete dissolution of the magnesium salt, 4.0 mL of HNO3 was added dropwise to the mixture. The mixture was magnetically stirred at 300 rpm and 293 K for 30 min to produce a homogeneous brownish solution. For the sake of studying the possible synergistic effect of bimetallic nanoparticles towards adsorption of cationic and anionic pollutants, silica-embedded NiO and MgO (at a ratio of 0.5![[thin space (1/6-em)]](https://www.rsc.org/images/entities/char_2009.gif) :
:![[thin space (1/6-em)]](https://www.rsc.org/images/entities/char_2009.gif) 0.5) nanoparticles were also prepared in this study. Thus, the third bimetallic type, silica-embedded NiO and MgO (SiO2–(Ni0.5Mg0.5)O) nanoparticles were prepared by adding 5.1 g of colloidal silica to a third 1 L beaker containing 225 mL of deionized water. The mixture was agitated using a magnetic stirrer for 2 min until a homogenous solution was obtained. Then, while keeping the magnetic stirring, 9.9 g of Ni(NO3)2·6H2O and 9.1 g of Mg(NO3)2·6H2O were added to the mixture. After complete dissolution of the nickel and magnesium salts, 15.0 g of granulated household of sucrose and 1.5 mL of HNO3 were added to the mixture. The mixture was magnetically stirred at 300 rpm and 293 K for 30 min to produce a homogeneous greyish solution. Afterward, all glass beakers were then placed in the oven at 373 K for 48 h to evaporate the water. After 48 h, dried solid materials looking like sponge cakes were obtained. These solid materials were replaced in the oven at 523 K for 12 h. Eventually, all solid materials were taken out, separately, from the oven and then milled in the fume hood until homogeneous powders were obtained and then, calcined in the oven at 1073 K for 3 h in a flow of air and ramping at 5 K min−1. Further details for each nanoparticle's synthesis can be found in the (ESI, Section S1†). In addition, the estimated NiO and MgO content for all prepared nanoparticles can be found in (ESI, Section S2†).
0.5) nanoparticles were also prepared in this study. Thus, the third bimetallic type, silica-embedded NiO and MgO (SiO2–(Ni0.5Mg0.5)O) nanoparticles were prepared by adding 5.1 g of colloidal silica to a third 1 L beaker containing 225 mL of deionized water. The mixture was agitated using a magnetic stirrer for 2 min until a homogenous solution was obtained. Then, while keeping the magnetic stirring, 9.9 g of Ni(NO3)2·6H2O and 9.1 g of Mg(NO3)2·6H2O were added to the mixture. After complete dissolution of the nickel and magnesium salts, 15.0 g of granulated household of sucrose and 1.5 mL of HNO3 were added to the mixture. The mixture was magnetically stirred at 300 rpm and 293 K for 30 min to produce a homogeneous greyish solution. Afterward, all glass beakers were then placed in the oven at 373 K for 48 h to evaporate the water. After 48 h, dried solid materials looking like sponge cakes were obtained. These solid materials were replaced in the oven at 523 K for 12 h. Eventually, all solid materials were taken out, separately, from the oven and then milled in the fume hood until homogeneous powders were obtained and then, calcined in the oven at 1073 K for 3 h in a flow of air and ramping at 5 K min−1. Further details for each nanoparticle's synthesis can be found in the (ESI, Section S1†). In addition, the estimated NiO and MgO content for all prepared nanoparticles can be found in (ESI, Section S2†).
2.4 Characterization of prepared silica-embedded NiO and/or MgO nanoparticles
2.5 Adsorption experiments
Adsorption of model molecules (i.e., MB, NR, and AR27) onto silica-embedded NiO and/or MgO nanoparticles was performed individually at 293 K. Batch adsorption experiments were carried out by adding a specified mass (about 0.10 g) of the silica-embedded NiO and/or MgO nanoparticles to a set of 25 mL vials containing 10 mL of aqueous solutions with initial concentrations ranging from 15 to 1000 μmol L−1 of each model molecule at neutral pH of 7.0 ± 0.1. The vials were tightly sealed to avoid any loss of water by evaporation. Adsorption took place by shaking the vials for 24 h on a Wrist Action shaker (Burrel, Model 75-BB) to ensure that the equilibrium was attained. In all experiments, the nanoparticles containing adsorbed model molecules were separated from the mixtures by centrifugation for 10 min at 5000 rpm using an Eppendorf Centrifuge 5804 (Thermo Fisher Scientific Inc., Canada), and the supernatants were decanted. The nanoparticles containing adsorbed model molecules were taken for the IR analysis. The residual concentrations of each model molecule in the supernatants were measured by Evolution™ 260 UV-vis spectrophotometer (Thermo Fisher Scientific Inc., Canada) (UV-vis) at wavelengths of 625, 539, and 520 nm for MB, NR, and AR27, respectively. Pure deionized water identical to that used for preparing model molecules solutions was used as a blank. Calibration curves of UV-vis absorbance at the aforementioned wavelengths against the concentration were first established, using standard solutions with known concentrations of each model molecule. Well fitted regression equations were obtained with linear regression coefficient (R2) close to unity. Typical standard errors in the model molecules concentration measurements ranged from ±0.5 to 8.0, ±0.7 to 10.4, and ±0.3 to 5.0 μmol L−1 for MB, NR, and AR27, respectively. The adsorption uptake per surface area of nanoparticles and nanoparticle adsorption affinity were determined based on the constructed isotherms and mass balance analysis. All experiments were performed in triplicate to confirm reproducibility. The amount adsorbed of each model molecule, Qe (molecules per nm2 of nanoparticles), was calculated as shown in eqn (1).30,31
 | (1) |
Macroscopic solution phase adsorption isotherms for MB, NR, and AR27 model molecules were performed to quantify surface coverage onto silica-embedded NiO and MgO nanoparticles. Recently, our research group has concluded that the surface area normalized isotherm data is the best analysis technique for developing a mechanistic interpretation for any model molecule adsorption onto nanoparticles surfaces.30,31 Thus, our adsorption results were presented on a normalized BET surface area basis (molecules per nm2). To further understand the adsorption behaviour, the experimental isotherm data were fitted to the Sips model,32,33 also known as ‘‘Langmuir–Freundlich” isotherm,33 and the BET model34 expressed by eqn (2) and (3), respectively.
 | (2) |
 | (3) |
 | (4) |
2.6 Computational modeling
Computational modeling was carried out to get some insights into the adsorption interactions of AR27, MB and NR molecules with the surfaces of NiO, MgO and amorphous silica nanoparticles. NiO and MgO have the rocksalt structure (similar to many other binary oxides) and our interest in them is going to be focused on their surface interactions with three model molecules (AR27, MB, and NR). Starting from the experimental structural data within BIOVIA Material Studio 2017 (MS2017) database,36 we created two low index surfaces, the (100) and (111), for each oxide (i.e., NiO and MgO) and also an amorphous silica surface was created to carry out our studies of AR27, MB and NR interactions with these selected surfaces. The solid-solution (Ni0.5Mg0.5)O was not studied because producing a single accurate structural model for this case requires the generation of supercells, where several Ni and Mg atom configurations within the supercell can be generated, which in turn will produce many feasible mixed (Ni0.5Mg0.5)O models complicating the selection of a single model for the calculations. Also, the lack of accuracy might occur by using mixed forcefields for the oxygen atoms present in the solid crystalline supercell containing Mg and Ni atoms at the same time. For this part of the computational studies, we used the modules Forcite and Adsorption Locator included within the commercial modeling software MS2017.36 BIOVIA Forcite is an advanced classical molecular mechanics tool, designed to work with a wide range of forcefields, allowing fast energy calculations and reliable geometry optimizations of molecules and periodic systems. In our study, Forcite was used to geometrically optimize the AR27, MB, NR and H2O molecules, to optimize the NiO, MgO and amorphous silica unit cells and to relax the surface atoms of the created low index surfaces prior to their use in the adsorption study. For the latter task, we used BIOVIA Adsorption Location module which is based on simulated annealing (a metaheuristic algorithm for locating a good approximation to the global minimum of a given function in a large search space37,38) allowing in this way identification of the possible adsorption configurations by carrying out Monte Carlo searches of the configurational space of the selected surfaces-model molecules systems as the temperature is slowly decreased. In order to identify additional local energy minima, the process is repeated several times.Atomistic simulations of inorganic–organic interfaces require an accurate description of interatomic forces, and thus, for the present study we employed BIOVIA COMPASSII forcefield as it can simulate not only organic molecules but also bulk metal oxides as well as interactions between them.36,39 The Condensed-phase Optimized Molecular Potentials for Atomistic Simulation Studies (COMPASS) is the first ab initio forcefield that has been parametrized and validated using condensed-phase properties in addition to various ab initio and empirical data for molecules in isolation. Consequently, this forcefield enables accurate and simultaneous prediction of structural, conformational, vibrational, and thermophysical properties that exist for a broad range of molecules in isolation and in condensed phases including interfaces and mixtures.39–45 Currently, the coverage of this forcefield includes the most common organics, inorganic small molecules, polymers, some metal ions, metal oxides, and metals.36 The following subsections show the details of the theoretical calculations.
For the simulation, the system was defined as a periodic slab with the (100) face because it is the most probable exposed surface on the MgO or NiO materials. The dimensions of the surface were similar to those used in the Adsorption Locator calculations (i.e. ∼3 nm × ∼3 nm). The thickness of the slab was set to ∼2 nm and the three upper layers of atoms were allowed to freely evolve without any geometrical constraints during the calculations. The rest of the atoms were fixed to the geometrically optimized values in the bulk. A vacuum of 23 nm was imposed on top of the oxide surface and a slab of about 2.5 nm containing 500 water molecules and 5 NR molecules, generated by the BIOVIA Amorphous Cell module and the COMPASII forcefield, was added close to the oxide surface within the periodic cell.
3. Results and discussions
3.1 Characterization studies
| Measurement | SiO2–NiO | SiO2–MgO | SiO2–(Ni0.5Mg0.5)O |
|---|---|---|---|
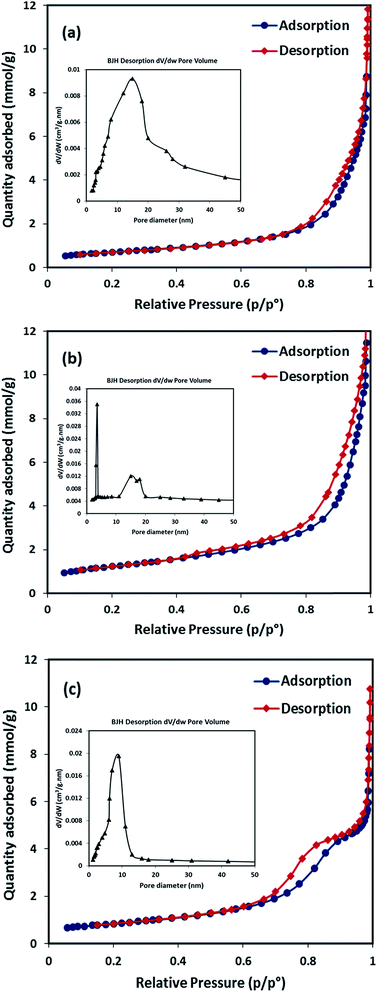
| BET specific surface area (m2 g−1) | 56 | 98 | 44 |
| External surface area, t-plot (m2 g−1) | 52 | 89 | 40 |
| Micropore area, t-plot (m2 g−1) | 4 | 9 | 4 |
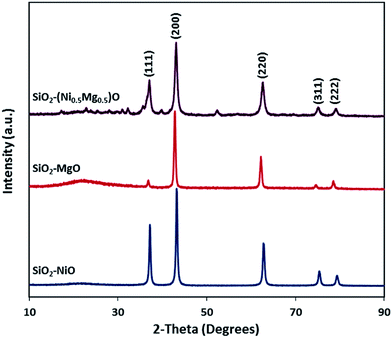
| Pore width (nm), BJH analysis | 15 | 3.5 | 9 |
| Pore volume × 102 (cm3 g−1), BJH analysis | 42 | 52 | 25 |
| Miller planes | MgO | SiO2–MgO | |
|---|---|---|---|
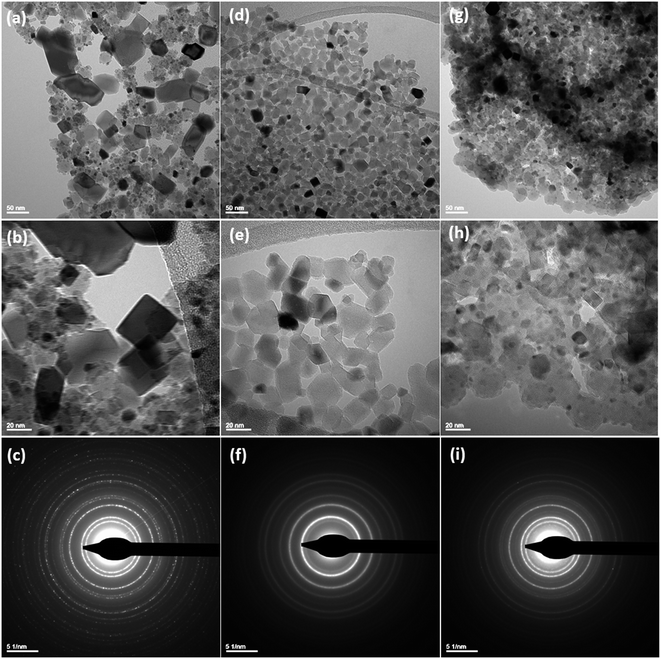
| Reported XRD d [Å] | Experimental by XRD d [Å] | Experimental by SAED d [Å] | |
| (1 1 1) | 2.4220 | 2.4401 | 2.4376 |
| (2 0 0) | 2.0975 | 2.1117 | 2.1016 |
| (2 2 0) | 1.4832 | 1.4919 | 1.4975 |
| (2 2 2) | 1.2110 | 1.2177 | 1.2132 |
| (4 0 0) | 1.0488 | — | 1.0578 |
| (3 3 1) | 0.9624 | — | 0.9576 |
| (4 2 2) | 0.8567 | — | 0.8658 |
| Miller planes | NiO | SiO2–NiO | |
|---|---|---|---|
| Reported XRD d [Å] | Experimental by XRD d [Å] | Experimental by SAED d [Å] | |
| (1 1 1) | 2.4111 | 2.4166 | 2.4188 |
| (2 0 0) | 2.0881 | 2.0920 | 2.0943 |
| (2 2 0) | 1.4765 | 1.4786 | 1.4845 |
| (3 1 1) | 1.2592 | 1.2607 | 1.2666 |
| (2 2 2) | 1.2056 | 1.2071 | 1.2071 |
| (4 0 0) | 1.0441 | — | 1.0532 |
| (3 3 1) | 0.9581 | — | 0.9509 |
| (4 2 2) | 0.8525 | — | 0.8636 |
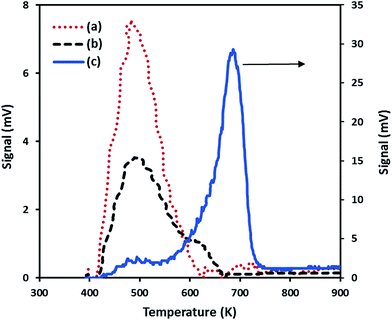
| Nanoparticles | CO2 uptake (μmol g−1) | Tmax (K) |
|---|---|---|
| SiO2–NiO | 90 | 484 |
| SiO2–MgO | 1148 | 688 |
| SiO2–(Mg0.5Ni0.5)O | 130 | 490 |
The low basicity found for the SiO2–(Mg0.5Ni0.5)O nanoparticles seems to indicate two possibilities: first, Ni atoms were more exposed on the surface than the Mg atoms in the prepared solid-mixture NiO–MgO, and thus, less strong basic sites for CO2 adsorption. Second, the presence of Ni affected not only the basic properties of Mg in the mixture of NiO–MgO; but also the total surface area as was experimentally observed and described in Section 3.1.2, and thus, less basic sites for adsorption. Interestingly, the combination of Ni and Mg in the preparation of SiO2–(Mg0.5Ni0.5)O nanoparticles produced a material with half of the crystalline domain sizes of SiO2–NiO and SiO2–MgO. Additionally, embedding the bimetallic nanoparticles in the silica may have caused less surface area, and thus, reducing the basic sites for CO2 adsorption.
3.2 Adsorption isotherms
Fig. 7 shows the experimental isotherm data obtained together with the fit of the Sips and BET models for MB, NR, and AR27 model molecules onto silica-embedded NiO and/or MgO nanoparticles at a temperature of 293 K. The estimated parameters of the Sips and BET models are listed in Table 5. As seen in Fig. 7, a good agreement was achieved between the experimental data and the Sips and BET isotherm models, this was also indicated by the low values of χ2 as shown in Table 5. Clearly, all silica-embedded NiO and/or MgO nanoparticles succeeded in removing MB (Fig. 7a). The adsorption of MB increased sharply at low equilibrium concentration and further gradually increased at high concentration, suggesting that silica-embedded NiO and/or MgO nanoparticles have a high adsorption affinity for MB even at low concentration. This was also indicated by the closeness in Ks values (Table 5). Worth mentioning here that there was a clear observation on color change, the blue color of MB before adsorption became almost colorless after adsorption. As seen, when uptake normalized to BET surface area, there are significant differences in the adsorption of MB molecule onto silica-embedded NiO and MgO nanoparticles. The bimetallic SiO2–(Mg0.5Ni0.5)O nanoparticles were the best adsorbents towards MB adsorption (Fig. 7a), this could be attributed to the possible synergistic effect which may have enhanced the adsorption selectivity towards MB heteroatoms, mainly nitrogen atoms, followed by SiO2–NiO and then SiO2–MgO nanoparticles. These findings were also confirmed by the Qm values (Table 5) estimated from the Sips model. In fact, such synergistic findings agree well with many publications in literature. For instance, Nassar and co-authors,61–63 investigated the synergistic effect of in-house prepared NiO and PdO nanosorbcats supported on either fumed silica, titanium, or alumina towards asphaltenes adsorption followed by oxidation and/or steam gasification processes. In the adsorption part, the authors noticed that bimetallic nanosorbcats showed higher uptake than monometallic ones which was attributed to the synergistic effect of PdO and NiO that led to different unified selectivities towards the heteroatoms of asphaltene molecules.61 Li et al.,64 reviewed many rational design of nanomaterials for water treatment, the authors indicated that the synergistically multi-functionalized nanomaterials would pave the way for new adsorption applications that could be easily integrated with the current conventional water and wastewater treatment systems.65 There are many other investigations on the synergistic effect of graphene and metal-oxide-based adsorbents for organics and dyes removal66–68 which underpin our findings. One more thing that is important to look at is the ns values (Sips heterogeneity factor). The Sips isotherm model is used to predict the adsorption on heterogeneous system circumventing the limitation of the rising adsorbate concentration associated with Freundlich isotherm model.31,69 Thus, the value of ns in the Sips model plays a major role in determining the interaction type between MB and the surface of silica-embedded NiO and/or MgO nanoparticles. It is related to the existence of lateral interactions between adsorbed molecules which is not considered in the Langmuir theory.31,70 Table 5 shows the ns values of less than 0.5 for SiO2–NiO and SiO2–(Mg0.5Ni0.5)O nanoparticles. This suggests that these nanoparticles may have heterogeneous surfaces with adsorption sites that have different adsorption energies. While the ns value of SiO2–MgO nanoparticles is close to one, this suggests that these nanoparticles portray saturation surface coverage and have more homogenous surface.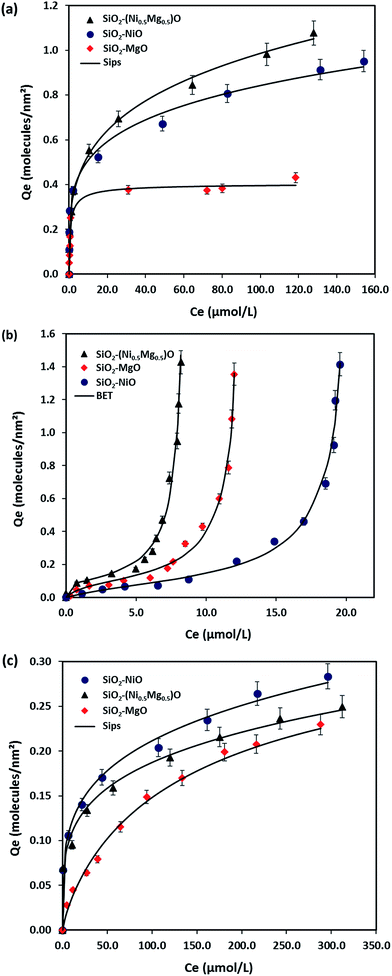 | ||
| Fig. 7 Macroscopic solution phase adsorption isotherms of (a) MB, (b) NR, and (c) AR27. Experimental conditions are: nanoparticles dose, 10 g L−1; shaking rate, 200 rpm; contact time, 24 h; and temperature, 293 K; pH, 7.0. The symbols are experimental data, and the solid lines are the Sips and the BET models (eqn (2) and (3)). | ||
| Model molecule | Nanoparticles | Sips model parameters | |||
|---|---|---|---|---|---|
| Ks (L μmol−1)ns | Qm (molecules per nm2) | ns (unitless) | χ2 | ||
| MB | SiO2–NiO | 1.17 | 1.87 | 0.48 | 1.58 × 10⁻³ |
| SiO2–MgO | 1.20 | 0.51 | 0.97 | 1.77 × 10⁻³ | |
| SiO2–(Mg0.5Ni0.5)O | 1.21 | 2.72 | 0.34 | 9.05 × 10⁻⁴ | |
| AR27 | SiO2–NiO | 0.13 | 0.54 | 0.31 | 4.80 × 10⁻⁴ |
| SiO2–MgO | 0.016 | 0.37 | 0.53 | 9.13 × 10⁻⁴ | |
| SiO2–(Mg0.5Ni0.5)O | 0.12 | 0.41 | 0.49 | 1.50 × 10⁻⁵ | |
| Model molecule | Nanoparticles | BET model parameters | |||
|---|---|---|---|---|---|
| KL (L nm−2) | KU (L nm−2) | Qm (molecules per nm2) | χ2 | ||
| NR | SiO2–NiO | 0.90 | 0.08 | 9.33 × 10⁻² | 5.37 × 10⁻² |
| SiO2–MgO | 0.25 | 0.05 | 9.56 × 10⁻² | 4.77 × 10⁻² | |
| SiO2–(Mg0.5Ni0.5)O | 4.60 | 0.11 | 1.19 × 10⁻² | 5.09 × 10⁻² | |
Fig. 7b shows the experimental isotherm data obtained together with the fit of the BET model for NR molecule adsorption onto the silica-embedded NiO and/or MgO nanoparticles at a temperature of 293 K. An excellent agreement between the experimental data and the BET model is seen in Fig. 7b and indicated by the low values of χ2 (Table 5). Although, NR was used as another cationic pollutant in this study, an eccentric type of adsorption was noticed in comparison with the MB. The adsorbed amount of NR molecules increased exponentially with the equilibrium concentration. The BET model describes the multilayer adsorption phenomena for gas–solid and liquid–solid equilibrium systems.71–73 Such adsorption isotherm characterizes the multilayer adsorption on non-porous solids with weak adsorbent–adsorbate interactions.73,74 Nassar et al.,73 and Franco et al.,74 indicated that with such adsorption behavior the interaction between an adsorbate (i.e., NR in this case) and an adsorbed layer is greater than the interaction with the adsorbent surface (i.e., silica-embedded NiO and MgO nanoparticles) where adsorption increases exponentially. As seen in Fig. 7b, SiO2–(Mg0.5Ni0.5)O nanoparticles seem again to be the best adsorbents for the second cationic pollutant (NR), this was also indicated by the highest estimated BET constants shown in Table 5, which confirms their possible synergistic effect. Surprisingly, SiO2–MgO nanoparticles seem to be the best adsorbents towards NR than SiO2–NiO nanoparticles. A reasonable explanation for this could be linked to the absence of C–S bonds in the NR structure, which enabled a better interaction and adsorption affinity between the first layer of adsorbed NR onto SiO2–MgO nanoparticles. This was also indicated by the KL values shown in Table 5. Similar adsorption trends and behaviors of different types of pollutants, including; dyes, phenols, and olive mill wastewaters, can be found elsewhere.72,73,75,76
Fig. 7c shows the adsorption of an anionic pollutant source (AR27) onto silica-embedded NiO and/or MgO nanoparticles. Clearly, the adsorption affinities of SiO2–NiO and SiO2–(Mg0.5Ni0.5)O nanoparticles are higher than the SiO2–MgO nanoparticles, as seen in Fig. 7c and indicated by the Ks values (Table 5). As seen in Fig. 7c, SiO2–NiO nanoparticles appear to be the best adsorbents towards AR27 adsorption as also indicated by its highest Qm values (Table 5). This could be attributed to the heterogeneity of the nanoparticles surface as they appear to have the lowest value of ns, which implies that these nanoparticles surface are heterogenous with adsorption sites that have different adsorption energies. Although, the order of SiO2–(Mg0.5Ni0.5)O nanoparticles comes to the second place, but apparently, the synergistic effect made its adsorptive behavior towards AR27 better than SiO2–MgO nanoparticles. This was also indicated by the estimated Sips model constants shown in Table 5. Recalling the CO2-TPD results shown previously in Section 3.1.3, we proposed that Ni atoms were more exposed on the surface than the Mg atoms in the prepared solid-mixture NiO–MgO, and thus, the low basicity was found for the SiO2–(Mg0.5Ni0.5)O nanoparticles. This proposal seems to be reasonable by looking at the adsorption isotherm results (Fig. 7). We might conclude here that SiO2–NiO nanoparticles are the best or the optimum adsorbents for all model molecules tested in this study. Although, SiO2–(Mg0.5Ni0.5)O nanoparticles showed better adsorption performance with the cationic molecules (MB and NR), however, NiO seems to be the driving force of the synergistic effect of these nanoparticles rather than MgO. This could be attributed to the well-known stability of NiO nanoparticles in aqueous solutions.77,78
3.3 Model molecules adsorption followed by IR
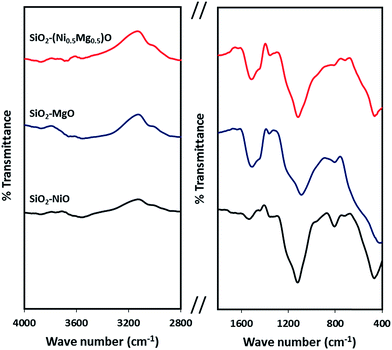
Fig. 8 shows the infrared spectra of the silica-embedded NiO and/or MgO nanoparticles before and after adsorption. The signals of the framework regions (4000–2800 cm−1) and (1800–400 cm−1) of the prepared nanoparticles were clearly modified by signals corresponding to MB, NR, and AR27 upon their adsorption onto these nanoparticles. For instance, the IR modifications appear at 700–600 cm−1 (Fig. 8a) could be assigned to the C–S stretching vibration,56 while IR signals at 3600 cm−1 (Fig. 8b) could be assigned to the asymmetrical stretching vibration of N–H bond, and signal appears at 1370 and 1247 cm−1 (Fig. 8c) might correspond to N![[double bond, length as m-dash]](https://www.rsc.org/images/entities/char_e001.gif) N stretching vibration79 and to the –SO3– asymmetric stretching vibration, respectively. Interestingly, noticeable changes to the –OH stretching vibrations at around 3700–3400 cm−1 emerge significantly in the spectra of SiO2–MgO and SiO2–(Mg0.5Ni0.5)O nanoparticles, while it is not that significant for SiO2–NiO nanoparticles. A reasonable explanation could be drawn here is that a partial hydration of MgO proceeded via water dissociation at the oxide surface, and thus, breakup of Mg2+–O2− surface elements, and their subsequent solvation led to form surface Mg(OH)2 (ref. 80) which in our case seems to be affecting the adsorption of the model molecules onto MgO. Baumann et al.,80 concluded that MgO nanoparticles, which were cubic in shape, dissolved with a significantly smaller dissolution rate in water when their size distribution is in the range 10–1000 nm. This confirms that the adsorption properties of nanoparticles do not depend only on the surface area but also related to the nanosize, nanocrystal shape, morphology, and polar surfaces.30,31,80,81 Moreover, the intensity of these changes is slightly bigger in case of AR27 (Fig. 8c) at 3690 cm−1, this could be attributed to the extra OH exists in the AR27 structure. Although, our prepared SiO2–MgO nanoparticles succeeded in adsorbing the model molecules and the nano-MgO may be more stable when embedded in silica than when the nano-MgO is alone, however, their performance in the aqueous solutions was the worst. On the other hand, NiO nanoparticles are more stable in aqueous solutions;77,78 thus, the formation of the hydroxylated surface is less prone to occur. This stability seems to be supported by the IR spectra (region 3700–3400 cm−1) where no increase of hydroxyls occurred for SiO2–NiO nanoparticles after the adsorption (Fig. 8). For the SiO2–MgO and SiO2–(Mg0.5Ni0.5)O clear IR band intensity changes on the –OH bending vibration mode are seen at around 1650–1370 cm−1, in addition to IR band shifts with different intensities at around 1000–400 cm−1 indicating how the aqueous adsorption of the model molecules affected the IR vibration of the employed nanoadsorbents.
N stretching vibration79 and to the –SO3– asymmetric stretching vibration, respectively. Interestingly, noticeable changes to the –OH stretching vibrations at around 3700–3400 cm−1 emerge significantly in the spectra of SiO2–MgO and SiO2–(Mg0.5Ni0.5)O nanoparticles, while it is not that significant for SiO2–NiO nanoparticles. A reasonable explanation could be drawn here is that a partial hydration of MgO proceeded via water dissociation at the oxide surface, and thus, breakup of Mg2+–O2− surface elements, and their subsequent solvation led to form surface Mg(OH)2 (ref. 80) which in our case seems to be affecting the adsorption of the model molecules onto MgO. Baumann et al.,80 concluded that MgO nanoparticles, which were cubic in shape, dissolved with a significantly smaller dissolution rate in water when their size distribution is in the range 10–1000 nm. This confirms that the adsorption properties of nanoparticles do not depend only on the surface area but also related to the nanosize, nanocrystal shape, morphology, and polar surfaces.30,31,80,81 Moreover, the intensity of these changes is slightly bigger in case of AR27 (Fig. 8c) at 3690 cm−1, this could be attributed to the extra OH exists in the AR27 structure. Although, our prepared SiO2–MgO nanoparticles succeeded in adsorbing the model molecules and the nano-MgO may be more stable when embedded in silica than when the nano-MgO is alone, however, their performance in the aqueous solutions was the worst. On the other hand, NiO nanoparticles are more stable in aqueous solutions;77,78 thus, the formation of the hydroxylated surface is less prone to occur. This stability seems to be supported by the IR spectra (region 3700–3400 cm−1) where no increase of hydroxyls occurred for SiO2–NiO nanoparticles after the adsorption (Fig. 8). For the SiO2–MgO and SiO2–(Mg0.5Ni0.5)O clear IR band intensity changes on the –OH bending vibration mode are seen at around 1650–1370 cm−1, in addition to IR band shifts with different intensities at around 1000–400 cm−1 indicating how the aqueous adsorption of the model molecules affected the IR vibration of the employed nanoadsorbents.
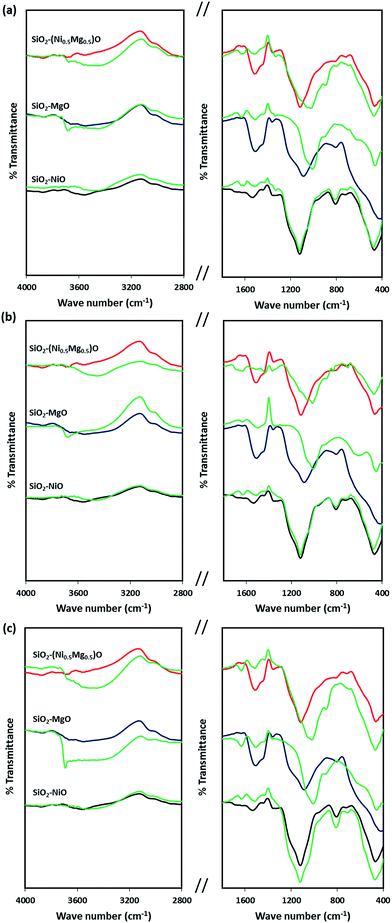 | ||
| Fig. 8 Infrared spectra of silica-embedded NiO and/or MgO nanoparticles before and after adsorption of model molecules (a) MB, (b) NR, and (c) AR27 onto these nanoparticles (green spectra). | ||
3.4 Computational modeling results
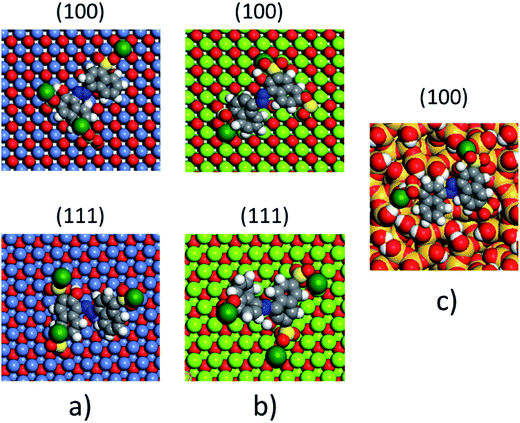
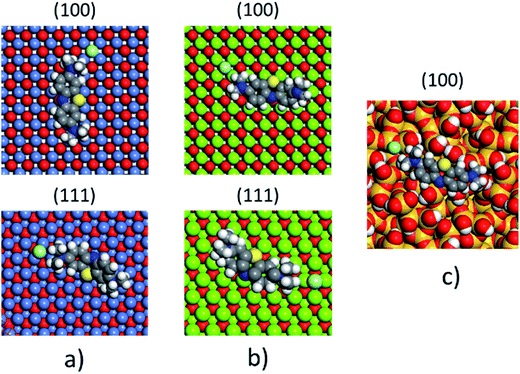
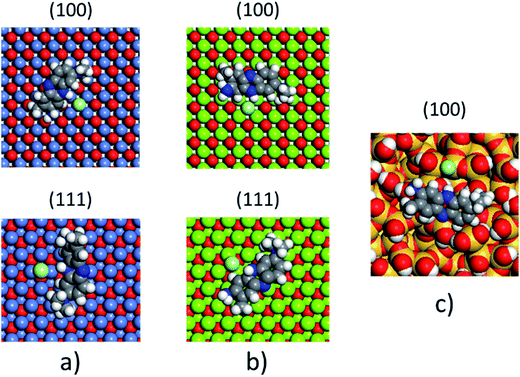
The non-polar (100) surface is the most stable surface termination of the rock-salt type compounds being indeed the natural cleavage plane in this structure. This is due to the close packed bulk-like structure having equal amounts of anions and cations on each of these (100) planes.82 On the other hand, the polar (111) surface is much less stable and it is known to reconstruct to form different octopolar terminations with 2 × 2 periodicities (metal and oxygen terminated) to get stabilized.83,84 However, in the presence of water, the (111) facet can be greatly stabilized by the hydroxylation of the surface.85 Also, for the particular case of MgO, it has been found that nanocrystalline MgO can be dissolved fast in water if having sizes below 10 nm at pH ≥ 10.80 On the contrary, if the size distribution is within the range of 10 to 1000 nm the crystals dissolve with a significantly smaller dissolution rate in water and the bigger the crystals the smaller the dissolution rate.80 Thus, the previous information needs to be taken into account, for the samples with MgO, to understand the obtained experimental adsorption results. Calculations of the adsorption of AR27, MB, NR and water molecules onto the two surfaces of the oxides of nickel and magnesium were carried out to get some atomistic insight into the complex interaction of these molecules with the selected surfaces. Fig. 9–11 illustrate the adsorption of one molecule of AR27, MB or NR onto the (100) and (111) surfaces of NiO, MgO, and (100) amorphous SiO2 surface, respectively.As seen in these figures, in most of the cases, the adsorbed molecules tend to lay flat on the surface of the materials with the exception of the NR which in the (111) surfaces tend to be adsorbed slightly tilted when compared with the other ones. This may indicate that the configuration of the NR molecule will affect the adsorption of other NR molecules changing in this way the type of observed adsorption isotherm, as indeed was observed experimentally. The adsorption of the molecules on the surfaces was accomplished by interaction of the heteroatoms oxygen (AR27) and nitrogen (MB and NR) and the aromatic rings (all of them) with the exposed nickel and magnesium atoms on the surfaces. Table 6 shows a summary of the obtained adsorbed energies for each molecule on the different surfaces.
| Material | AR27 adsorption energy (kcal mol−1) | MB adsorption energy (kcal mol−1) | NR adsorption energy (kcal mol−1) | H2O adsorption energy (kcal mol−1) | ||||
|---|---|---|---|---|---|---|---|---|
| (100) | (111) | (100) | (111) | (100) | (111) | (100) | (111) | |
| NiO | −2865 | −2652 | −1057 | −2030 | −992 | −2042 | −254 | −208 |
| MgO | −6295 | −7238 | −2411 | −4999 | −2298 | −5055 | −590 | −544 |
| SiO2 | −1090 | — | −315 | — | −338 | — | −222 | — |
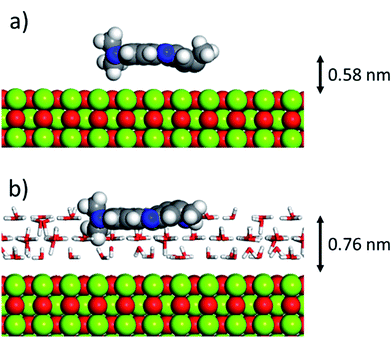
As can be inferred from the values in Table 6, AR27 is the organic molecule that has the strongest adsorption interaction with the different surfaces (more negative values for the adsorption energy) being the interaction with the surface (111) stronger than with the (100) surface for MgO which should be expected as this polar surface would be stabilized by strongly adsorbing the organic molecules. MB and NR also presented higher adsorption energies for the (111) surfaces; however, the interaction with the MgO is stronger than with the NiO surfaces; thus, without an aqueous media, MgO will adsorb the organic molecules stronger than NiO. As expected, the interactions of these molecules with the amorphous silica surface are the lowest; thus, the nanocrystalline oxides are the ones driving the adsorption process and the amorphous silica is simply a carrier for maintaining nanoparticles stability. Interestingly, the adsorption of water onto the surfaces of NiO and MgO indicates that adsorption of water on the MgO surfaces is stronger; thus, this behavior of water should affect the adsorption of the organic molecules on the MgO surfaces under the aqueous system. Fig. 12 shows the adsorption of NR on the surface (100) of MgO without the presence of water molecules (Fig. 12a) and in the presence of 100 molecules of water (Fig. 12b). The presence of water seems to have weakened the interaction of NR with the surface and the interatomic adsorption distance of NR from the surface increased from 0.58 nm to 0.76 nm when the water molecules are present. This strongly suggests that the water will influence the adsorption of the organic molecules on the MgO surfaces as experimentally observed. The adsorption of water on the surfaces of MgO is of the chemisorption type; thus, hydroxylation of the surfaces will change the way the organic molecules will interact with the surfaces, and experimentally it seemed that the adsorption was weakened.
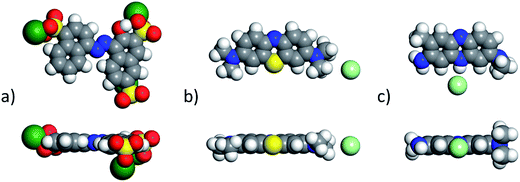
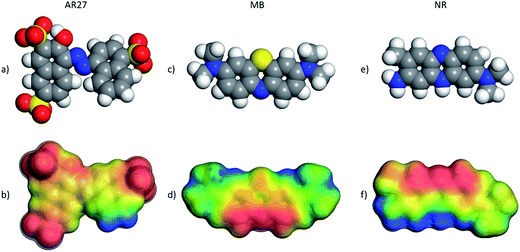
Electron density distribution is a key descriptor for molecular systems because it influences intersystem interactions due to electrostatic or electrodynamic phenomena; thus, calculations of this key descriptor were carried out to further get insights into the observed behavior of the selected organic molecules. Fig. 13 shows the DFT optimized AR27, MB, and NR organic molecules with their electrostatic potential maps computed at the DFT m-GGA-M06L/DNP+ level using the COSMO water solvation model. The red color in the maps indicates a more negative region and the positive zones are presented as blue surfaces. Fig. 13 clearly depicts that the three organic model molecules have undeniable different charge distributions; and thus, should have completely different behaviors under the tested adsorption conditions implying the need for a molecular level description of their behaviors. As can be noticed in Fig. 13a and b, the sulfur atoms, in the sulfonate groups of AR27, are surrounded by oxygen atoms rendering this group as a hard anion chemical species, thus, the negative charge is quite localized in AR27 within the sulfonate groups; and then, coulombic and hydrophobic/hydrophilic forces should dictate its physicochemical behavior. On the other hand, the NR molecule features a finer structure with locally negative and positive zones distributed along the molecule. This distribution of negative and positive charges may explain the observed BET adsorption behavior for this molecule as the adsorbed NR molecule can act as a new sorption site for new NR molecules as the environmental charges may render this molecule to act like “bricks”, thus, each will be piling up on top of the previous one generating the BET type model adsorption behavior that was observed experimentally. Finally, for the MB molecule case, the positives zones are less localized than in the case of the NR molecule, and thus, the behavior of this molecule is different from the NR one but more similar to the AR27 molecule producing adsorption behavior that complies with the Sips model.
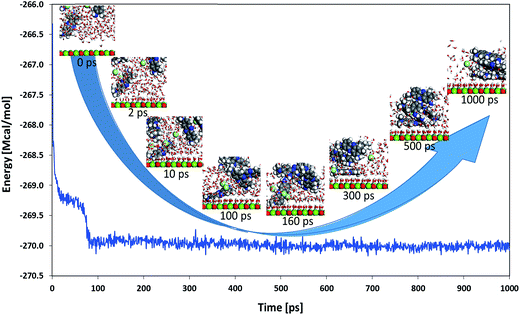
A molecular dynamics simulation was carried out with five NR molecules together with 500 water molecules on top of the (100) surface of MgO to get some additional insights into the adsorption behavior of this system. Fig. 14 shows the total energy of the system as a function of simulation time with insets of the close-up evolution of the system with selected simulation times (to get finer details of the process, a video of the evolution of the system can be found in the accompanying ESI†). An important drop of the total energy for the system was obtained when some water molecules got adsorbed on the surface and one of the NR molecules got also adsorbed on the surface (approximately between 0 and 10 ps of simulation time). A second drop of the total energy was observed when the remaining four NR molecules got together forming a 4-molecule cluster (approximately between 10 and 100 ps of simulation time). Finally, the system entered in equilibrium (maintaining the total energy around −270 Mcal mol−1) when the four NR molecules non-adsorbed on the surface interacted with the one that was adsorbed on the surface making a cluster of 5 NR molecules which now act together by moving and vibrating on the surface; one of them directly adsorbed on the surface and the others forming a cluster adsorbed on top of the first one. This finding seems to give a feasible explanation for the observed BET type adsorption behavior encountered with the NR model molecule on the studied silica-embedded NiO and MgO nanoparticles in the experimental part.
4. Conclusions
Different silica-embedded NiO and/or MgO nanoparticles (SiO2–NiO, SiO2–MgO, and SiO2–(Ni0.5Mg0.5)O) were synthesized and characterized by different characterization techniques like XRD, BET, HRTEM, CO2-TPD, and IR spectroscopy. These nanoparticles were successfully employed for the adsorptive removal of different cationic and anionic model organic molecules, exemplified by methylene blue (MB), neutral red (NR), and acid red 27 (AR27). On a normalized surface area basis, SiO2–(Ni0.5Mg0.5)O nanoparticles showed the highest uptake for MB and NR which could be attributed to their possible synergistic effect, while SiO2–NiO nanoparticles showed the highest uptake for AR27 which could be attributed to the stability of NiO nanoparticles in comparison with MgO in aqueous solutions as the adsorption of water onto the surface of MgO is stronger. These findings were supported by the IR spectroscopy before and after adsorption. The experimental adsorption macroscopic isotherm data for MB and AR27 fit well with the Sips model with a heterogeneity factor of less than 0.5 in most cases suggesting that these nanoparticles may have heterogeneous surfaces with adsorption sites that have different adsorption energies. Unexpectedly, the adsorbed amount of NR molecules increased exponentially with the equilibrium concentration. Thus, data fit well to the BET model suggesting a multilayer adsorption system. These findings were confirmed and supported by the computational modeling, DFT calculations, and molecular dynamics simulation. MB and AR27 model molecules tended to lay flat on the surface of the nanoparticles while NR tended to be adsorbed slightly tilted. The adsorption of the molecules on the surfaces was accomplished by interaction of the heteroatoms and the aromatic rings with the exposed nickel and magnesium atoms on the surfaces. The molecular dynamics simulation movie together with the evolved total adsorption energy as a function of simulation time confirmed the experimental BET adsorption behavior of NR onto the prepared nanoparticles. We do believe that the development of such simple and cost-effective silica-embedded NiO and/or MgO nanoparticles will be promising for the futuristic steam gasification of the adsorbed species, and thus, working not only as nanoadsorbents but also as nanocatalysts. After understanding the adsorption mechanism of tested model molecules in this study, the catalytic behavior of these nanoparticles will be addressed in future publications.Acknowledgements
The authors are grateful to the Department of Chemical and Petroleum Engineering at the Schulich School of Engineering at the University of Calgary. The prestigious Werner Graupe International Fellowship in Engineering hosted by the University of Calgary is deeply appreciated. A special thanks to Dr Azfar Hassan for thorough elaborations on the CO2-TPD test, and Dr Tobias Fürstenhaupt for access to the Microscopy and Imaging Facility of the Health Science Center at the University of Calgary which receives support from the Canadian Foundation for Innovation and the Alberta Science and Research Authority.References
- L. M. L. Nollet and L. S. P. D. Gelder, Handbook of water analysis, Taylor & Francis Group, LLC, Boca Raton, FL, 3rd edn, 2014 Search PubMed.
- F. S. G. Einschlag and L. Carlos, Waste water – treatment technologies and recent analytical developments, InTech, Rijeka, 2013 Search PubMed.
- D. Barceló and M. Petrovic, Waste water treatment and reuse in the mediterranean region, Springer, Verlag, Berlin, Heidelberg, 2011 Search PubMed.
- P. Martinez-Santos, M. M. Aldaya and M. R. Llamas, in Integrated water resources management in the 21st century revisiting the paradigm, ed. P. Martinez-Santos, M. M. Aldaya and M. R. Llamas, CRC Press Taylor & Francis Group, London, UK, 2014, ch. 2, pp. 17–36 Search PubMed.
- E. W. Allen, J. Environ. Eng. Sci., 2008, 7, 123–138 CrossRef CAS.
- E. W. Allen, J. Environ. Eng. Sci., 2008, 7, 499–524 CrossRef CAS.
- E. T. Igunnu and G. Z. Chen, Int. J. Low-Carbon Technol., 2014, 9, 157–177 CrossRef CAS.
- X. Qu, P. J. J. Alvarez and Q. Li, Water Res., 2013, 47, 3931–3946 CrossRef CAS PubMed.
- J. M. Perez, Nat. Nanotechnol., 2007, 2, 535–536 CrossRef CAS PubMed.
- K. J. McDonald, B. Reynolds and K. J. Reddy, Sci. Rep., 2015, 5, 11110 CrossRef CAS PubMed.
- F. Brandl, N. Bertrand, E. M. Lima and R. Langer, Nat. Commun., 2015, 7765 CrossRef CAS PubMed.
- Y. Su, A. S. Adeleye, Y. Huang, X. Zhou, A. A. Keller and Y. Zhang, Sci. Rep., 2016, 6, 24358 CrossRef CAS PubMed.
- P. Westerhoff, P. Alvarez, Q. Li, J. Gardea-Torresdey and J. Zimmerman, Environ. Sci.: Nano, 2016, 3, 1241–1253 RSC.
- N. N. Nassar and A. Ringsred, Environ. Eng. Sci., 2012, 29, 790–797 CrossRef CAS.
- N. N. Nassar, N. N. Marei, G. Vitale and L. A. Arar, Can. J. Chem. Eng., 2015, 93, 1965–1974 CrossRef CAS.
- N. N. Nassar, in Applications of nanomaterials for water quality, ed. B. V. d. Bruggen, Future Science, London, 2013, pp. 52–65 Search PubMed.
- N. N. Nassar, in Application of adsorbents for water pollution control, ed. A. Bahtnagar, Bentham Science Publishers, 2012, pp. 81–118 Search PubMed.
- H. P. Jarvie and S. M. King, Nano Today, 2010, 5, 248–250 CrossRef.
- L. Zhang and M. Fang, Nano Today, 2010, 5, 128–142 CrossRef CAS.
- P. Xu, G. M. Zeng, D. L. Huang, C. L. Feng, S. Hu, M. H. Zhao, C. Lai, Z. Wei, C. Huang, G. X. Xie and Z. F. Liu, Sci. Total Environ., 2012, 424, 1–10 CrossRef CAS PubMed.
- Y. Yuan, N. Yan and P. J. Dyson, ACS Catal., 2012, 2, 1057–1069 CrossRef CAS.
- D. Astruc, F. Lu and J. R. Aranzaes, Angew. Chem., Int. Ed., 2005, 44, 7852–7872 CrossRef CAS PubMed.
- N. Yan, C. Xiao and Y. Kou, Coord. Chem. Rev., 2010, 254, 1179–1218 CrossRef CAS.
- A. El-Qanni, N. N. Nassar, G. Vitale and A. Hassan, J. Colloid Interface Sci., 2016, 461, 396–408 CrossRef CAS PubMed.
- Q.-Y. Chen, D.-l. Huang, Y.-B. Wang, J. Shao and L.-L. Qu, RSC Adv., 2016, 6, 70547–70552 RSC.
- N. Yan, Nanotechnol. Rev., 2013, 2, 485–486 CrossRef.
- J. Singh, J.-K. Yang, Y.-Y. Chang and J. R. Koduru, Environ. Processes, 2016, 1–14, DOI:10.1007/s40710-016-0199-2.
- M. Santos-Beltrán, F. Paraguay-Delgado, R. García, W. Antúnez-Flores, C. Ornelas-Gutiérrez and A. Santos-Beltrán, J. Mater. Sci.: Mater. Electron., 2016, 1–14, DOI:10.1007/s10854-016-5878-2.
- JADE, V 7.5.1 XRD, Pattern Processing Identification & Quantification, 2005 Search PubMed.
- N. N. Marei, N. N. Nassar and G. Vitale, Phys. Chem. Chem. Phys., 2016, 18, 6839–6849 RSC.
- M. Hmoudah, N. N. Nassar, G. Vitale and A. El-Qanni, RSC Adv., 2016, 6, 64482–64493 RSC.
- R. Sips, J. Chem. Phys., 1948, 16, 490–495 CrossRef CAS.
- R. Sips, J. Chem. Phys., 1950, 18, 1024–1026 CrossRef CAS.
- S. Brunauer, P. H. Emmett and E. Teller, J. Am. Chem. Soc., 1938, 60, 309–319 CrossRef CAS.
- D. C. Montgomery and G. C. Runger, Applied statistics and probability for engineers, John Wiley & Sons, New York, 4th edn, 2006 Search PubMed.
- BIOVIA Materials Studio Modeling and Simulation Software Version 2017, Dassault Systemes, accessed 8 November, 2016 Search PubMed.
- S. Kirkpatrick, C. D. Gelatt and M. P. Vecchi, Science, 1983, 220, 671–680 CAS.
- V. Černý, J. Optim. Theor. Appl., 1985, 45, 41–51 CrossRef.
- L. Zhao, L. Liu and H. Sun, J. Phys. Chem. C, 2007, 111, 10610–10617 CAS.
- H. Sun, J. Phys. Chem. B, 1998, 102, 7338–7364 CrossRef CAS.
- H. Sun and D. Rigby, Spectrochim. Acta, Part A, 1997, 53, 1301–1323 CrossRef.
- D. Rigby, H. Sun and B. E. Eichinger, Polym. Int., 1997, 44, 311–330 CrossRef CAS.
- H. Sun, P. Ren and J. R. Fried, Comput. Theor. Polym. Sci., 1998, 8, 229–246 CrossRef CAS.
- S. W. Bunte and H. Sun, J. Phys. Chem. B, 2000, 104, 2477–2489 CrossRef CAS.
- M. J. McQuaid, H. Sun and D. Rigby, J. Comput. Chem., 2004, 25, 61–71 CrossRef CAS PubMed.
- A. Klamt and G. Schuurmann, J. Chem. Soc., Perkin Trans. 2, 1993, 799–805, 10.1039/p29930000799.
- F. L. Hirshfeld, Theor. Chim. Acta, 1977, 44, 129–138 CrossRef CAS.
- S. Nosé, J. Chem. Phys., 1984, 81, 511–519 CrossRef.
- K. S. W. Sing, D. H. Everett, R. A. W. Haul, L. Moscou, R. A. Pieroti, J. Rouquerol and T. Siemieniewska, Pure Appl. Chem., 1985, 57, 603–619 CrossRef CAS.
- M. Thommes, K. Kaneko, A. V. Neimark, J. P. Olivier, F. Rodriguez-Reinoso, J. Rouquerol and K. S. W. Sing, Pure Appl. Chem., 2015, 87, 1051–1069 CrossRef CAS.
- N. N. Nassar, A. Hassan and P. Pereira-Almao, Energy Fuels, 2011, 25, 1017–1023 CrossRef CAS.
- I. H. Chowdhury, A. H. Chowdhury, P. Bose, S. Mandal and M. K. Naskar, RSC Adv., 2016, 6, 6038–6047 RSC.
- E. Roduner, Chem. Soc. Rev., 2006, 35, 583–592 RSC.
- M. A. Peck and M. A. Langell, Chem. Mater., 2012, 24, 4483–4490 CrossRef CAS.
- S. Musi, N. Filipovi-Vincekovi and L. Sekovani, Braz. J. Chem. Eng., 2011, 28, 89–94 Search PubMed.
- R. M. Silverstein, F. X. Webster and D. J. Keimle, Spectrometric identification of organic compounds, John Wiley & Sons, NJ, USA, 7th edn, 2005 Search PubMed.
- K. Scherer, L. Nouvelot, P. Lacan and R. Bosmans, Appl. Opt., 1996, 35, 5067–5072 CrossRef CAS PubMed.
- J. K. Sharma, P. Srivastava, G. Singh, M. S. Akhtar and S. Ameen, Ceram. Int., 2015, 41, 1573–1578 CrossRef CAS.
- L. Liu, Y. Guo, Y. Wang, X. Yang, S. Wang and H. Guo, Electrochim. Acta, 2013, 114, 42–47 CrossRef CAS.
- L.-X. Li, D. Xu, X.-Q. Li, W.-C. Liu and Y. Jia, New J. Chem., 2014, 38, 5445–5452 RSC.
- N. N. Nassar, C. A. Franco, T. Montoya, F. B. Cortés and A. Hassan, Fuel, 2015, 156, 110–120 CrossRef CAS.
- C. A. Franco, T. Montoya, N. N. Nassar, P. Pereira-Almao and F. B. Cortés, Energy Fuels, 2013, 27, 7336–7347 CrossRef CAS.
- C. A. Franco, N. N. Nassar, T. Montoya and F. B. Cortés, in Handbook on Oil Production Research, ed. J. Ambrosio, Nova Science Publishers Inc., USA, 2014 Search PubMed.
- R. Li, L. Zhang and P. Wang, Nanoscale, 2015, 7, 17167–17194 RSC.
- C. C. Acebal, B. M. Simonet and M. Valcárcel, TrAC, Trends Anal. Chem., 2013, 43, 109–120 CrossRef CAS.
- C.-H. Huang, K.-P. Chang, H.-D. Ou, Y.-C. Chiang, E. E. Chang and C.-F. Wang, J. Hazard. Mater., 2011, 186, 1174–1182 CrossRef CAS PubMed.
- R. Wu, J.-H. Liu, L. Zhao, X. Zhang, J. Xie, B. Yu, X. Ma, S.-T. Yang, H. Wang and Y. Liu, J. Environ. Chem. Eng., 2014, 2, 907–913 CrossRef CAS.
- W. Fan, W. Gao, C. Zhang, W. W. Tjiu, J. Pan and T. Liu, J. Mater. Chem., 2012, 22, 25108–25115 RSC.
- K. Y. Foo and B. H. Hameed, Chem. Eng. J., 2010, 156, 2–10 CrossRef CAS.
- M. Choimet, A. Tourrette and C. Drouet, J. Colloid Interface Sci., 2015, 456, 132–137 CrossRef CAS PubMed.
- A. Ebadi, J. S. Soltan Mohammadzadeh and A. Khudiev, Adsorption, 2009, 15, 65–73 CrossRef CAS.
- J. Wang, C. P. Huang, H. E. Allen, D. K. Cha and D.-W. Kim, J. Colloid Interface Sci., 1998, 208, 518–528 CrossRef CAS PubMed.
- N. N. Nassar, L. A. Arar, N. N. Marei, M. M. Abu Ghanim, M. S. Dwekat and S. H. Sawalha, Environmental Nanotechnology, Monitoring & Management, 2014, 1–2, 14–23 Search PubMed.
- C. A. Franco, N. N. Nassar and F. B. Cortés, J. Colloid Interface Sci., 2014, 433, 58–67 CrossRef CAS PubMed.
- C.-H. Weng and Y.-F. Pan, J. Hazard. Mater., 2007, 144, 355–362 CrossRef CAS PubMed.
- C.-H. Weng and Y.-F. Pan, Colloids Surf., A, 2006, 274, 154–162 CrossRef CAS.
- Y. Zhang, Y. Chen, P. Westerhoff, K. Hristovski and J. C. Crittenden, Water Res., 2008, 42, 2204–2212 CrossRef CAS PubMed.
- Y. Zhang, Y. Chen, P. Westerhoff and J. Crittenden, Water Res., 2009, 43, 4249–4257 CrossRef CAS PubMed.
- N. N. Nassar, Sep. Sci. Technol., 2010, 45, 1092–1103 CrossRef CAS.
- S. O. Baumann, J. Schneider, A. Sternig, D. Thomele, S. Stankic, T. Berger, H. Grönbeck and O. Diwald, Langmuir, 2015, 31, 2770–2776 CrossRef CAS PubMed.
- E. Lucas, S. Decker, A. Khaleel, A. Seitz, S. Fultz, A. Ponce, W. Li, C. Carnes and K. J. Klabunde, Chem.–Eur. J., 2001, 7, 2505–2510 CrossRef CAS.
- P. W. Tasker, J. Phys. C: Solid State Phys., 1979, 12, 4977 CrossRef CAS.
- D. Wolf, Phys. Rev. Lett., 1992, 68, 3315–3318 CrossRef CAS PubMed.
- D. Wolf, Solid State Ionics, 1995, 75, 3–11 CrossRef CAS.
- J. Ciston, A. Subramanian and L. D. Marks, Phys. Rev. B: Condens. Matter Mater. Phys., 2009, 79, 085421 CrossRef.
Footnote |
| † Electronic supplementary information (ESI) available. See DOI: 10.1039/c7ra00615b |
| This journal is © The Royal Society of Chemistry 2017 |

