 Open Access Article
Creative Commons Attribution 3.0 Unported Licence
Reduction of package-induced error for the composition analysis of in-package liquid products based on transmission spectrum
Shengzhao Zhang ab,
Gang Liab,
Jiexi Wangc,
Donggen Wang*c,
Ying Hanc,
Minxia Liuc and
Ling Lin*ab
aState Key Laboratory of Precision Measurement Technology and Instrument, Tianjin University, Tianjin 300072, China. E-mail: linling@tju.edu.cn
bTianjin Key Laboratory of Biomedical Detection Techniques & Instruments, Tianjin University, Tianjin 300072, China
cBeijing Institute of Blood Transfusion Medicine, Academy of Military Medical Sciences, Beijing, China. E-mail: wangdg@bmi.ac.cn
First published on 18th May 2017
Abstract
The influence of packaging on the spectral analysis of in-package liquid products was studied in this work, and a method was proposed to formulate a calibration model to inhibit the effect of different absorptions of the package due to different thicknesses of the package. Based on the characteristics of partial least square regression, the strategy is to construct a model that is insensitive to the thickness variation of the package. This method involves the use of collected spectra for the model establishment under different thicknesses of the package, where the obtained model is found to satisfactorily inhibit the influence of the package thickness variation. An experiment using an Intralipid suspension and India ink as the analyte was designed, and a polyethylene film was used to simulate the packing material of the sample analyte. Analysis of the experimental data shows that the model established via the novel modeling strategy could well inhibit the error caused by variation in the external packaging.
1. Introduction
Visible-near infrared spectroscopy is a tool used to analyze the composition of a substance through its transmission spectrum and reflection spectrum. The utility model has the advantages of not damaging to materials, rapid detection, no consumption of any chemical reagent, low cost, etc. Therefore, it is widely used in the medicinal field, chemical, food and agriculture industries, and other fields.1–6For the analysis of liquid products, the general method is to open the packaging of the liquid product, take out a sample and transfer it into a specific container (such as a cuvette) to measure its transmitted or diffused reflection spectrum.7,8 At present, an increasing number of researchers are focusing on analysing the internal composition of a material directly without opening its packaging.9–11 This strategy can avoid pollution of the internal substance, save detection time, and improve the detection efficiency, which would be of great significance for the quality assessment of food products and medical products with their packaging intact. Particularly, on some occasions, destructive tests are not efficient enough for quality control. For example, in the case of blood, quality control is performed on randomly selected blood bags using the destructive method but only the blood in the intact blood bags are allowed to be used for transfusion.11 To ensure the safety of the patient who needs the transfusion, it is required that all the blood be inspected to avoid using specimens in which haemolysis occurs.
At present, a few researchers have proposed methods for the non-invasive testing of in-package products because of the impact of absorption by the external packaging. Different thicknesses of packaging will result in different absorption spectra for identical products, which in turn will affect the accuracy of the measurement.
In the process of quantitative analysis of the spectra for determining the composition of a material, a mathematical model of the quantitative information (such as concentration) between the spectrum and a known material is generally established first. For quantitatively analyzing an unknown composition, the measured spectral data is fed into an already established mathematical model, and quantitative information on the components is obtained. The variation or instability of external parameters is a potential source of errors. In the spectral measurement, various external factors impact the spectrum and generate errors in the prediction of the material composition. These external factors include temperature of the surroundings, characteristics of the light source, optical path length, and numerical aperture of the optical fiber.12–15 Particularly, the thickness of the packaging is the external factor that should be the main concern in the detection of in-package products.
There are three strategies to eliminate the influence of the external factors.13,16,17 The first strategy is to maintain invariability of the external factors that may affect the spectral measurement. However, in actual measurements, it is impossible to keep all types of factors unchanged. The second method is the compensation method.12 This method is based on studying how the external factors affect the spectrum and then correct the spectral data or measurements accordingly. Unfortunately, the changes in the external parameters are always unknown and unpredictable, which make it impossible to perform compensation. The third strategy is to establish a mathematical model with good robustness. Good robustness implies that the prediction accuracy is relatively insensitive towards unknown changes in external factors. Swierenga et al. proposed a strategy to build a model with good robustness, which could suppress the errors caused by temperature, laser frequency, and laser power.17 In order to eliminate the influence of temperature, Roger presented the method called external parameter orthogonalisation (EPO) of PLS.18 Li et al. proposed a strategy called the “M + N” theory to build a calibration model that is insensitive to external interference factors.6,13
In this work, we study how to eliminate the influence of the thickness differences of the package on the analysis of the composition of a liquid. A strategy is proposed to build a calibration model that is insensitive to the thickness of the package. To verify the effectiveness of this strategy, an experiment is designed with different concentrations of Intralipid and India ink as the testing analyte and with different layers of plastic films to simulate different thicknesses of the outer packaging. The experimental results show that this strategy can eliminate the influence of the outer package thickness on the spectrum, and that it has the potential to achieve the detection of products without damaging the packaging in the future.
2. Theoretical analysis
2.1 Influence of package thickness variation
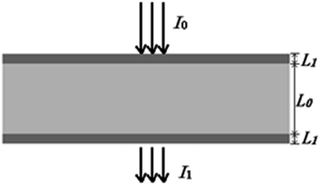
Quantitative information of a solvent in a solution can be obtained by measuring the transmission spectrum of the liquid. Fig. 1 is a schematic diagram of light passing through a container with a liquid inside. When a liquid is placed in a container with the thickness of L1 and internal thickness of L0, the intensity of the input and output light follows eqn (1) according to the modified Lambert–Beer's law (MLBL), where B is the differential path length factor (DPF), which is a function of the wavelength (λ) of light and is mainly used to describe the variation of the path length of the light caused by scattering. Further, G is the loss owing to the background and K is the attenuation coefficient, which is the sum of the molar absorption coefficient and scattering coefficient.
 | (1) |
According to eqn (1), the measured transmission spectra I1(λ) change with the concentration of the solvent, and also the thickness of the container. In practical applications, a multivariate model that relates the transmission spectra I1(λ) and the concentration of the solvent is constructed by using the chemometric technique. Due to the absorption of the container, a change in the thickness of the container has an impact on the transmission light, which will consequently affect the prediction of the concentration using the model. The multivariate model may be useful only when L1 is kept unchanged or the model is insensible to the change in L1. As it is not possible to keep L1 constant, it is necessary to construct a calibration model that is insensible to changes in L1.
2.2 Strategy to construct calibration model
Partial least squares regression (PLSR) is a type of chemometric tools that can link the relationship between two datasets, X and Y.19 The dataset X can be the logarithm of the transmission spectrum data and the dataset Y may be the concentration of a solute. The result of the regression is to calculate a vector called the regression coefficient. By multiplying the spectrum data to the regression coefficient, the concentration of a given solute can be obtained. This calculation is given as eqn (2).
 | (2) |
The PLSR procedure includes a number of iterations by gradually adjusting the latent variables in the regression, which results in a best regression coefficient vector that can be used in the prediction. A characteristic of the regression vector is that it gives a high weight to the data in the spectrum with high correlation with the concentration of the solute. When the transmission spectrum is influenced by an external factor, the regression vector will automatically give low weight to the data in the spectrum that is sensible to the external factor if the calibration set covers all the variations of the response of the external factor.
To eliminate the influence due to the absorption of the package when measuring the liquid in the package, it is necessary to measure the transmission spectrum of a series of solutes with different concentrations in packaging of different thicknesses. When the calibration set is composed of a spectrum of samples in packages with various thicknesses, the regression model would automatically be insensible to the influence of the package.
2.3 Simulation analysis
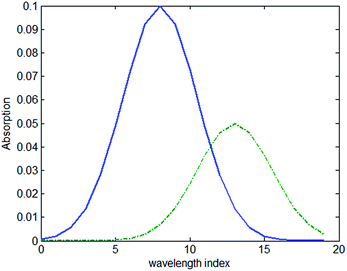
Simulated transmission spectrum data were prepared with different concentrations of solvents in packages of different thicknesses. The absorption of the sample with a thickness of 1 mm and concentration of 1 mol L−1 is shown in Fig. 2 and the absorption of the package with the thickness of 1 mm is also shown in the same figure.Thirty samples were used in the simulation with concentrations varying from 1–30 mol L−1 and thickness of 7 mm. The samples were place in a package with the thickness of 1 mm, 2 mm, 3 mm and 4 mm. A total of 120 spectra were calculated with different samples and packages.
First, a PLSR model was built based on the dataset of the spectrum of the sample placed in the 1 mm package. Twenty-five out of thirty spectra were selected as the calibration set and the remaining were the prediction set. The model was validated using the “leave-one-out” cross validation method and the root mean square error of calibration (RMSEC) and root mean square error of prediction (RMSEP) were both zero. Second, another PLSR model was built based on the spectrum dataset that covers all the spectra collected under different packages. 100 out of 120 spectra were selected as the calibration set and the remaining were the prediction set. The model was also validated using the “leave-one-out” cross validation method and the RMSEC and RMSEP were both zero.
The value of the regression coefficient vector b1 in the first model and the regression coefficient vector b2 in the second model are shown in Fig. 3(a) and (b), respectively. Comparing Fig. 2 and 3(a), it shows that the coefficient vector gives high weight to the wavelength that shows high absorption. When the model is constructed based on all the spectra, the regression coefficient vector b2 shows a difference with the regression coefficient vector b1. The vector b2 shows a larger difference than b1 when the index is between 15–20, where the transmission spectrum is more sensitive to the absorption of the package. To access how the vector b2 suppresses the influence of the package, we multiplied the absorption coefficient of the package to the vector b2. The result of the multiplication is zero. It can be concluded that when a calibration set covers the spectrum data measured under several different package thicknesses, the model will have the ability to suppress the influence of the package.
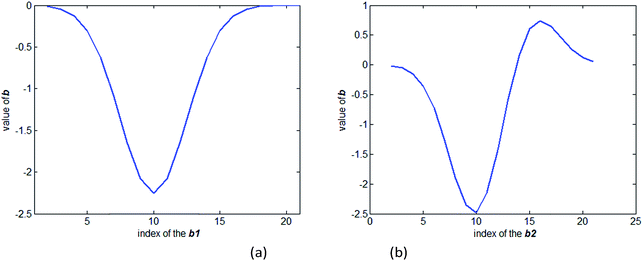 | ||
| Fig. 3 (a) Value of the regression coefficient vector b1 in the first model. (b) Value of the regression coefficient vector b2 in the second model. | ||
3. Experiment
3.1 Instrumentation
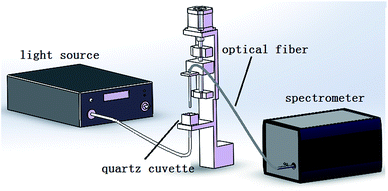
The experimental set up illustrated in Fig. 4 is composed of a supercontinuum white light laser source (SuperK Compact, NKT, Denmark), electronically controlled translation stage, spectrometer (AvaSpec-HS1024*58TEC-USB2, Avantes, Netherlands), an optical fiber, a cuvette, and a PC. The light power of the laser source is approximately 100 mW, and the spectral range covers 500–1700 nm. The wavelength range of the spectrograph is 299.87–1160 nm. The number of wavelengths is 945 and the internal ADC resolution is 16 bits. The material of the cuvette is quartz glass, which has a size of 18 × 18 × 16 mm. The output light of the laser light source is vertical and irradiated upwards to the bottom of the cuvette. One end of the detection fiber is vertically placed on the other side of the cuvette to receive the transmitted light, and a plastic film covers the terminal of the optical fiber. The other end of the optical fiber is connected to the spectrometer. A PC is connected with the spectrometer via a USB cable and the spectra were collected by AVASOFT 7.6 and saved in the PC.3.2 Samples and testing process
Intralipid (IL) is a common type nutrient that is often used to synthesize phantom materials owing to its strong scattering characteristics and very weak absorption nature. India ink (INK) is a simple ink that consists of carbon particles suspended in water. The absorption coefficient of India ink is much larger than its scattering coefficients. The optical properties of Intralipid and India ink provide the flexibility to formulate a variety of diffusive liquid phantoms with different optical properties.Herein, 20% IL (Huarui Pharmaceutical Co. Ltd, China) suspensions, INK (Beijing Solarbio Science & Technology Co. Ltd, China) and distilled water were used to prepare 30 liquid phantoms. First, 20% IL and 0.1% INK of the same volume were mixed as the stock solution. For convenience, the stock solution is denoted as sample-A. The stock solution was subsequently diluted to make 30 samples with the volume ratio of sample-A of 2%, 4%, etc., 60%. Polyethylene (PE) thin film with a thickness of approximately 20 μm was prepared to simulate different thicknesses of packaging.
To ensure the stability of the light source in the experiment, the supercontinuum laser source was opened and preheated for more than 30 min before collecting the spectrum. The sample was then placed in a quartz cuvette and the cuvette was placed in a specific position in the device.
After each sample was prepared, the PE film was used to cover the surface of the fiber probe. The electronically controlled translation stage was operated to move the optical probe to about 5 mm from the bottom of the sample. A PC was employed to control the spectrometer for the acquisition of the transmitted spectrum. Four measurements were taken for each sample. In the measuring process, the surface of the fiber probe was covered with 1–4 layers of the PE thin films. Therefore, for every sample, four spectral data sets were obtained.
4. Data processing
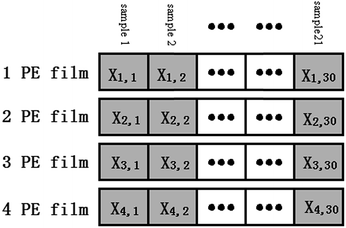
Logarithm transformation was performed on the spectral data and all the data was arranged as shown in Fig. 5. Only the data from the wavelength range of 500–750 nm was used. For convenience, the symbols are defined as follows:Xi,j: logarithm of the measured spectrum of sample j with optical fiber coverage of i layers of PE film.
XL=i,all: dataset contains all the logarithm spectra with i layers of the PE thin film.
XL=i,c: dataset contains randomly selected 24 logarithm spectra measured with i layers of the PE thin film.
XL=i,p: dataset contains the remaining 6 logarithm spectra measured with i layers of the PE thin film that is not in. XL=i,p
All the obtained data are represented in Fig. 3. Three models were constructed based on different calibration sets measured under different layers of PE film and the models were assessed by applying several different prediction sets. The calibration set and the prediction set are listed in Table 1. The models that relate the spectrum data and the volume ratio of the sample were constructed with PLSR tools using the MATLAB software. A total of three models were built based on different calibration sets. All the models were assessed by different prediction sets.
| Calibration set | Prediction set 1 | Prediction set 2 | Prediction set 3 | Prediction set 4 | |
|---|---|---|---|---|---|
| 1 | XL=1,c | XL=1,p | XL=2,all | XL=3,all | XL=4,all |
| 2 | XL=1,c & XL=4,c | XL=1,p | XL=2,all | XL=3,all | XL=4,p |
| 3 | XL=1,c & XL=3,c & XL=4,c | XL=1,p | XL=2,all | XL=3,all | XL=4,p |
5. Results and discussion
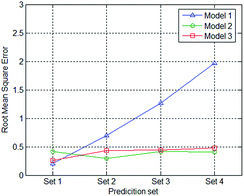
The RMSECs and RMSEPs of all the models and prediction sets were calculated and presented in Table 2. Fig. 6 displays the root mean square error of when applying different prediction sets to the three models.| RMSEC | RMSEP1 | RMESP2 | RMSEP3 | RMSEP4 | |
|---|---|---|---|---|---|
| 1 | 0.1621 | 0.2078 | 0.6983 | 1.2717 | 1.9668 |
| 2 | 0.1835 | 0.4192 | 0.2979 | 0.4180 | 0.4048 |
| 3 | 0.2391 | 0.2552 | 0.4349 | 0.4386 | 0.4803 |
It can be seen that the RMSEP of Model 1 increases when the thickness of the PE film increases, from approximately 0.2 to about 2.0. The model performs well when the data set XL=1,p is applied to Model 1 with an RMSEP of 0.2078. The RMSEP of Model 2 and 3 of each prediction set are all less than 0.5 and show little changes.
The calibration set of Model 1 contains spectral data that was measured with only 1 PE film thickness. When the thickness of the PE film in the prediction set equals that of the calibration set, the model performs well. When the thickness of the PE film in the prediction set differs from that in the calibration set, the larger the difference, the greater the RMSEP. The dataset used for calibration in Model 2 is composed of spectrum dataset measured with 2 different of PE film thicknesses. The film layers in the calibration set of Model 2 are one and four, whereas the test data of the PE film with two and three layers are not involved. The RMSEP of prediction set 2 and prediction set 3 do not show a considerable increase compared to that of prediction set 1 and prediction set 4. Similarly, the dataset used for calibration in Model 3 is composed of spectrum dataset measured with 3 different PE film thicknesses. The film layers in the calibration set of Model 3 are one, three and four, whereas the test data of the PE film with two was not involved. The RMSEP of prediction set 2 was at approximately the same level as prediction sets 1, 3, and 4.
In this experiment, the surface of the fiber was covered with different layers of PE film to simulate the difference in packaging thicknesses in the spectral measurement. In the actual measurements of the transmitted spectra of the in-package liquid products, there will be some differences in the packaging thicknesses of different batches. Usually, we construct a model that relates the concentration and the spectrum with other parameters such as the thickness of the package is unchanged. The experimental result shows that the prediction result would be influenced with the change in the thickness of the package if using this type of model. If the model constructed based on the calibration set covers the variation of both concentration of the sample and thickness of the package, the model would be insensible to the thickness of the package, as we did in Model 2 and Model 3.
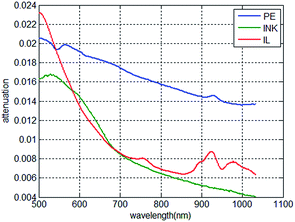
The attenuation of light of 0.02 mm PE, 1 mm 0.001% INK and 1 mm 0.1% IL is displayed in Fig. 7. It can be seen from Fig. 7 that the spectral response of PE is different from that of INK and IL. The models were all built based on PLSR, which contains a large amount of iterations and the regression coefficient was gradually adjusted. The procedure of PLSR gives the regression tool the characteristic that it can “find” the “best value” used in the regression tool. The simulation in sections proved that the “best value” would change due to the change in the calibration set. When the calibration set contains the spectral response of interest and the response of the package, the “best value” would change to the value that would suppress the response of the package. To utilize this characteristic of PLSR, it is essential that the spectral responses of the sample of interest and the package are different. The idea is that when the calibration model of the spectra and solution concentration is established, the spectral data of the calibration set is based on the collected spectral data in different packaging thicknesses. Thus, the calibration model can be considered suitable for the collected spectral data for the packaging thickness in this range.
6. Conclusions
The spectral method is a non-invasive detection method. To enable the detection of liquid products without damaging the packaging, the elimination of errors that might be caused by the packaging should be studied. The traditional way is to fix the external factors that introduce the errors. Herein, the idea is to artificially change the external factors that cause the interferences, i.e., change the thickness of the package, and build a model for spectral data measurement with different thicknesses. In order to verify the feasibility of this idea, Intralipid and India ink were chosen as the object of the experiment. In the experiment, different numbers of PE film layers were covered on the optical fiber and they were detected respectively to simulate the effect of packaging of different thicknesses in actual measurements. The modeling effects of the spectral data with only one layer of PE film and with more layers in the films were compared. The results show that the mathematical model established can well restrain the effect of the layer thickness. The experimental results prove the feasibility of this idea, and provide a method to propose a robust model for the detection of in-package products in the future.Acknowledgements
The authors gratefully acknowledge the support from the Tianjin Application Basis & Front Technology Study Programs (No. 14JCZDJC33100).Notes and references
- J. F. G. Martin, Int. J. Food Sci. Technol., 2015, 50, 1461 CrossRef.
- M. Huang, C. He and Q. Zhu, et al., Appl. Sci., 2016, 6, 183 CrossRef.
- M. Huang, M. S. Kim and S. R. Delwiche, et al., J. Food Eng., 2016, 181, 10 CrossRef CAS.
- T. Chen, Q. Chang and J. G. P. W. Clevers, et al., Environ. Pollut., 2015, 206, 217 CrossRef CAS PubMed.
- G. Durry, J. S. Li and I. Vinogradov, et al., Appl. Phys. B: Lasers Opt., 2010, 99, 339 CrossRef CAS.
- L. Lin, Q. Zhang and M. Zhou, et al., RSC Adv., 2016, 6, 113322 RSC.
- J. Qin and R. Lu, Appl. Spectrosc., 2007, 6(4), 388 CrossRef PubMed.
- R. M. Balabin and S. V. Smirnov, Talanta, 2011, 85, 562 CrossRef CAS PubMed.
- L. Lin, Z. Li and L. Zhang, et al., Anal. Methods, 2016, 8, 4239 RSC.
- M. Meinke, M. Friebel and J. Helfmann, et al., Biomed. Tech., 2005, 50(1–2), 2 CrossRef CAS PubMed.
- U. J. Netz, L. Hirst and M. Friebel, Photonics Lasers Med., 2015, 4(2), 193 CAS.
- A. Peirs, N. Scheerlinck and B. M. Nicolai, Postharvest Biol. Technol., 2003, 30, 233 CrossRef.
- G. Li, Y. Luo and Z. Li, et al., RSC Adv., 2016, 6(45), 38849 RSC.
- Z. Li, M. Zhou and Y. Luo, et al., Talanta, 2016, 155, 47 CrossRef CAS PubMed.
- L. Gang, L. Zhe and L. Xiao-xia, et al., Spectrosc. Spectral Anal., 2013, 33(6), 1456 Search PubMed.
- B. M. Nicolai, K. Beullens and E. Bobelyn, et al., Postharvest Biol. Technol., 2007, 46, 99 CrossRef.
- H. Swierenga, A. P. de Weijer and R. J. van Wijk, et al., Chemom. Intell. Lab. Syst., 1999, 49, 1 CrossRef CAS.
- J.-M. Roger, F. Chauchard and V. Maurel, Chemom. Intell. Lab. Syst., 2003, 66, 191 CrossRef CAS.
- S. Wold, M. Sjostrom and L. Eriksson, Chemom. Intell. Lab. Syst., 2001, 58, 109 CrossRef CAS.
| This journal is © The Royal Society of Chemistry 2017 |

