 Open Access Article
Macroscopic assembly of flexible and strong green graphene fibres†
R. Bakhtiaria,
S. Ghobadia,
E. N. Güllüoğlub,
L. I. Şanlıc,
S. A. Gürselac and
E. Özden-Yenigün *bd
*bd
aFaculty of Engineering and Natural Sciences, Sabanci University, 34956 Istanbul, Turkey
bIstanbul Technical University, Faculty of Textile Technologies and Design, Department of Textile Engineering, 34437, Istanbul, Turkey. E-mail: ozdenyenigun@itu.edu.tr
cNanotechnology Research and Application Center (SUNUM), Sabanci University, 34956 Istanbul, Turkey
dITU Aerospace Research Center, Istanbul Technical University, Istanbul, 34469, Turkey
First published on 18th May 2017
Abstract
Graphene fibres have great potential in future wearable electronics due to their promising thermal and electrical properties. However, fibre brittleness limits their implementation and researchers are still seeking easily scalable and eco-friendly production methods. Here we propose a green and continuous wet-spinning assembly approach to continuously spin flexible graphene oxide (GO) fibres. Highly stable aqueous GO suspensions up to 40 mg mL−1 are achieved and GO fibres are spun from highly oriented liquid crystals through a customized continuous fibre production line. As-spun GO fibres with specific ultimate tensile strength of 7 N/tex show strain to failure (%) of 10%; subsequent NaBH4 chemical reduction gives graphene fibres with electrical conductivity of 214 S cm−1. The scalable production presented here facilitates flexible, strong and electrically conductive graphene fibres, which have emerged as promising graphene based electronic textiles and sensors.
Introduction
As a well-known two dimensional (2D) natural material, there have been numerous reports of graphene's superior electrical and mechanical characteristics, compared to other carbon nanomaterials.1,2 Graphene's properties, empowered by its unique sp2 formation of carbon atoms leading to 2D layered structures, are desired in a variety of disciplines.3,4 These superior properties make graphene a perfect candidate in various fields including composites as reinforcement additives,5,6 clean and renewable energy production1–4 biocompatible thin films,1–7 and nanoelectronics.8 There have been several reports of different forms of graphene-based substances.5,9 Among which, the three-dimensional (3D) graphene fibres exhibit promising electrical, mechanical and thermal properties in macroscopic scale.10 The previous studies have led to formation of graphene oxide (GO) aqueous liquid crystals (GOLCs) for fibre spinning.9,11–14 The key of GOLCs preparation is to achieve the uniaxial alignment of GO layers called a nematic phase,12 which is required for the optimum mechanical, electrical and morphological properties.15 The substantial increase in alignment of GOLCs leads to better 3D macroscopic fibres as demanded both in academia and industry9,11–14,16,17 due to their high specific surface area and high tensile strength compared to other particle geometries.2,18,19 The wet-spinning method, as a well-known approach for preparation of polyacrylonitrile based carbon fibres, possesses several advantages including easy scalability, low cost of operation, higher processing yield and eco-friendly manufacturing.20 There are several studies about the fabrication of graphene fibres however, to the best of our knowledge a very few of them offer continuous flexible green fibre production with the potential of scalability. For instance, Gao et al.,11 prepared graphene fibres using wet-spinning method and the concentration of graphitic nanosheets used in the GOLCs was lower than 10 mg mL−1 whereas hydroiodic acid (HI) chemical reduction which prompts release of caustic by-product gases, was used. Besides, the low density of GO nanosheets in GOLCs and harsh reduction methods resulted in low layer packing inside the fibres, thus reduced their mechanical properties. In another study, Yu et al.,21 produced pristine graphene fibres by a similar approach using surfactant coagulation bath. They observed better alignment of GO nanosheets in the GOLCs which leaded to higher packing density of graphene layers and better resultant properties. Not only GOLCs characteristics but also the selection of coagulation media is an essential parameter which affects fibre tensile properties. As shown in Table 1, the GO fibres tensile strength coagulated in CaCl2 bath is higher than those prepared in different coagulation media such as CTAB, ethanol and NaOH.13,21,22 In wet spinning of GO fibres, the elimination of functional groups present on the graphene layers are required to conduct electrons. Among different approaches such as thermal reduction,5 microwave irradiation,23 chemical reduction24 method was the most reliable one without sacrificing the mechanical performance. At the same time, the defect density of graphene nanosheets is also tuneable compared to thermal reduction approach.11,13,25–27| Ref. | Coagulation bath | Diameter (μm) | Reduction method | Tensile strength (GPa) | Conductivity (S m−1) |
|---|---|---|---|---|---|
| 10 | NaOH | 40–150 | HI (40 wt%) | 0.183 | 221 |
| 11 | 5 wt% NaOH/methanol | 50–100 | HI (40 wt%) | 0.14 | 2.5 × 10⁴ |
| 13 | Aqueous KOH; CaCl2; CuSO4 | 6 | HI (30 wt%) | 0.36; 0.5; 0.48 | 3.9 × 10⁴; 4 × 10⁴; 3.8 × 10⁴ |
| 21 | Aqueous CTAB | 60 | HI (40 wt%) | 0.18 | 3.5 × 10³ |
| 22 | 5 wt% NaOH ethanol | — | Hydrazine vapor | 20.1 | 4.1 × 10⁴ |
| 26 | 5 wt% NaOH ethanol | ≈26 | HI (40%) | 0.19 | 2.3 × 10⁴ |
| 25 | Ethanol | 10–60 | HI (40 wt%) | 0.24 | 3.1 × 10⁴ |
| 28 | Glass pipeline | 35 | Thermal at 800 °C | 0.42 | 103 |
| 29 | Diethyl ether | 50 × 104 | Thermal at 1000 °C | 0.17 | 14 × 103 |
In this study, we aimed to propose scalable and green production of GO and graphene fibres without sacrificing mechanical and electrical properties. First, a mild process of GO synthesis based on Hummer's modified method was conducted while the temperature was reduced and via substitution of nitric acid with phosphoric acid production of NOx pollutant gasses were eliminated.24,30 Afterwards, the GOLCs with dominant nematic phase formation were prepared via ultrasonic homogenization of GO nanosheets in aqueous media. At this stage, no surfactant and/or stabilizing agent was used to achieve 40 mg mL−1 GO concentration with densely packed GO nanosheets. Thus, pristine GO fibres were produced by avoiding the inevitable effect of surfactants and stabilizers on mechanism of electrical conduction. Then, GOLCs were wet-spun and for the first time systematically optimized fibre production line was designed for continuous, strong and electrically conducting graphene fibres. Various processing conditions (e.g. the feeding rate, take up speed and drawing speed) and coagulation composition were investigated and optimized through production (Fig. 1). For fibre finishing, another systematic study on the improvement of electrical conductivity was conducted by exploring the effect of different chemical reduction methods. To the best of our knowledge, this study reports highest specific tensile strength for flexible and electrically conductive graphene-based single fibres, and also reveals the prerequisites of better mechanical, electrical and morphological properties by discussing the optimal material and process parameters. We should also emphasize that starting from GO synthesis to GO fibre reduction, green strategies including material and method selection has been promoted for flexible graphene fibre production.
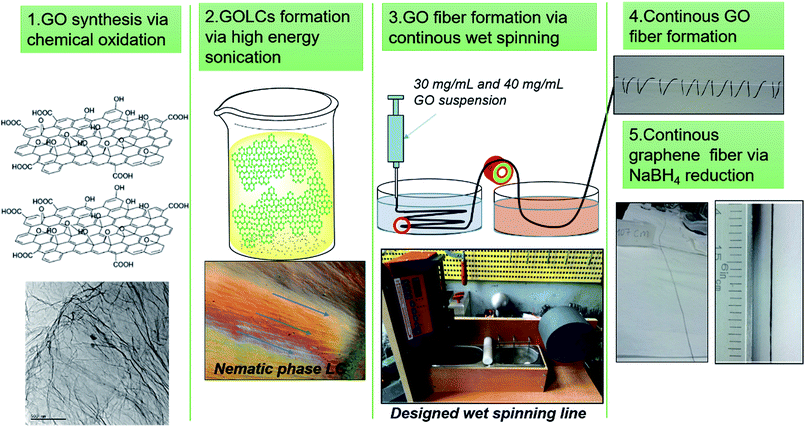 | ||
| Fig. 1 Schematic of continuous GO and electrically conducting graphene fibre formation via designed wet-spinning production line. | ||
Experimental section
Graphene oxide (GO) synthesis via chemical oxidation
Graphite flakes (particle size + 100 mesh (≥75% min) and melting point 3652–3697 °C), potassium permanganate (KMnO4), sulfuric acid (H2SO4), phosphoric acid (H3PO4), hydrogen peroxide (H2O2), hydrogen chloride (HCl), sodium borohydride (NaBH4), hydroiodic acid (HI), ascorbic acid (AA), calcium chloride (CaCl2), sodium hydroxide (NaOH), and ethanol were purchased from Sigma-Aldrich and used without further purification. The improved synthesis protocol was tuned according to Hummer's method during which, KMnO4 was mixed mechanically with natural graphite flakes. As a substantial change of nitric acid (HNO3) in Hummers' modified method,24 H3PO4 was used in this study to have mild conditions30 using the same protocol.5 First, one equivalent mass of graphite powder was put into glass flask placed in oil bath followed by pouring and mixing of KMnO4 and graphite flakes with 6![[thin space (1/6-em)]](https://www.rsc.org/images/entities/char_2009.gif) :
:![[thin space (1/6-em)]](https://www.rsc.org/images/entities/char_2009.gif) 1 mass ratio, respectively. Then, with respect to graphite flake mass fraction, 9
1 mass ratio, respectively. Then, with respect to graphite flake mass fraction, 9![[thin space (1/6-em)]](https://www.rsc.org/images/entities/char_2009.gif) :
:![[thin space (1/6-em)]](https://www.rsc.org/images/entities/char_2009.gif) 1 and 1
1 and 1![[thin space (1/6-em)]](https://www.rsc.org/images/entities/char_2009.gif) :
:![[thin space (1/6-em)]](https://www.rsc.org/images/entities/char_2009.gif) 1 mass ratios of H2SO4 and H3PO4, was added slowly to the initial solid mixture and distilled. The mixture was kept for 24 hours and then cooled by using ice bath. The resultant brownish slurry was introduced to the 20
1 mass ratios of H2SO4 and H3PO4, was added slowly to the initial solid mixture and distilled. The mixture was kept for 24 hours and then cooled by using ice bath. The resultant brownish slurry was introduced to the 20![[thin space (1/6-em)]](https://www.rsc.org/images/entities/char_2009.gif) :
:![[thin space (1/6-em)]](https://www.rsc.org/images/entities/char_2009.gif) 1 (v/v) ice–H2O2 mixture for further neutralization. The final GO powder was washed with DI water and ethanol aqueous solutions several times. The GO nanosheets were dried for 48 hours at 70 °C and conditioned.
1 (v/v) ice–H2O2 mixture for further neutralization. The final GO powder was washed with DI water and ethanol aqueous solutions several times. The GO nanosheets were dried for 48 hours at 70 °C and conditioned.
GOLCs formation via high energy sonication
The chemical functionalization provides controlled exfoliation of graphite layers with hydrophilic functional groups.5 Our functionalized GO can be readily dispersed in hydrous media with mild ultrasonic treatment due to the hydrogen bonding affinity of the existed surface functional groups. GOLCs were prepared in DI water at four different GO concentrations as 20, 25, 30 and 40 mg mL−1. Each sample was sonicated during different consecutive periods (4 hours with cool-down intervals) in sonication bath (power: 340 watts) and later high power probe sonicated (power: 650 watts) as detailed in Table S1.† At higher GO concentrations slightly higher energy was consumed. By eye examination, there is no changes observed at each GO concentration level due to tuned ultrasonication power.Wet-spinning of GO fibres
Meter-scale continuous graphene fibres were produced by custom-designed wet-spinning line (Fig. 1). For continuous production of neat GO fibres, the condensed aqueous GOLCs were injected through spinneret into the coagulation media at a rate of 60 μL min−1. Based on previous studies, several chemicals (e.g. KOH, CuSO4, NaOH, CaCl2) were used for coagulation, however the best reported results were obtained at the coagulation baths of 5 wt% and 3 wt% NaOH in ethanol and CaCl2 in 3![[thin space (1/6-em)]](https://www.rsc.org/images/entities/char_2009.gif) :
:![[thin space (1/6-em)]](https://www.rsc.org/images/entities/char_2009.gif) 1 (v/v) ethanol
1 (v/v) ethanol![[thin space (1/6-em)]](https://www.rsc.org/images/entities/char_2009.gif) :
:![[thin space (1/6-em)]](https://www.rsc.org/images/entities/char_2009.gif) DI water solutions. The solidified GO fibre was collected onto the spinning drum at 70 rpm. The process was followed by washing with methanol to remove the residual coagulation chemicals. The collected fibres were dried for 24 hours at room temperature and conditioned. The wet-spinning process was conducted by the continuous spinning/washing custom setup (Fig. 1) and Table 2 gives the detailed fabrication parameters and the sample coding of produced GO fibres in our study. In this prototype spinning line as in industrial scale devices, the main factors such as flow rate, drawing speed through methanol washing with linear velocity 1.3 cm s−1 and take up speed affecting the fibre properties were precisely controlled.
DI water solutions. The solidified GO fibre was collected onto the spinning drum at 70 rpm. The process was followed by washing with methanol to remove the residual coagulation chemicals. The collected fibres were dried for 24 hours at room temperature and conditioned. The wet-spinning process was conducted by the continuous spinning/washing custom setup (Fig. 1) and Table 2 gives the detailed fabrication parameters and the sample coding of produced GO fibres in our study. In this prototype spinning line as in industrial scale devices, the main factors such as flow rate, drawing speed through methanol washing with linear velocity 1.3 cm s−1 and take up speed affecting the fibre properties were precisely controlled.
| GO fibre | GO concentration (mg mL−1) | Coagulation bath concentration (wt%) | Coagulation bath composition |
|---|---|---|---|
| G20N3 | 20 | NaOH (3) | Ethanol |
| G20N5 | 20 | NaOH (5) | Ethanol |
| G20C3 | 20 | CaCl2 (3) | Ethanol![[thin space (1/6-em)]](https://www.rsc.org/images/entities/char_2009.gif) : :![[thin space (1/6-em)]](https://www.rsc.org/images/entities/char_2009.gif) water (3 water (3![[thin space (1/6-em)]](https://www.rsc.org/images/entities/char_2009.gif) : :![[thin space (1/6-em)]](https://www.rsc.org/images/entities/char_2009.gif) 1) 1) |
| G20C5 | 20 | CaCl2 (5) | Ethanol![[thin space (1/6-em)]](https://www.rsc.org/images/entities/char_2009.gif) : :![[thin space (1/6-em)]](https://www.rsc.org/images/entities/char_2009.gif) water (3 water (3![[thin space (1/6-em)]](https://www.rsc.org/images/entities/char_2009.gif) : :![[thin space (1/6-em)]](https://www.rsc.org/images/entities/char_2009.gif) 1) 1) |
| G25N3 | 25 | NaOH (3) | Ethanol |
| G25N5 | 25 | NaOH (5) | Ethanol |
| G25C3 | 25 | CaCl2 (3) | Ethanol![[thin space (1/6-em)]](https://www.rsc.org/images/entities/char_2009.gif) : :![[thin space (1/6-em)]](https://www.rsc.org/images/entities/char_2009.gif) water (3 water (3![[thin space (1/6-em)]](https://www.rsc.org/images/entities/char_2009.gif) : :![[thin space (1/6-em)]](https://www.rsc.org/images/entities/char_2009.gif) 1) 1) |
| G25C5 | 25 | CaCl2 (5) | Ethanol![[thin space (1/6-em)]](https://www.rsc.org/images/entities/char_2009.gif) : :![[thin space (1/6-em)]](https://www.rsc.org/images/entities/char_2009.gif) water (3 water (3![[thin space (1/6-em)]](https://www.rsc.org/images/entities/char_2009.gif) : :![[thin space (1/6-em)]](https://www.rsc.org/images/entities/char_2009.gif) 1) 1) |
| G30N3 | 30 | NaOH (3) | Ethanol |
| G30N5 | 30 | NaOH (5) | Ethanol |
| G30C3 | 30 | CaCl2 (3) | Ethanol![[thin space (1/6-em)]](https://www.rsc.org/images/entities/char_2009.gif) : :![[thin space (1/6-em)]](https://www.rsc.org/images/entities/char_2009.gif) water (3 water (3![[thin space (1/6-em)]](https://www.rsc.org/images/entities/char_2009.gif) : :![[thin space (1/6-em)]](https://www.rsc.org/images/entities/char_2009.gif) 1) 1) |
| G30C5 | 30 | CaCl2 (5) | Ethanol![[thin space (1/6-em)]](https://www.rsc.org/images/entities/char_2009.gif) : :![[thin space (1/6-em)]](https://www.rsc.org/images/entities/char_2009.gif) water (3 water (3![[thin space (1/6-em)]](https://www.rsc.org/images/entities/char_2009.gif) : :![[thin space (1/6-em)]](https://www.rsc.org/images/entities/char_2009.gif) 1) 1) |
| G40N3 | 40 | NaOH (3) | Ethanol |
| G40N5 | 40 | NaOH (5) | Ethanol |
| G40C3 | 40 | CaCl2 (3) | Ethanol![[thin space (1/6-em)]](https://www.rsc.org/images/entities/char_2009.gif) : :![[thin space (1/6-em)]](https://www.rsc.org/images/entities/char_2009.gif) water (3 water (3![[thin space (1/6-em)]](https://www.rsc.org/images/entities/char_2009.gif) : :![[thin space (1/6-em)]](https://www.rsc.org/images/entities/char_2009.gif) 1) 1) |
| G40C5 | 40 | CaCl2 (5) | Ethanol![[thin space (1/6-em)]](https://www.rsc.org/images/entities/char_2009.gif) : :![[thin space (1/6-em)]](https://www.rsc.org/images/entities/char_2009.gif) water (3 water (3![[thin space (1/6-em)]](https://www.rsc.org/images/entities/char_2009.gif) : :![[thin space (1/6-em)]](https://www.rsc.org/images/entities/char_2009.gif) 1) 1) |
Chemical reduction of GO fibres
Three different reduction method were conducted as: (i) reduction with HI aqueous solution 55 wt%, at 100 °C,17 (ii) AA reduction, 2 mM solution in DI water at 60 °C![[thin space (1/6-em)]](https://www.rsc.org/images/entities/char_2009.gif) 31 and (iii) (NaBH4)32 aqueous solution reduction. At this step, we explored the alternatives of harsh methods of hydrazine reduction and thermal reduction (see Table 1), so the proposed methodology could be easily implemented in large scale production. The reduced fibres were then washed with DI water for chemical removal and dried overnight at 60 °C. A series of optimization studies was conducted based on the electrical conductivity of reduced fibres, by tuning time, temperature and concentration.
31 and (iii) (NaBH4)32 aqueous solution reduction. At this step, we explored the alternatives of harsh methods of hydrazine reduction and thermal reduction (see Table 1), so the proposed methodology could be easily implemented in large scale production. The reduced fibres were then washed with DI water for chemical removal and dried overnight at 60 °C. A series of optimization studies was conducted based on the electrical conductivity of reduced fibres, by tuning time, temperature and concentration.
Characterization of GO nanosheets, GOLCs, GO fibres and graphene fibres
X-ray Diffraction (XRD) measurements of GO nanosheets, GO fibres and graphene fibres were performed with Bruker D-8 Advance X-Ray Diffractometer. The wavelength of irradiation of Cu Kα was 0.154 nm. The scan rate was 2.4° min−1 with the operating voltage of 40 kV and current of 40 mA. XRD measurements were carried out at 2θ angle ranging from 5° to 90°. Raman spectroscopy investigations were conducted via Renishaw Raman spectrometer with a laser, excitation line at 532 nm, at spectral range of 100–3200 cm−1. Polarized optical microscopy (POM) measurements of the GOLCs were conducted with a Carl Zeiss Axio Scope A1 MAT model POM in cross-polarized mode. For POM sample preparation, liquid nitrogen immersion for a few minutes in order to induce the GO layer packing for high quality imaging. To examine anisotropy of GOLCs, four different GOLCs concentrations as 20, 25, 30, 40 mg mL−1 were studied. Scanning electron microscope (SEM) images were performed on a field emission scanning electron microanalyzer (Zeiss LEO Supra 35 VP) at an acceleration voltage 5 kV in order to monitor the orientation and packing degree of GO fibres. Mechanical properties of the GO fibres were tested by Universal Testing Machine (UTM), Shimadzu AG-X plus with 1 kN load cell. The strain rate was 100 μm min−1 and testing speed was 0.5 mm min−1. ASTM D3379-75 standard was followed. Test specimens were prepared, as shown in Fig. S1,† where the as-spun GO and graphene fibres were placed into frames with fixed 3 cm gauge length. At least 8 specimens were tested for each material set.Electrical conductivity was conducted on the graphene fibres with a CR-Cascade Microtech CP 4-point probe conductivity measurement device. The probe distance was 1 mm. The electrical conductivity (σ) was calculated from the eqn (1)33 as:
 | (1) |
Results and discussion
Structural analysis of GO nanosheets and characterization of GOLCs
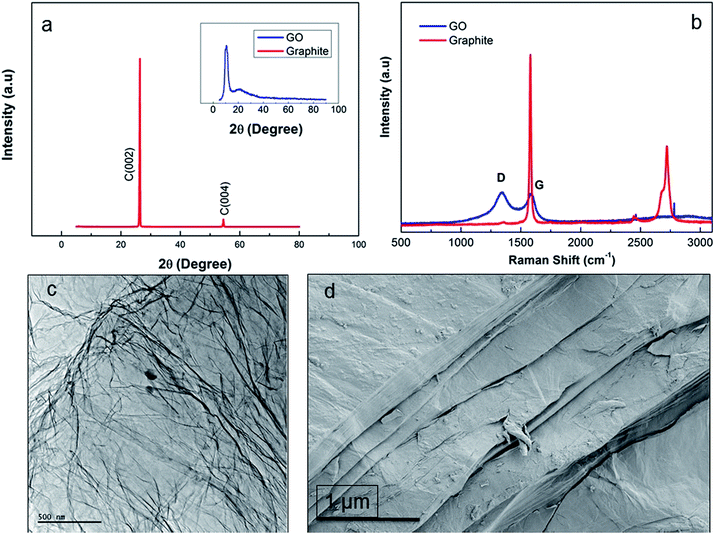
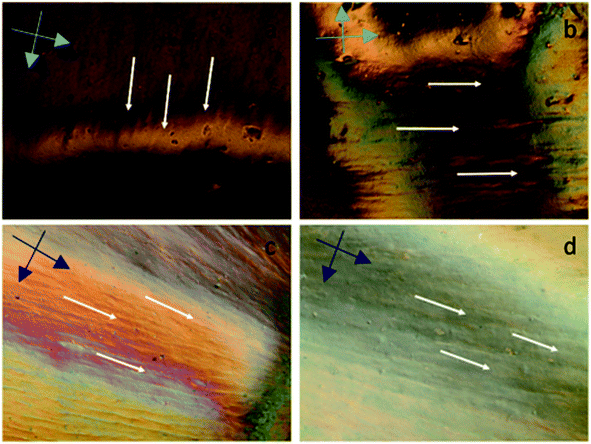
Fig. 2a shows the XRD pattern of synthesized functionality rich GO nanosheets revealing two different 2θ peaks of GO regarded as the proof for the presence of pendant groups and graphene nanosheets. The sharp 2θ peak at 23° pointed out the presence of graphene crystalline structure while the formation of pendant functional groups was confirmed by the broad 2θ peak at around 9°.11 The rich functionalization of graphene layers through the chemical oxidation resulted in increased interlayer spacing of GO.11 Nevertheless, addition of oxygen-containing groups intensified the defect density on the layered structure, thus disturbing the ordered graphite layer packing. The presence of graphene layers also augmented intensity of 2θ at 23° while the packing disturbance prompted through oxidation led to emergence of the 2θ at 9° peak in the GO diffraction compared to graphite layer.5 These two diffractions indicated that the oxidation of graphite layers was not only successful at the bulk but also its extent was enhanced towards the surface edges, where the presence of functionalities at that region was detected by the broad diffraction at around 2θ = 9°. The promoted oxidation for improved graphite layer exfoliation was in line with the observations of Xu et al.13 The intensity ratio of D and G peak (ID/IG) was calculated as 0.8 and 1.04 by integration for graphite and GO, respectively (Fig. 2b). Compared to graphite, ID/IG of GO nanosheets reveals that the density of functional defects was higher in GO due to the increase in interlayer spacing34 while graphite peak at 2750 cm−1 was completely removed from the GO spectrum. TEM micrograph of individual GO sheets (Fig. 2c) showed that large, few-layers of GO can be obtained where physical perturbations were minimized. However, SEM micrograph (Fig. 2d) revealed the multiple layer stacking in solid phase. Thus, one of the prerequisites to produce 3D structured GO fibres, is to have ordered GOLCs where the aligned GO nanosheets has been succeeded (Fig. 3).28The alignment of GOLCs was evaluated in cross-polarized mode POM. The birefringence behaviour of GOLCs assisted to the detection of distinctive domains visible by different contrasts (Fig. 3), which pointed out the local alignment of GO layers in the liquid crystal phase. This local GO stacking reflected the ordinary and extraordinary rays of the polarized light by different angles, thus due to the cross-polarization of reflected light, local contrast differences were detected. To explore GOLCs concentration effect on phase formations, first GOLCs at 20 and 25 mg mL−1 concentrations were studied. Fig. 3a and b revealed the nematic phase formation at these concentrations, whereas due to relatively short-range order of GO nanosheets, the birefringence was quite limited. This effect was interpreted from the few numbers of birefringent sites with different contrasts in their respective POM images.10 At 30 mg mL−1 GO concentration, more distinctive GOLCs alignment leading multiple birefringence was observed (Fig. 3c). The clear change in contrast and colour of nematic phase at higher concentrations was the result of their relatively different interference of ordinary and extraordinary light rays.35 By varying the incident angle and so the interference of each locally aligned stacks, the colour contrast map changed and this enabled to visualize a series of local orientation sites in a single specimen.9 Fig. 3d displayed better alignment compared to lower concentrations so it is predicted that spinning at this concentration tends to form denser and stronger fibres due to long range order of GO layer stacks.10,25
Continuous GO fibre production via wet-spinning line
The continuous GO fibres were produced through a customized spinning line, where spinning and take-up speed were controlled effectively. A syringe pump to dispense GOLCs was used to control feeding rate. The spinneret designed with d/L > 150 ratio was preferred to assist further alignment towards the flow direction for higher layer packing, ultimately for better fibre properties. Then, additional washing step was added to remove the coagulation bath residues by the aid of hydroxide groups in methanol. At this step, the residual NaOH and CaCl2 moieties remained on fibres was also neutralized, thus improving the green nature of GO fibres. Besides, H2O molecules interacted with GO was partially removed via dehydration of fibres, promoting an easier drying process. As an experimental point of view, the results showed that unwashed fibres had entrapped H2O molecules even after three days while the methanol washed fibres were fully dry within a few minutes. Thus these dry fibres could be easily collected by a rotating drum without any noticeable damage.The effect of coagulation media on structural and mechanical properties of fibres is still intriguing. Herein, we systematically studied the material parameters such as coagulation chemicals (e.g. CaCl2, NaOH), their concentrations (e.g. 3 wt%, 5 wt%) and coagulation composition (e.g. ethanol, ethanol![[thin space (1/6-em)]](https://www.rsc.org/images/entities/char_2009.gif) :
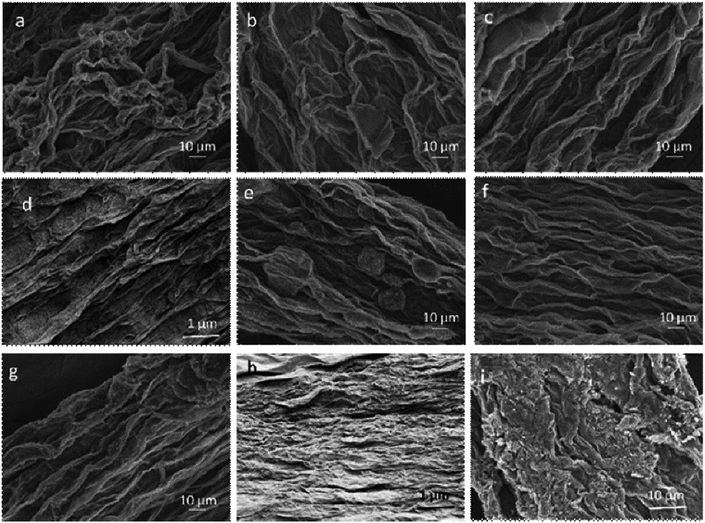
:![[thin space (1/6-em)]](https://www.rsc.org/images/entities/char_2009.gif) water), as detailed in Table 2. Fibres coagulated in CaCl2 coagulation bath (Fig. 4a–d) showed higher packing density compared to their equivalent GO fibres coagulated in NaOH (Fig. 4f to h). Nevertheless, we should emphasize that as in G40C5 and G40N5 fibres coagulated in NaOH (Fig. 4d and h), the packing density could be enhanced by increasing GO content. At such high GOLCs concentrations, the infusion of metal ions in coagulation bath could be prevented due to GO layer alignment and packing.28 Thus, Fig. 4d and h exhibited similar packing densities free from coagulation medium. As expected, the surface topologies of low GO concentration fibres (e.g. 20 mg mL−1 and 25 mg mL−1) were significantly different from high GO concentration fibres (e.g. 30 mg mL−1 and 40 mg mL−1) in both coagulation media. The GO fibres produced from 20 mg mL−1 (Fig. 4a and e), and 25 mg mL−1 suspensions (Fig. 4b and f) had noticeable wrinkling effect and some irregular features. When GO concentration increased to 30 mg mL−1 (Fig. 4c and g) and 40 mg mL−1 (Fig. 4d and h), such loose and irregular features were transformed to highly packed and extremely aligned structures. These densely packed fibres could withstand drawing and further finishing stresses during spinning, with showing higher tensile strength. Therefore, we observed that fibre formation was more successful even up to several meters at higher GOLCs concentration (e.g. 30 mg mL−1 and 40 mg mL−1) (Fig. 1). It is noteworthy that the reservoir capacity significantly affects the final fibre length in our spinning line and as predicted, larger reservoir leads to longer fibres.13,29
water), as detailed in Table 2. Fibres coagulated in CaCl2 coagulation bath (Fig. 4a–d) showed higher packing density compared to their equivalent GO fibres coagulated in NaOH (Fig. 4f to h). Nevertheless, we should emphasize that as in G40C5 and G40N5 fibres coagulated in NaOH (Fig. 4d and h), the packing density could be enhanced by increasing GO content. At such high GOLCs concentrations, the infusion of metal ions in coagulation bath could be prevented due to GO layer alignment and packing.28 Thus, Fig. 4d and h exhibited similar packing densities free from coagulation medium. As expected, the surface topologies of low GO concentration fibres (e.g. 20 mg mL−1 and 25 mg mL−1) were significantly different from high GO concentration fibres (e.g. 30 mg mL−1 and 40 mg mL−1) in both coagulation media. The GO fibres produced from 20 mg mL−1 (Fig. 4a and e), and 25 mg mL−1 suspensions (Fig. 4b and f) had noticeable wrinkling effect and some irregular features. When GO concentration increased to 30 mg mL−1 (Fig. 4c and g) and 40 mg mL−1 (Fig. 4d and h), such loose and irregular features were transformed to highly packed and extremely aligned structures. These densely packed fibres could withstand drawing and further finishing stresses during spinning, with showing higher tensile strength. Therefore, we observed that fibre formation was more successful even up to several meters at higher GOLCs concentration (e.g. 30 mg mL−1 and 40 mg mL−1) (Fig. 1). It is noteworthy that the reservoir capacity significantly affects the final fibre length in our spinning line and as predicted, larger reservoir leads to longer fibres.13,29
Mechanical properties of GO fibres
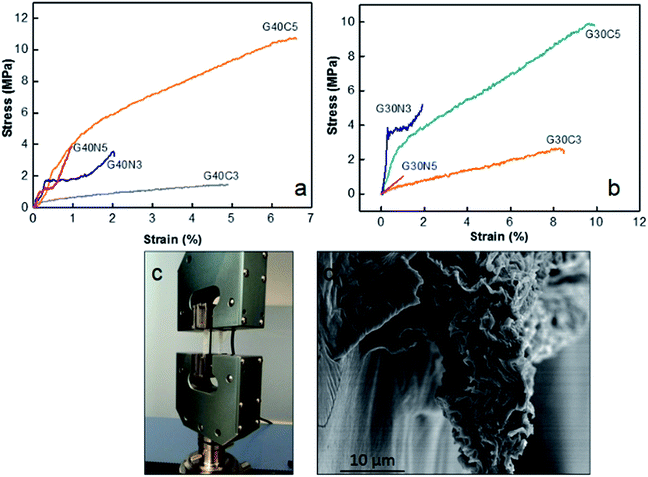
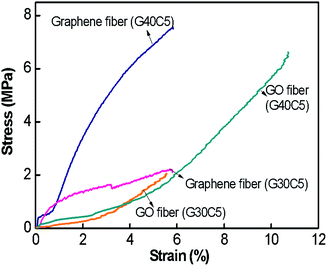
GOLCs concentration, coagulation bath media and stress applied during spinning process has major effect on the final fibre properties. First, tensile properties of 40 mg mL−1 GO fibres (Fig. 5a) and 30 mg mL−1 GO fibres (Fig. 5b) coagulated in different media (detailed in Table 2) were compared. Each single fibre was implemented into UTM as shown in Fig. 5c, where the cross-section of fibres might be varied due to their crumbled layered structures. Thus, as displayed in Table 3, specific ultimate strength (N/tex) was also calculated for each fibre class to eliminate fibre diameter effect due to the different ion diffusion mechanism in CaCl2 and NaOH media. The results suggested that enhancement in the ultimate tensile strength of as-spun GO fibres due to higher GO concentration and GO stacking had minor effect about 10% depending on the coagulation medium, whereas strain to failure (%) decreased in general.| GO fibre | Diameter (μm) | Strain to failure (%) | Specific ultimate strength (N/tex) |
|---|---|---|---|
| As-spun G30C5 | 130 | 10 ± 2.1 | 7 ± 0.5 |
| As-spun G40C5 | 130 | 6.7 ± 0.5 | 5.9 ± 1.3 |
| Reduced G30C5 | 229 | 4.7 ± 0.5 | 4.5 ± 2 |
| Reduced G40C5 | 271 | 2.8 ± 1.7 | 14.5 ± 0.4 |
| As-spun G30N5 | 189 | 1.3 ± 0.2 | 5.8 ± 1.5 |
| As-spun G40N5 | 203 | 0.9 ± 0.1 | 6.4 ± 0.7 |
| GO fibre ref. 26 (draw ratio 1.09) | 26 | 1.64 ± 0.12 | 1.04 ± 0.01 |
| GO fibre ref. 26 (draw ratio 1.27) | 26 | 0.84 ± 0.08 | 1.26 ± 0.01 |
| Reduced GO fibre ref. 38 | 240 | 1.5 ± 0.1 | 1.02 ± 0.03 |
Fig. 5a pointed out that at same GO concentration level, the preference of CaCl2 coagulation bath resulted in higher ultimate strength and strain to failure (%). For instance, G40C5 fibres coagulated in 5 wt% CaCl2 medium exhibited 2 fold higher ultimate strength and 5-fold increase in strain to failure compared to as-spun G40N5. Even though the same amount of GO dispensed, as shown in Table 3, mean fibre diameters differed drastically due to differences in ion diffusion mechanism. It is clear that CaCl2 coagulation media which contains divalent Ca2+ ions, contributed to the fibre toughening and produced compact thinner fibres. The interaction between divalent metal ions (Ca2+) and the carboxylic groups of the GO nanosheets has been explained by Park et al.36 They stated that divalent ions easily diffused into the fibre's interior, thus reacted completely with functional sites on the edges of GO sheets, which improved the toughness of the fibres.36 Our results showed that not only ultimate strength but also strain to failure % was affected from these interactions. The affinity of Ca2+ ions towards GO sheets caused compact crumbled intrinsic morphologies and finally finer fibres. Higher number density of contact sites between each nanosheet induced much higher ultimate strain % and assisted plastic deformation mechanism. Meanwhile, the coagulation in NaOH media promoted in situ partial reduction of GO layers, thus reducing the possibility of hydrogen bond network formation among the functional groups at the GO basal planes.12,22 It is noteworthy that GO concentration has minor effect on tensile properties11,37 while packing density and hydrogen bond network26 promoted by coagulation process significantly dominate the mechanical response of fibres. Fig. 4i and 5d demonstrated the fracture surfaces of G30C5 and G40C5, respectively, where G40C5 fibres showed lower ductility than G30C5 fibres. Higher GO content per specific area contributed to brittleness of fibres due to the restrictions on plasticization. Restricted void formation and stress concentration sites might increase the strength while trading the ductility off. Overall, our results have shown that increasing GO content and packing density may alter fibre strength which would result in further changes in segmental mobility and depression of strain to failure (%).
As summarized in Table 3, compared to reference studies, proposed coagulation and washing protocol assembled more flexible (about 9-fold) continuous GO fibres without impeding stiffness.26,38
Continuous graphene fibres via chemical reduction
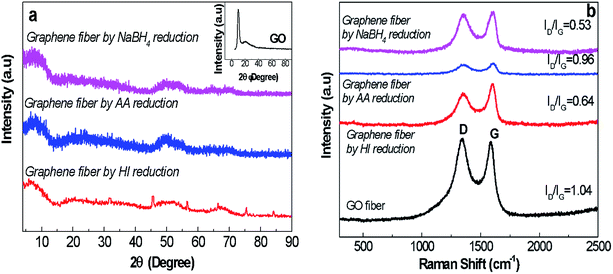 | ||
| Fig. 6 (a) XRD spectra (the inset figure represents the XRD spectrum of GO nanosheets as detailed in Fig. 2) and (b) Raman spectra of GO and graphene fibres reduced by NaBH4, AA and HI agents revealing D peak at 1370 cm−1 and G peak at 1550 cm−1. | ||
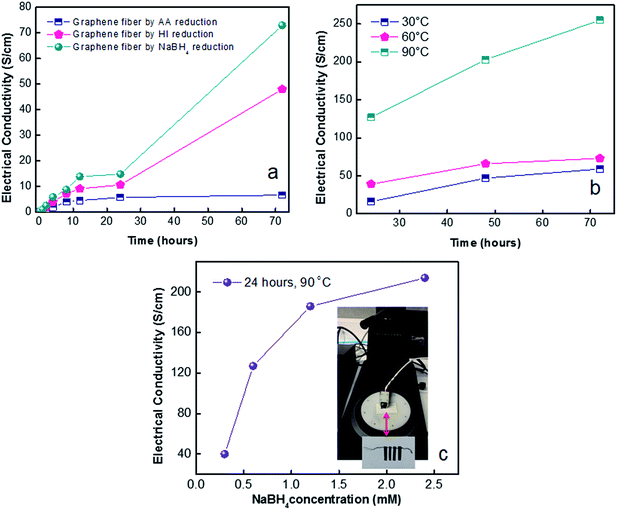
In shorten reaction times at 90 °C, we enquired into NaBH4 concentration effect (from 0.3 M to 2.4 M). Fig. 7c revealed the highest electrical conductivity of 214 S cm−1 along fibre axis prevailed at concentration of 2.4 M NaBH4. The high conductivity of graphene fibres is believed to be due to increased number of reduced sites. This effect further leads to higher conductivity of reduced graphene fibres while preserving the oriented fibre structure which minimized the contact resistance. The combination of good flexibility, high tensile strength and enhanced electrical conductivities of graphene fibres make stretchable wires for promising wearable functional textiles. Thus, G30C5 and G40C5 as-spun GO fibres reduced by eco-friendly NaBH4 (2.4 M) at 90 °C for 24 hours were tested under tensile loading, in next section.
Conclusion
Scalable production of graphene oxide and graphene fibres from stable aqueous GOLCs were fabricated via the designed continuous wet-spinning line while process (e.g. the feeding rate, take up speed and drawing speed) and material parameters including coagulation composition and concentration were precisely controlled through the proposed green approach. The results show that as-spun GO fibres coagulated in CaCl2 ensured promising tensile properties and GO fibres showed strain to failure (%) of 10% with higher specific ultimate strength. NaBH4 reduction approach (ID/IG = 0.53) performed at 90 °C for 24 hours with 2.4 M concentration, enabled facile route to gain electrical conductivity while individual reduced G30C5 fibres exhibited electrical conductivity of 214 S cm−1 along fibre axis. Overall we suggest that green and scalable production of graphene fibres could have promising applications in sensing and wearable electronics since they are non-toxic, flexible and have high tensile strength.Acknowledgements
This research has received funding from the Scientific and Technological Research Council of Turkey (TUBITAK) under project number 214M398. The authors thank to MSc student Ismail Kaya for his help in wet spinning set up.References
- L. Işıkel Şanlı, V. Bayram, B. Yarar, S. Ghobadi and S. Alkan Gürsel, Int. J. Hydrogen Energy, 2016, 41, 3414–3427 CrossRef.
- F. Lin, X. Tong, Y. Wang, J. Bao and Z. M. Wang, Nanoscale Res. Lett., 2015, 10, 435 CrossRef PubMed.
- L. Işıkel Şanlı, V. Bayram, S. Ghobadi, N. Düzen and S. Alkan Gürsel, Int. J. Hydrogen Energy, 2017, 42, 1085–1092 CrossRef.
- H.-P. Cong, J.-F. Chen and S.-H. Yu, Chem. Soc. Rev., 2014, 43, 7239–7456 RSC.
- S. Ghobadi, S. Sadighikia, M. Papila, F. Ç. Cebeci and S. A. Gürsel, RSC Adv., 2015, 5, 85009–85018 RSC.
- S. Ghobadi, S. Mehraeen, R. Bakhtiari, B. Shamloo, V. Sadhu, M. Papila, F. Ç. Cebeci and S. A. Gürsel, RSC Adv., 2016, 6, 92434–92442 RSC.
- J. Li, G. Wang, H. Zhu, M. Zhang, X. Zheng, Z. Di, X. Liu and X. Wang, Sci. Rep., 2014, 4, 4359 CrossRef PubMed.
- T. Mosciatti, S. Haar, F. Liscio, A. Ciesielski, E. Orgiu and P. Samorì, ACS Nano, 2015, 9, 2357–2367 CrossRef CAS PubMed.
- Z. Xu and C. Gao, Acc. Chem. Res., 2014, 47, 1267–1276 CrossRef CAS PubMed.
- R. Jalili, S. H. Aboutalebi, D. Esrafilzadeh, R. L. Shepherd, J. Chen, S. Aminorroaya-Yamini, K. Konstantinov, A. I. Minett, J. M. Razal and G. G. Wallace, Adv. Funct. Mater., 2013, 23, 5345–5354 CrossRef CAS.
- Z. Xu and C. Gao, Nat. Commun., 2011, 2, 571 CrossRef PubMed.
- P. Kumar, U. N. Maiti, K. E. Lee and S. O. Kim, Carbon, 2014, 80, 453–661 CrossRef CAS.
- Z. Xu, H. Sun, X. Zhao and C. Gao, Adv. Mater., 2013, 25, 188–193 CrossRef CAS PubMed.
- Z. Liu, Z. Li, Z. Xu, Z. Xia, X. Hu, L. Kou, L. Peng, Y. Wei and C. Gao, Chem. Mater., 2014, 26, 6786–6795 CrossRef CAS.
- X. Yang, C. Guo, L. Ji, Y. Li and Y. Tu, Langmuir, 2013, 29, 8103–8107 CrossRef CAS PubMed.
- K. E. Lee, J. J. Oh, T. Yun and S. O. Kim, J. Solid State Chem., 2015, 224, 115–119 CrossRef CAS.
- Z. Tian, C. Xu, J. Li, G. Zhu, Z. Shi and Y. Lin, ACS Appl. Mater. Interfaces, 2013, 5, 1489–1493 CAS.
- B. Dan, N. Behabtu, A. Martinez, J. S. Evans, D. V. Kosynkin, J. M. Tour, M. Pasquali and I. I. Smalyukh, Soft Matter, 2011, 7, 11154–11159 RSC.
- N. Behabtu, J. R. Lomeda, M. J. Green, A. Sinitskii, D. V. Kosynkin, J. Schmidt, E. Kesselman, M. Pasquali, A. L. Higginbotham, D. Tsentalovich, Y. Talmon, A. N. G. Parra-Vasquez, J. M. Tour and Y. Cohen, Nat. Nanotechnol., 2010, 5, 406–411 CrossRef CAS PubMed.
- A. H. Wazir and L. Kakakhel, New Carbon Mater., 2009, 24, 83–88 CrossRef CAS.
- H. P. Cong, X. C. Ren, P. Wang and S. H. Yu, Sci. Rep., 2012, 2, 613 Search PubMed.
- L. Chen, Y. He, S. Chai, H. Qiang, F. Chen and Q. Fu, Nanoscale, 2013, 5, 5809–5815 RSC.
- W. Chen, L. Yan and P. R. Bangal, Carbon, 2010, 48, 1146–1152 CrossRef CAS.
- D. C. Marcano, D. V. Kosynkin, J. M. Berlin, A. Sinitskii, Z. Sun, A. Slesarev, L. B. Alemany, W. Lu and J. M. Tour, ACS Nano, 2010, 4, 4806–4814 CrossRef CAS PubMed.
- G. Huang, C. Hou, Y. Shao, H. Wang, Q. Zhang, Y. Li and M. Zhu, Sci. Rep., 2014, 4, 4248 CrossRef PubMed.
- C. Xiang, C. C. Young, X. Wang, Z. Yan, C. C. Hwang, G. Cerioti, J. Lin, J. Kono, M. Pasquali and J. M. Tour, Adv. Mater., 2013, 25, 4592–4597 CrossRef CAS PubMed.
- S. Hussain, C. Yorucu, I. Ahmed, R. Hussain, B. Chen, M. Bilal Khan, N. A. Siddique and I. U. Rehman, Surf. Coat. Technol., 2014, 258, 458–466 CrossRef CAS.
- Z. Dong, C. Jiang, H. Cheng, Y. Zhao, G. Shi, L. Jiang and L. Qu, Adv. Mater., 2012, 24, 1856–1861 CrossRef CAS PubMed.
- S. Zhang, K. K. Koziol, I. A. Kinloch and A. H. Windle, Small, 2008, 4, 1217–1222 CrossRef CAS PubMed.
- J. W. S. Hummers and R. E. Offeman, J. Am. Chem. Soc., 1958, 80, 1339 CrossRef.
- M. J. Fernández-Merino, J. I. P. L. Guardia, S. Villar-Rodil, P. Solís-Fernández, A. Martínez-Alonso and J. M. D. Tascón, J. Phys. Chem. C, 2010, 114, 6426–6432 Search PubMed.
- H.-J. Shin, K. K. Kim, A. Benayad, S.-M. Yoon, H. K. Park, I.-S. Jung, M. H. Jin, H.-K. Jeong, J. M. Kim, J.-Y. Choi and Y. H. Lee, Adv. Funct. Mater., 2009, 19, 1987–1992 CrossRef CAS.
- D. S. McLachlan, J. Phys. C: Solid State Phys., 1985, 18, 1891–1897 CrossRef CAS.
- F. T. Thema, M. J. Moloto, E. D. Dikio, N. N. Nyangiwe, L. Kotsedi, M. Maaza and M. Khenfouch, J. Chem., 2013, 2013, 6 Search PubMed.
- R. Niu, J. Gong, D. Xu, T. Tang and Z.-Y. Sun, Colloids Surf., A, 2015, 470, 22–30 CrossRef CAS.
- S. Park, K.-S. Lee, G. Bozoklu, W. Cai, S. T. Nguyen and R. S. Ruoff, ACS Nano, 2008, 2, 572–578 CrossRef CAS PubMed.
- Z. Dong, C. Jiang, H. Cheng, Y. Zhao, G. Shi, L. Jiang and L. Qu, Adv. Mater., 2012, 24, 1856–1861 CrossRef CAS PubMed.
- S. Chen, W. Ma, Y. Cheng, Z. Weng, B. Sun, L. Wang, W. Chen, F. Li, M. Zhu and H. M. Cheng, Nano Energy, 2015, 15, 642–653 CrossRef CAS.
- S. Pei, J. Zhao, J. Du, W. Ren and H.-M. Cheng, Carbon, 2010, 48, 4466–4474 CrossRef CAS.
- L. I. Şanlı, V. Bayram, B. Yarar, S. Ghobadi and S. A. Gürsel, Int. J. Hydrogen Energy, 2016, 41, 3414–3427 CrossRef.
- S. Stankovich, D. A. Dikin, R. D. Piner, K. A. Kohlhaas, A. Kleinhammes, Y. Jia, Y. Wu, S. T. Nguyen and R. S. Ruoff, Carbon, 2007, 45, 1558–1565 CrossRef CAS.
Footnote |
| † Electronic supplementary information (ESI) available. See DOI: 10.1039/c7ra03975a |
| This journal is © The Royal Society of Chemistry 2017 |

