 Open Access Article
The driving force for forming As–As bonding and its effect on the electronic structures and the thermoelectric properties of Zintl Ca5M2As6 (M = Sn, Ga)
Dong Bao Luo and
Yuan Xu Wang *
*
Institute for Computational Materials Science, School of Physics and Electronics, Henan University, Kaifeng 475004, People's Republic of China. E-mail: wangyx@henu.edu.cn
First published on 3rd March 2017
Abstract
By using first-principles method, we studied the relation between the arrangement of the MPn4 chains and the electronic structures for Zintl Ca5M2As6 (M = Sn and Ga) compounds. It was found that the connecting forms between the adjacent chains in Ca5M2As56 play a key role in determining their thermoelectric properties. The appearing of As–As bonding or not between adjacent covalent MAs4 chains mainly depends on the different electron configuration between Pn and Ga (or Sn). Such As–As bonding in Ca5Ga2As6 results in a sharp peak of density of states near the conduction band minimum, which will dramatically increase its n-type Seebeck effect. Moreover, the calculated band decomposed charge density demonstrates that the As–As bonding leads to a high charge accumulating along the y-direction for n-type Ca5Ga2As6. Combined with the high electrical conductivity along the covalent anion chain direction, a high electrical conductivity may exist in n-type polycrystal of Ca5Ga2As6. On the other hand, the absence of As–As bonding in Ca5Sn2As6 results in a sharp peak of density of states near the valence band maximum, which can enhance its p-type Seebeck effect. For Ca5Sn2As6, the small anisotropy of electrical conductivity may induce the high electrical value for its p-type polycrystal. Consequently, polycrystalline n-type Ca5Ga2As6 and p-type Ca5Sn2As6 may have good thermoelectric performance.
I. Introduction
As pollution-free energy materials, thermoelectric materials have drawn more and more attentions. The thermoelectric efficiency of a material is governed by its figure of merit ZT = S2σT/κ, where S, σ, T, and κ are the Seebeck coefficient, electrical conductivity, absolute temperature, and thermal conductivity (a sum of the electronic (κe) and lattice (κl) contributions), respectively.1 A good thermoelectric material requires large S, σ, and low κ, simultaneously. However, S and σ have an opposite dependence on carrier concentration, which hinders the wide application of thermoelectric materials. Besides, the reduction of κ usually causes the decrease of electronic mobility. Thus, ideally engineered thermoelectric materials should exhibit “phonon glass, electron crystal” behavior with high mobility and low lattice thermal conductivity, simultaneously.2 It is very important to find methods to meet the specified conditions.Zintl phases are prime candidates for applying the concept to obtain high ZT thermoelectric materials.2 For example, high thermoelectric efficiency has been demonstrated by a number of Zintl phases, such as Yb14MnSb11,3 Ca3AlSb3,4 Sr3AlSb3,5 Sr3GaSb3.6 The excellent performance of these thermoelectric materials benefits from their complex crystal structures and unique electronic structures, which leads to a high electrical conductivity and a low lattice thermal conductivity.7–10 Among the rich chemistry of Zintl compounds, A5M2Pn6 (A = divalent alkaline-earth or rare-earth metals; M = triels; Pn = pnictogen elements) are considered as promising thermoelectric materials. One typical feature of these compounds is one-dimensional anion chains formed by MPn4 tetrahedra. Such covalent polyanion chains have an important effect on their electronic structures and thermoelectric properties. For example, in Ca5Al2Sb6,11 the lightest band mass is parallel to the chains of corner-linked AlSb4, indicating a high electrical conductivity along this direction.
More interestingly, according to the connecting form of the chains, A5M2Pn6 compounds can be divided into two types: first, the adjacent polyanion chains are connected by Pn–Pn dimers in Ca5Ga2As6 structure type;12 second, there is no Pn–Pn bonding in the structure of Ca5Sn2As6 type.13 The thermoelectric properties of the first A5M2Pn6 type has been discussed by Alexandra Zevalkink14 and many other researchers. They reported that the first A5M2Pn6 type compounds exhibit excellent thermoelectric properties by p-type doping. The second type has the similar topology along the c-direction with the first type one, which may also be potential thermoelectric materials. For example, the figure of merit of Eu5Sn2As6 (the second structure type) is comparable to that of undoped Ca5Al2Sb6 (the first structure type).15 However, the effect of formatting Pn–Pn bond or not on the electronic structures and the transport properties of A5M2Pn6 is still an open question. This inspires us to investigate the relationships between the arrangement of MPn4 chains, the electronic structures, and the thermoelectric properties. A5Sn2As6 (A = Ca and Sr) and Ca5Ga2As6 structures are good candidates for trying to ascertain Zintl structure–properties relationship between the first and second structure type. If so, the mechanisms for the high thermoelectric performance in Ca5M2As6 may be uncovered.
In this work, we find that the appearing of As–As bonding or not between adjacent covalent chains mainly depends on the different electron configuration between Pn and Ga (or Sn). By using the first-principles calculations combined with the semiclassical Boltzmann transport theory, we studied the effect of As–As bonding on the thermoelectric transport behavior. Our results demonstrate that the appearing of As–As bonding or not plays a key role on affecting the Seebeck effect and the anisotropy of electrical conductivity. Such As–As bonding in Ca5Ga2As6 results in a sharp peak of density of states near the bottom of the conduction bands, which will dramatically increase its n-type Seebeck effect. Moreover, the calculated band decomposed charge density of Ca5Ga2As6 shows that the As–As bonding leads to a high charge accumulating along the bonding direction. Combined with the high electrical conductivity along the covalent anion chain direction, small anisotropy of electrical conductivity indicates a high electrical value for its n-type polycrystal. Hence, polycrystalline Ca5Ga2As6 may have excellent thermoelectric performance by n-type doping. On the other hand, when there is no formation of As–As bonding in Ca5Sn2As6, the electrons gathered around the As atoms produce a sharp peak of density of states near the top of the valence bands, which will largely enhance its p-type Seebeck effect. Moreover, small anisotropy of the electrical conductivity indicates a high electrical value for p-type polycrystal. Thus, the thermoelectric properties of polycrystalline Ca5Sn2As6 may be enhanced by p-type doping.
II. Computational detail
Vienna Ab initio Simulation Package (VASP)16 based on the projector augmented wave (PAW) method17 was utilized to optimize the geometry. We used the Perdew–Burke–Ernzerhof (PBE) generalized-gradient approximation (GGA)18 to describe the exchange–correlation function. Plane-wave cutoff energy was 450 eV and the energy convergence criterion was chosen to be 10−5 eV. The Hellmann–Feynman forces on each ion are less than 0.02 eV Å−1, and the Brillouin zones of the unit cells were represented by the Monkhorst–Pack special k-point scheme with 5 × 4 × 14 and 4 × 4 × 12 grid meshes for Ca5Sn2As6 and Ca5Ga2As6, respectively.The electronic structures were calculated by the full potential-linearized augmented plane wave (FLAPW) methods19 based on the density functional theory (DFT).20,21 The modified Becke–Johnson (MBJ)22,23 semi-local exchange was employed to improve the band gap, as implemented in the WIEN2k.24–26 The k points of self-consistent calculations are 1000 in the Brillouin zone. The thermoelectric transport properties were calculated through the semiclass Boltzmann theory and rigid band approach, which were implemented in the BoltzTrap code.27 With the Boltzmann theory, the constant scattering time approximation is used. This approximation, which is commonly applied for metals and degenerately doped semiconductors, is based on the assumption that the scattering time determining the electrical conductivity does not vary strongly with energy on the scale of kT. It does not involve any assumption about the possibly strong doping and temperature dependence of τ. In this way, Seebeck coefficient S does not dependent on relaxation time (τ), while the electrical conductivity σ and κe can only be evaluated with respect to the parameter (τ).
III. Results and discussions
A. Lattice structure and stability
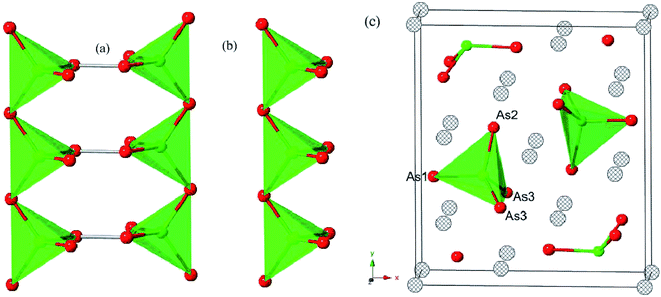
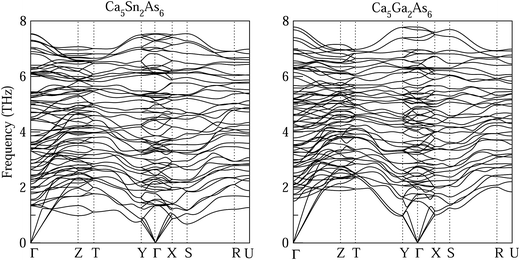
Each optimized Ca5Sn2As6 unit cell contains 26 atoms shown in Fig. 1(c), which is orthorhombic with the space group of pbam and belongs to Sr5Sn2P6 structure type. The optimized lattice constants are a = 11.83 Å, b = 13.64 Å, and c = 4.12 Å. As seen in Fig. 1(b), there are chains of corner-shared SnAs4 tetrahedron along the z-direction, which is similar to the infinite chains of corner-shared GaAs4 tetrahedron along the same direction in Ca5Ga2As6. However, there is no As–As bonding between the chains in Ca5Sn2As6, which is different from Ca5Ga2As6. As can be seen from Fig. 1(b) and (c), the optimized crystal structure of Ca5Sn2As6 is composed of infinite chains of corner-shared SnAs4 tetrahedron along the c-axis that is separated by Ca atoms. The As atoms have three non-equivalent positions, labeled as As1, As2, and As3. The structure along the c-axis is different from that along the a- and b-axis, which may induce a strong anisotropic transport properties along the three directions. In addition, the crystal structures of Ca5Sn2As6 and Sr5Sn2As6 are isomorphic with the different cations. As we know, the crystal structure determines its properties. It is worth investigating the relationship between the structure and transport properties of A5Sn2As6 (A = Ca, Sr) and Ca5Ga2As6.The stability of Ca5M2As6 (M = Sn, Ga) can be judged from their phonon frequency and formation energy. Dynamic stability is important for existing of a new structure because the appearance of soft phonon modes will lead to its distortion. The phonon dispersion curves of Ca5M2As6 were calculated, as shown in Fig. 2. As seen from this figure, there is no imaginary phonon frequency at any of the wave vectors, which shows that they are dynamically stable. On the other hand, the formation energy is a more direct evidence of the stability of a material, which can be estimated from the following:
| ΔE = E(A5M2Pn6) − 5E(A) − 2E(M) − 6E(Pn), | (1) |
B. Electronic structure
To check the difference in the bonding feature of Ca5Sn2As6 and Ca5Ga2As6, we calculated their electron localization function (ELF) and display it in Fig. 3 (the isosurface level of the two compounds are 0.79 and 0.77, respectively.). From Fig. 3(a), a certain degree of charge accumulation occurs midway between Sn and As atoms, suggesting that the Sn–As bonds have significant covalent character. More diffuse regions of charge between As and Ca atoms indicate their ionic bonding features. According to the characteristic infinite chains of lattice structure along the z-direction, Ca5Sn2As6 is expected to have a high electron mobility along the As–Sn–As covalent bonding chains. Ca5Ga2As6 has been reported to have high electrical conductivity along the z-direction due to its one-dimensional lattice structure.28 Consistent with the lattice structure of Ca5Ga2As6, there are some electrons between As1 atoms. Moreover, when the isosurface level is less 0.7, the adjacent GaAs4 chains are shown to be markedly connected by electrons between the As1 atoms, indicating strong covalent As–As bonding. The forming of As–As bond or not in Ca5Sn2As6 may be related to the electronic effect.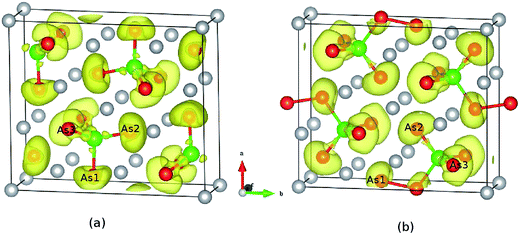 | ||
| Fig. 3 Calculated electron localization function of (a) Ca5Sn2As6 and (b) Ca5Ga2As6. The isosurface value are 0.79 and 0.77, respectively. | ||
Classical Zintl phases are always considered to be valence precise semiconductors. Then, electron counting can analyse the structural difference between Ca5Sn2As6 and Ca5Ga2As6. Ca5Sn2As6 consists of 5 Ca atoms and 2 covalent SnAs3 repeat units, and the 5 Ca atoms donate 10 electrons. In polyanionic SnAs3, to form 4 covalent bonds with adjoining 4 As, Sn brings 4 electrons to the table and is formally neutral. In addition, the two non-corner sharing As atoms need other 4 electrons and the one corner sharing As atom needs other 1 electron to fill octet rule. We thus conclude the SnAs3 unit requires 5 electrons to satisfy valence. With two tetrahedra per formula unit, we achieve a net cation charge of +10 and polyanionic charge of −10. Valence satisfied and a semiconductor results. There are some difference shown in Ca5Ga2As6. For covalent GaAs3 repeat unit, Ga brings 4 electrons to form 4 covalent bonds with adjoining 4 As atoms, and is formally −1 from a covalent charge counting perspective. In the polyanion, there are 3 unique As atoms. For satisfying the octet rule, the non-corner sharing As needs other 2 electrons, and the corner sharing As needs other one electron, and the bridging As also needs additional one electron. Thus, the two GaAs3 units per formula unit require 10 electrons to satisfy valence, which are corresponding to the 10 electrons donated by 5 Ca atoms. If Ca5Ga2As6 formed in a chain structure without bridging bonds, the anion chains would require an additional electron per GaAs3. In response, an additional Ca would be required. In fact, this yields the known Ca6Ga2As6 structure, which is more commonly called the Ca3GaAs3. Thus, the difference in electron count between Ga and Sn determines the structural shift between Ca5Ga2As6 and Ca5Sn2As6. On the other hand, the structural changes can also be understood from the perspective of electronegativity. Here, we hope to use the ratio of the electronegativity of Pn to that of M to describe the electronegativity of polyanion MPn4 tetrahedron for A5M2Pn6. Table 1 lists the electronegativity values of related elements and polyanion MPn4. For Ca5Ga2As6 structure type with Pn–Pn bonding, the electronegativity ratios of Ca5Ga2As6 (1.13), Ca5Al2Sb6 (1.27), Ca5Ga2Sb6 (1.13), Ca5In2Sb6 (1.15), are above 1.13. For the Sr5Sn2P6 structure type without Pn–Pn bonding, the electronegativity ratios of Sr5Sn2P6 (1.12) and Ca5Sn2As6 (1.11) are less than 1.12. Thus, the electronegativity of MPn4 plays a key role for forming As–As dimmer bridging two adjacent GaAs4 tetrahedron chains. In the case of the equal number of cations in different cells, when the electronegativity ratio is large, the anionic group can obtain more electrons from other atoms, which leads to the smaller cell volume of Ca5Ga2As6 compared with Ca5Sn2As6. Therefore, subtle changes in the lattice structures of Ca5Ga2As6 to Ca5Sn2As6 are possibly due to the changes of the ratio of the electronegativity of polyanion. Moreover, it is more important to relate the As–As bonding to the thermoelectric performance.
| Type | A5M2Pn6 | A | M | Pn | Pn/M |
|---|---|---|---|---|---|
| Sr5Sn2P6 type | Ca5Sn2As6 | 1.00 | 1.96 | 2.18 | 1.11 |
| Sr5Sn2As6 | 0.95 | 1.96 | 2.18 | 1.11 | |
| Sr5Sn2P6 | 0.95 | 1.96 | 2.19 | 1.12 | |
| Ca5Ga2As6 type | Ca5Ga2Sb6 | 1.00 | 1.81 | 2.05 | 1.13 |
| Ca5In2Sb6 | 1.00 | 1.78 | 2.05 | 1.15 | |
| Ca5Ga2As6 | 1.00 | 1.81 | 2.18 | 1.20 | |
| Ca5Al2Sb6 | 1.00 | 1.61 | 2.05 | 1.27 |
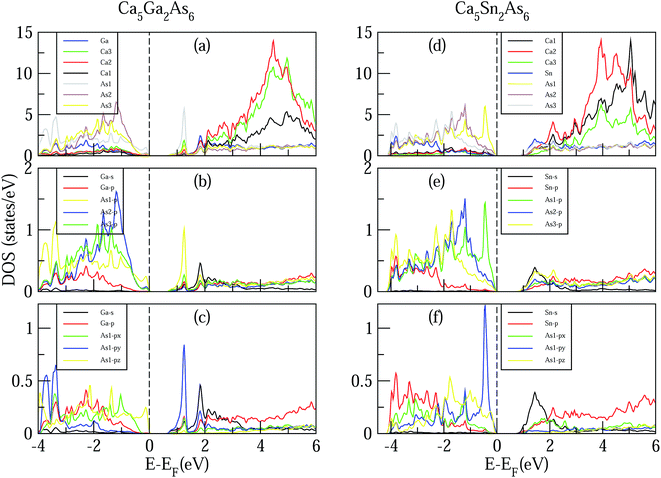
Now we turn to study the effect of As–As bonding on the electronic structures of Ca5M2As6 (M = Ga, Sn). Fig. 4 shows the calculated DOS of Ca5M2As6 compounds. As can be seen from Fig. 4, for Ca5Ga2As6 with As–As bonding, a sharp DOS peak appears on the bottom of conduction bands and is mainly contributed by As1 p orbital. Thus, the As–As bonding makes a great contribution to the sharp DOS peak on the bottom of conduction bands. The thermopower is proportional to the derivative of the DOS. The great derivative of DOS near the Fermi level will result in a large thermopower. Thus, n-type doping should increase largely the Seebeck effect of Ca5Ga2As6. As seen from Fig. 4(d), for Ca5Sn2As6 without As–As bonding, a sharp DOS peak appears on the top of valence bands, which may increase its p-type Seebeck effect. Thus, the thermopower of p-type Ca5Sn2As6 may be larger than that of n-type one, which is mainly contributed by the sharp DOS peak of As1 atoms near the valence band maximum (VBM). Therefore, the formation of As–As bonding or not leads to the different location of sharp DOS peaks in Ca5Ga2As6 and Ca5Sn2As6, which may strongly increase the Seebeck effect of n-type Ca5Ga2As6 and p-type Ca5Sn2As6.
For Ca5Ga2As6, the valence bands maximum (VBM) is mainly dominated by As atoms by the order As1 > As2 > As3 from −1 to 0 eV, and the conduction bands minimum CBM is primarily dominated by Sn and As1 atoms from 0.75 to 1.5 eV. From 3 to 6 eV, the DOS is primarily formed by Ca atoms, which is consistent with the assumption that Ca atoms donate their valence electrons to the anionic substructure. From Fig. 4(b), the Sn s-orbit hybridizes with the As p state, which forms the bonding and anti-bonding states from −4 to −1.5 eV and 0.75 to 2 eV, respectively. The conduction bands, and, in particular, the conduction band minimum (CBM) states, are derived from the hybridizations of Sn s, As1 p, As2 p, As3 p, and Sn p orbits. From Fig. 3(a)–(c), the general situation of Ca5Sn2As6 demonstrates that the As1 and Sn atoms play an important role in transport properties.
It is also interesting to explore the effect of As–As bonding on the electrical conductivity of Ca5M2As6. The electrical conductivity of a material mainly depends on its states near the VBM and CBM. For Ca5Ga2As6 with As–As bonding, near the bottom of conduction bands, the states of As py are much larger than those of As1 px and As1 pz, indicating the high electrical conductivity along the high electrical conductivity along the y-direction. Moreover, the electrical conductivity along the covalent chain direction should be also high. Thus, Ca5Ga2As6 should have high electrical conductivity both along the y- and z-direction, which will induce a high electrical conductivity in n-type polycrystalline Ca5Ga2As6. For Ca5Sn2As6 without As–As bonding, near the top of valence bands, the states of As1 py are much larger than those of As1 px and As1 pz, which will increase the electrical conductivity along the y-direction by p-type doping. Combined with high electrical conductivity along the covalent chain direction, p-type polycrystalline Ca5Sn2As6 might have a high electrical conductivity.
For further show the charge accumulation of the As–As bonding, we calculated the band decomposed charge densities of Ca5Ga2As6 from −4 to −3 eV, −2.5 to −1.5 eV, −1.0 to 0 eV, and 0 to 1 eV shown in Fig. 5. It is clearly seen that the As1–As1 dimers form σ-bonding and σ*-antibonding in Fig. 5(a) and (d), and weak π-bonding and π*-antibonding as shown in Fig. 5(b) and (c), respectively. For the top of valence bands, the character of π*-antibonding makes many electrons gathering along the anion chain direction, which is favorable to form a conductive path along this direction. On the other hand, for the bottom of conduction bands, the feature of σ*-antibonding causes an accumulation of electrons along the y-direction (As–As bonding direction), which may lead to a higher electrical conductivity along this direction than that of Ca5Sn2As6 without As1–As1 bonding along the same direction.
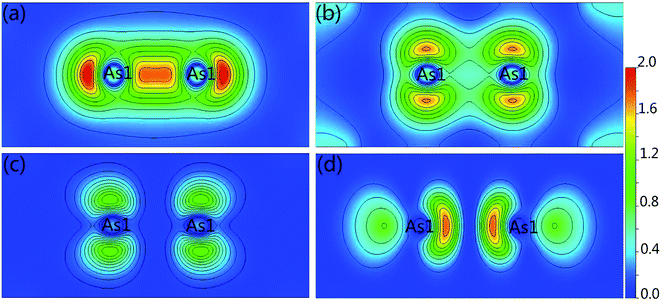 | ||
| Fig. 5 Band decomposed charge density of Ca5Ga2As6 from (a) −4 to −3 eV, (b) −2.5 to 1.5 eV, (c) −1 to 0 eV, and (d) 0 to 1 eV for the (100) plane, respectively. | ||
In addition to band shape near band edge, band gap also strongly affects electrical transport properties. As known, the MBJ semi-local exchange can obtain an accurate band gap approaching experimental value, such as the calculated band gap value (5.08 eV) of LiH is very agreement with the experimental value (5.0 eV).29 Therefore, the band structures of Ca5Sn2As6 and Ca5Ga2As6 with the MBJ semi-local exchange employed in WIEN2k were calculated and shown in Fig. 6. In order to verify the reliability of the calculated band structures, we also calculated the band of Ca5M2As6 with the MBJ semi-local exchange employed in VASP shown in Fig. 6(c) and (d). And, the band shape by VASP is very similar to that by WIEN2k. Moreover, it is interesting to discuss the difference in their band gap and the origin of such difference. From this figure, Ca5Sn2As6 and Ca5Ga2As6 are semiconductors with an indirect band gap and a direct band gap, respectively. Sr5Sn2As6 is same with the former one.30 The order of the band gaps is Ca5Sn2As6 (0.72 eV) > Ca5Ga2As6 (0.65 eV) > Sr5Sn2As6 (0.55 eV), indicating the lowest intrinsic carrier concentration for Ca5Sn2As6 at same temperature. As seen on the top of the valence bands of Ca5Ga2As6, the three bands at Γ point around −0.25 eV are close in energy. The three bands may be converged at high temperature, which may increase the Seebeck coefficient of Ca5Ga2As6 at high temperature. For A5M2As6 Zintl compounds, the cations donate electrons to the anions, which determines the location of the Fermi level, with a little effect on the band shape near the Fermi level.
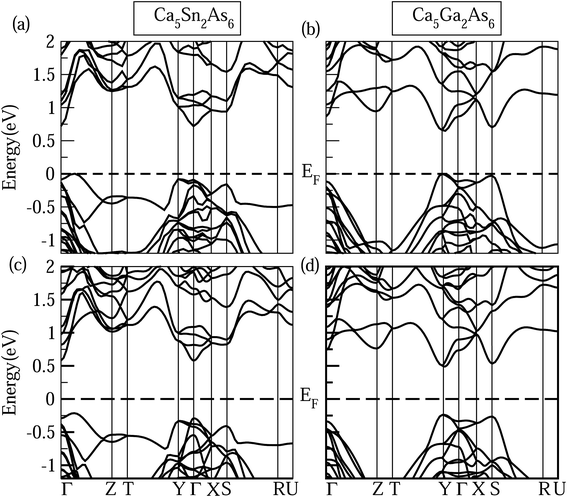 | ||
| Fig. 6 Calculated band structures of Ca5M2As6 (M = Sn, Ga) by (a) and (b) WIEN2k and (c) and (d) VASP. | ||
The different band gaps of Ca5Sn2As6 and Sr5Sn2As6 are mainly due to the fact that the interaction between Ca and As atom is stronger than that between Sr and As atoms. The possible reason is that Ca and As atoms lie in the same period of Periodic Table of the Elements (PTE), which have close energy of valence electrons and consequently the lower bonding states and higher antibonding states in energy. Thus, Ca5Sn2As6 will have a large band gap. This also appears in other similar compounds, such as that the band gap of Sr5Al2Sb6 (0.80 eV)31 is larger than that of Ca5Al2Sb6 (0.50 eV).11 Hence, A atoms affect the band gap strongly, while the M atom substitution has a large influence on the changing of band shape near the Fermi level.
C. Thermoelectric transport properties
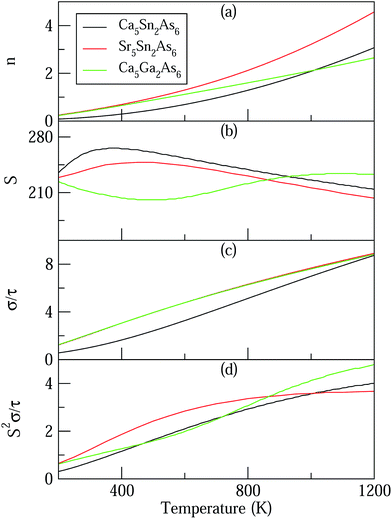
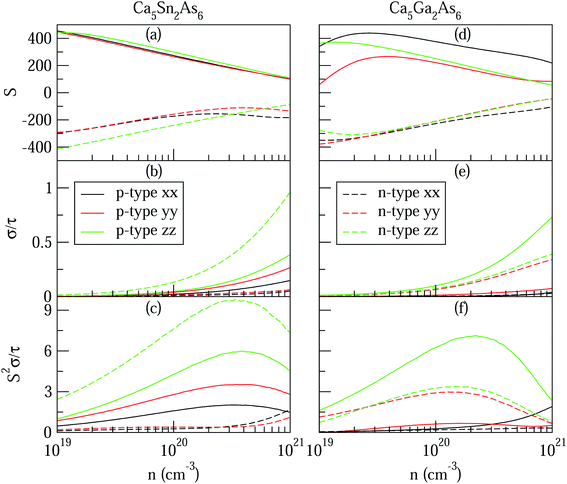
Based on the calculated band structures of Ca5M2As6 (M = Sn, Ga), the thermoelectric transport properties can be evaluated by using the semiclassical Boltzmann theory and rigid-band model. Although the predictive power of the model is limited by inducing constant relaxation time assumption, the results are valuable for comparison. Here, we just use them for confirming the conclusion obtained from the electronic structure above, and qualitative comparison of thermoelectric performance for these compounds. As well known, small difference in the band gaps of Ca5Sn2As6, Sr5Sn2As6, and Ca5Ga2As6 will lead to a large degree difference on the transport properties. To have a good view of the trend, we calculated carrier concentration (n), Seebeck coefficient (S), electrical conductivity with respect to relaxation time (σ/τ), and power factor with respect to relaxation time (S2σ/τ) as a function of temperature shown in Fig. 7. Fig. 7(a) shows that the carrier concentration of A5M2As6 compounds increases with the increasing of temperature due to thermal excitation. It is known that a narrow band gap induces large carrier concentration. Hence, the order of the carrier concentration at same temperature is Ca5Sn2As6 < Ca5Ga2As6 < Sr5Sn2As6, which is in agreement with the order of the band gaps. However, the carrier concentration of Ca5Sn2As6 is larger than that of Ca5Ga2As6 above 1000 K, which is mainly due to the fact that more bands near the VBM for Ca5Sn2As6 may excite more electrons at high temperature.As can be seen in Fig. 7(b), the S value is positive over the studied entire temperature range, indicating the p-type transport of A5M2As6. S increases with the increasing of temperature, and reaches the maximum values of 266 (μV K−1) at 390 K and 248 (μV K−1) at 500 K for Ca5Sn2As6 and Sr5Sn2As6, respectively, and then decreases. Nevertheless, S of Ca5Ga2As6 decreases first with the increasing of temperature, and reaches the minimum value of 201 (μV K−1) at 500 K, and then increases. Maximum S is 234 (μV K−1) at 1050 K.
 | (2) |
As can be explained from eqn (2), the decreasing of S from 300 K to 500 K is mainly due to the increasing of carrier concentration, and the increasing of S from 500 K to 1000 K is mostly due to the increasing of temperature. The increasing of temperature may induce the convergence of the bands at Γ point on the top of valence bands of Ca5Ga2As6. Consequently, the Seebeck coefficient of Ca5Ga2As6 will be increased at high temperature. As indicated by the formula  (r = κe/κ and L is the Lorentz constant), it is impossible to obtain high ZT value without large S.32 Hence, Ca5Sn2As6 is a promising thermoelectric material due to its large Seebeck coefficient over a wide temperature range. For Fig. 6(c) and (d), σ/τ increases with the increasing of temperature, which means that the excited carriers increase. S2σ/τ for Ca5Sn2As6 increases with the increasing of temperature and then remains large values. It reaches the largest value of 3.9 × 10¹¹ W K−2 m−1 s−1 at 1050 K, which is smaller than that of Ca5Ga2As6 (4.5 × 10¹¹ W K−2 m−1 s−1 at 1100 K). The relatively low S2σ/τ of Ca5Sn2As6 may be due to its low carrier concentration, which can be solved by doping. The simulation of doping along different directions will be considered in detail next.
The high anisotropy of the lattice structure for Ca5M2As6 (M = Sn, Ga) will cause a large difference in thermoelectric properties along different directions as shown in Fig. 8. Compared Fig. 8(a) and (d), the varying degree of bipolar reduction in the thermopower of the two compounds is different as the order is: Ca5Sn2As6 < Ca5Ga2As6, which is consisting with the band gap of the compounds by the descending order. As well known, high ZT value needs large Seebeck coefficient. The thermoelectric performance of Ca5Sn2As6 may be promising. On the other hand, the small anisotropy of the Seebeck coefficient and the electrical conductivity appear in the p-type Ca5Sn2As6 and n-type Ca5Ga2As6, which indicates that the polycrystalline samples may have more excellent transport properties by doping. The large Seebeck coefficient for n-type Ca5Ga2As6 and p-type Ca5Sn2As6 comes from the sharp DOS peak appearing near the CBM and the VBM, respectively, which corresponds to the formation of the As–As bonding or not. In addition, σ/τ of Ca5Ga2As6 for n-type along the y-direction is large shown in Fig. 8(e). The reason is the increased electrons gathered along the y-direction, which is caused by the As–As bonding discussed in Fig. 4(d). Then, the electrical conductivity of n-type polycrystalline Ca5Ga2As6 may be large. It also exhibits small anisotropy of the electrical conductivity for p-type Ca5Sn2As6, indicating the large electrical conductivity of p-type polycrystalline Ca5Sn2As6. Moreover, both the Seebeck coefficient and the electrical conductivity along the z-direction are larger than those along the other two directions for p- and n-type Ca5Sn2As6, and it also occurs in n-type Sr5Sn2As6. We believe that high thermoelectric performance along the z-direction could be achieved in p- and n-type Ca5Sn2As6 by doping. On the other hand, when E − μ ≫ kBT, the Mott formula is given by:33
 | (3) |
Therefore, we can understand the Seebeck coefficient from the energy derivative of the log-scale conductivity  . We calculated
  as a function of carrier concentration near the Fermi level for Ca5Sn2As6 at 950 K shown in Fig. 9. For p-type Ca5Sn2As6, the
  are relatively close in all directions, which fits well with the variation of Seebeck coefficient shown in Fig. 8(a). For n-type Ca5Sn2As6, the
  along the z-direction is larger than that along the x- or y-direction from 1 × 10¹⁹ to 5 × 1020 cm−3, and smaller than that along the x-direction from 5 × 10²⁰ to 1 × 1021 cm−3. The Seebeck coefficient along the z-direction is larger than those along the x- or z-direction from 1 × 10¹⁹ to 3 × 1020 cm−3, and smaller than that along the x-direction from 3 × 10²⁰ to 1 × 1021 cm−3, which accords with the change of
  along the z-direction for n-type Ca5Sn2As6. Hence, S and
  along the z-direction are larger than those along other two directions for p- and n-type Ca5Sn2As6, which is due to the larger energy derivative of the log-scale conductivity along the z-direction. It is similar to Sr5Sn2As6 and Ca5Ga2As6.
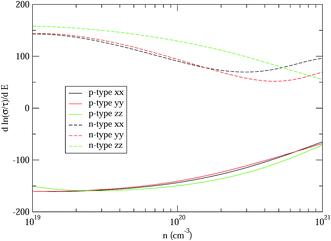 | ||
| Fig. 9 The energy derivative of the log-scale conductivity as a function of carrier concentration of Ca5Sn2As6 from 1 × 10¹⁹ to 1 × 1021 cm−3 along x-, y-, and z-directions at 950 K. | ||
D. Thermal property
As mentioned above, the total thermal conductivity (κ) in a typical thermoelectric material is the sum of electronic (κe) and lattice (κl) contributions. Different from κe, the lattice thermal conductivity is a parameter largely independent of the electrical transport properties, which should be minimized as much as possible for high ZT. The lattice thermal conductivity comes from lattice vibration (phonons). Above the Debye temperature (ΘD), the lattice thermal conductivity decreases with the 1/T temperature dependence expected when scattering is limited by Umklapp phonon–phonon scattering effect. This dependence relationship is maintained until the minimum lattice conductivity (κmin) is reached, which can be approximately calculated by using the following formula:
 | (4) |
 | (5) |
 | (6) |
 | (7) |
 | (8) |
 | (9) |
 | (10) |
 | (11) |
IV. Conclusion
The different electron configuration between Pn and Ga (or Sn) determines whether the As–As bonding appears or not, which affects the Seebeck effect and the anisotropy of electrical conductivity strongly. When forming the As–As bond in Ca5Ga2As6, a sharp peak of density of states appears near the bottom of the conduction bands, which will dramatically increase its n-type Seebeck effect. Moreover, the calculated band decomposed charge density shows that the As–As bonding leads to a high charge accumulating along the y-direction. Combined with the high electrical conductivity along the covalent anion chain direction, a high electrical conductivity may exist in n-type polycrystal of Ca5Ga2As6. Hence, the n-type polycrystal of Ca5Ga2As6 may have a good thermoelectric performance. However, for the absence of As–As bonding in A5Sn2As6 (A = Ca, Sr), a sharp peak of density of states occurs on the top of the valence bands, which will largely enhance its p-type Seebeck effect. For A5Sn2As6, the small anisotropy of electrical conductivity may induce the high electrical value for its p-type polycrystal. In addition, the comparison of the calculated band structures showed that partial A atom substitution can strongly affect the band gap, and the partial M atom substitution has an influence on the band shape near the Fermi level. As a consequence, the optimal band gap of Ca5Sn2As6 results in the relatively small bipolar effect, which is also beneficial for obtaining large Seebeck coefficient. On the other hand, both the Seebeck coefficient and the electrical conductivity along the z-direction are larger than those along other directions for n- and p-type Ca5Sn2As6 and n-type Sr5Sn2As6, while not happen in Ca5Ga2As6, which is mainly due to the larger energy derivative of the log-scale conductivity along the z-direction.Acknowledgements
This research was sponsored by the National Natural Science Foundation of China (No. 51371076 and 11674083), Excellent Youth Foundation of Henan Province (No. 154100510013).References
- D. M. Rowe, CRC handbook of thermoelectrics, CRC press, 1995 Search PubMed
.
- S. M. Kauzlarich, S. R. Brown and G. J. Snyder, Dalton Trans., 2007, 2099–2107 RSC
.
- S. R. Brown, S. M. Kauzlarich, F. Gascoin and G. J. Snyder, Chem. Mater., 2006, 18, 1873–1877 CrossRef CAS
.
- A. Zevalkink, E. S. Toberer, W. G. Zeier, E. Flage-Larsen and G. J. Snyder, Energy Environ. Sci., 2011, 4, 510–518 CAS
.
- A. Zevalkink, G. Pomrehn, Y. Takagiwa, J. Swallow and G. J. Snyder, ChemSusChem, 2013, 6, 2316–2321 CrossRef CAS PubMed
.
- A. Zevalkink, W. G. Zeier, G. Pomrehn, E. Schechtel, W. Tremel and G. J. Snyder, Energy Environ. Sci., 2012, 5, 9121–9128 CAS
.
- S. M. Kauzlarich, Chemistry, structure, and bonding of Zintl phases and ions, VCH, New York, 1996 Search PubMed
.
- A. M. Mills, R. Lam, M. J. Ferguson, L. Deakin and A. Mar, Coord. Chem. Rev., 2002, 233, 207–222 CrossRef
.
- G. A. Slack, Solid State Physics, Academic, New York, 1979 Search PubMed
.
- E. S. Toberer, A. Zevalkink and G. J. Snyder, J. Mater. Chem., 2011, 21, 15843–15852 RSC
.
- A. Zevalkink, G. S. Pomrehn, S. Johnson, J. Swallow, Z. M. Gibbs and G. J. Snyder, Chem. Mater., 2012, 24, 2091–2098 CrossRef CAS
.
- P. Verdier, P. L'Haridon, M. Maunaye and Y. Laurent, Acta Crystallogr., Sect. B: Struct. Crystallogr. Cryst. Chem., 1976, 32, 726–728 CrossRef
.
- B. Eisenmann, H. Jordan and H. Schäfer, Z. Anorg. Allg. Chem., 1985, 530, 74–78 CrossRef CAS
.
- A. Zevalkink, Ph.D. thesis, California Institute of Technology, 2014
.
- J. Wang, S.-Q. Xia and X.-T. Tao, Inorg. Chem., 2012, 51, 5771–5778 CrossRef CAS PubMed
.
- G. Kresse and J. Hafner, J. Phys.: Condens. Matter, 1994, 6, 8245 CrossRef CAS
.
- P. E. Blöchl, Phys. Rev. B: Condens. Matter Mater. Phys., 1994, 50, 17953 CrossRef
.
- D. M. Ceperley and B. Alder, Phys. Rev. Lett., 1980, 45, 566 CrossRef CAS
.
- D. Singh, Plane waves, pseudopotentials and the LAPW method, 1994 Search PubMed
.
- L. H. Thomas, Math. Proc. Cambridge Philos. Soc., 1927, 542–548 CrossRef CAS
.
- E. Fermi, Z. Phys., 1928, 48, 73–79 CrossRef CAS
.
- F. Tran and P. Blaha, Phys. Rev. Lett., 2009, 102, 226401 CrossRef PubMed
.
- E. Engel and S. H. Vosko, Phys. Rev. B: Condens. Matter Mater. Phys., 1993, 47, 13164 CrossRef CAS
.
- D. Koelling and B. Harmon, J. Phys. C: Solid State Phys., 1977, 10, 3107 CrossRef CAS
.
- P. Hohenberg and W. Kohn, Phys. Rev., 1964, 136, B864 CrossRef
.
- P. Blaha, K. Schwarz, G. Madsen, D. Kvasnicka and J. Luitz, WIEN2k: An augmented plane wave+ local orbitals program for calculating crystal properties, Vienna, 2001 Search PubMed
.
- G. K. Madsen and D. J. Singh, Comput. Phys. Commun., 2006, 175, 67–71 CrossRef CAS
.
- Y. L. Yan, Y. X. Wang and G. B. Zhang, J. Mater. Chem., 2012, 22, 20284–20290 RSC
.
- D. J. Singh, Phys. Rev. B: Condens. Matter Mater. Phys., 2010, 82, 205102 CrossRef
.
- D. B. Luo, Y. X. Wang, Y. L. Yan, G. Yang and J. M. Yang, J. Mater. Chem. A, 2014, 2, 15159–15167 CAS
.
- A. Zevalkink, Y. Takagiwa, K. Kitahara, K. Kimura and G. J. Snyder, Dalton Trans., 2014, 43, 4720 RSC
.
- D. J. Singh and D. Parker, J. Appl. Phys., 2013, 114, 143703 CrossRef
.
- D. Guo, C. Hu, Y. Xi and K. Zhang, J. Phys. Chem. C, 2013, 117, 21597–21602 CAS
.
- R. Hill, Proc. Phys. Soc., London, Sect. A, 1952, 65, 349 CrossRef
.
- J. R. Sootsman, D. Y. Chung and M. G. Kanatzidis, Angew. Chem., Int. Ed., 2009, 48, 8616–8639 CrossRef CAS PubMed
.
| This journal is © The Royal Society of Chemistry 2017 |

