 Open Access Article
Creative Commons Attribution 3.0 Unported Licence
Unique properties of silver and copper silica-based nanocomposites as antimicrobial agents
J. Peszkeab,
M. Dulski *bc,
A. Nowak
 ab,
K. Balinab,
M. Zubkoc,
S. Sułowiczd,
B. Nowake,
Z. Piotrowska-Segetd,
E. Talika,
M. Wojtyniakab,
A. Mrozek-Wilczkiewiczab,
K. Malarzbf and
J. Szadeab
aA. Chełkowski Institute of Physics, University of Silesia, Uniwersytecka 4, 40-007, Katowice, Poland
bSilesian Center for Education and Interdisciplinary Research, 75 Pułku Piechoty 1A, 41-500 Chorzów, Poland. E-mail: mateusz.dulski@us.edu.pl
cInstitute of Material Science, University of Silesia, 75 Pułku Piechoty 1a, 41-500, Chorzów, Poland
dDepartment of Microbiology, University of Silesia, Jagiellońska 28, 40-032 Katowice, Poland
eDepartment of Biochemistry, University of Silesia, Jagiellońska 28, 40-032 Katowice, Poland
fInstitute of Chemistry, University of Silesia, Szkolna 9, 40-007 Katowice, Poland
First published on 26th May 2017
Abstract
The paper reports a new route for the fabrication and determination of physicochemical properties and biological activity, of metallic silica-based nanostructure (Ag/SiO2, Cu/SiO2). A research studies shows mono-dispersed nanoparticles in silica matrix with an average size of 12 nm for silver, as well as 12 nm and 4 nm, respectively for copper in hydrophobic and hydrophilic silica composites. The chemical analysis highlights metallic silver and copper ions heterogeneously distributed in the composite as well as metallic oxides such as Ag2O, Cu2O and CuO in hydrophobic system, and CuO in hydrophilic one. Structural research evidences the presence of amorphous, stoichiometric and non-stoichiometric crystalline phase of silica. Biological studies reveal potentially inhibition of growth gram-positive and gram-negative bacteria as well as microscopic fungi. The size of metal nanoparticles and level of silica hydrophobicity show the highest inhibition bacterial growth for hydrophilic system with embedding inside them, 4 nm in size copper nanoparticles. Finally, cytotoxic interaction against human cells with respect to silver and copper silica-based nanocomposites was not found.
Introduction
Billions of microorganisms interact with human organism every day. Most microorganisms are symbiotic and helpful; however, 30% of them are pathogenic and are able to impact human health. Hence, new solutions for elimination of those pathogens are needed. One of the relatively new ideas for pathogens prevention is the fabrication of new materials, which could combine antibacterial or antifungal properties with long-acting times and neutral influence on the environment. One of the potential solution are metallic nanoparticles (NPs) especially silver, copper, zinc or gold.1–3 Their antimicrobial effect results from the cell membrane and DNA damages,4 interaction with enzymes from thiol groups5 or are associated with generating hydrogen peroxide.6 What is more, the biocidal properties of metallic NPs strongly depend on particle size,7,8 agglomeration9,10 or release rate of metal ions.11,12 It is believed that their impact on natural environment compared to organic compounds is lower.13,14 Hence, metallic nanoparticles are applied to commonly used organic and inorganic products such as cosmetics, detergents, protective wood paints, dietary supplements or pesticides.15–18 The application of metallic NPs has certain limitations linked to the relative ease of leaching of metal ions into the environment. In addition, silver and TiO2 nanoparticles are able to migrate from textile to water, and then with sewage enter into ecosystems.19 As a result, metals can easily accumulate in soil, uptake by plants and finally enter into food chain. What is more, there are not possible to completely separate the toxic effect of silver nanoparticles and silver ions. Das et al. have recently demonstrated that to prevent the formation of Ag+ ions and to reduce its toxicity, the necessary is to combine them with silica and proteins.20 Other solutions are based on fabrication of nanocomposite coatings or by packing metallic nanoparticles in organic or inorganic matrix like polymer, ceramics or glasses.21–23 It turned out, that combination of water soluble polymer (PEG) and AgNPs of suitable sizes (<100 nm) prepared in form of coatings;24–27 or combination of metal nanoparticles with magnetite (Fe3O4) NPs improve antibacterial and biomedical properties.28 However, the most versatile matrices seems to be composed of chemically modified silica. It was shown that the metal ions embedded into silica matrix have vast potential in a variety of applications; especially as a cytotoxic material for bacteria (silver-based system)29 and fungi (copper-based system).29 Copper–silica (Cu/SiO2) nanosystem also revealed an excellent anti-corrosion properties, thermal stability and low conductivity values.30 Moreover, such composites are characterized by slowly discharge of metallic ions from the silica matrix in a long period of time.29 It is worth to mention, that in many cases the effectiveness of those nanocomposites depends strongly on their manufacturing techniques; like chemical reactions,31–35 sol–gel36 or sputtering deposition.14In this paper, we report a chemical synthesis of copper- and silver- silica dioxide nanocomposites (NCs) in the form of nanopowders. Physicochemical analysis including determination of particle shape, size and morphology, as well as phase identification were performed using X-ray diffraction (XRD), Scanning (SEM) and Transmission (TEM) Electron Microscopy. Molecular interactions between elements and distribution of individual elements in composites were identified in detail by infrared and Raman spectroscopies, energy dispersive X-ray (EDX) and X-ray photoelectron spectroscopy (XPS). Antimicrobial activity of the synthesized NCs against bacteria, yeast and fungi was tested. Finally, the control test of the cytotoxicity was performed on human fibroblast cells (NHDF line).
Nanocomposite synthesis
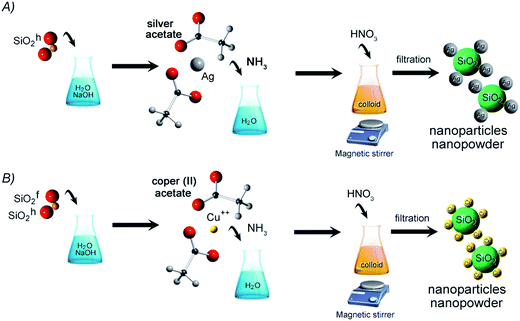
Silver and copper silica-based NCs were synthesized by chemical reaction method. The initial materials included two types of silica – hydrophobic (SiO2h) and hydrophilic (SiO2f), sodium hydroxide, nitric acid, ammonia, silver acetate and copper acetate. All commercially available chemicals were purchased in Avantor Company, Gliwice and were analytical grade (purity above 99.99%). However, the amorphous silica (Orisil 380 and M300) as a matrix for nanocomposite was manufactured by Orisil Ltd., Ukraine.First stage of preparation route was focused on mixing the silicon dioxide with distilled water and sodium hydroxide. Next, water solution of silver acetate or copper acetate in ammonia, was added to the mixture providing to formation of colloidal suspension. In the last step, concentrated nitric acid was put into stirred colloid. The final product was filtered on polyethylene filter, washed and dried at room temperature to obtain nanopowder. Hereby, three types of nanocomposites were obtained – Cu combined with hydrophobic and hydrophilic type of SiO2, and Ag combined with hydrophobic SiO2. Synthesis of Ag/SiO2 with hydrophilic properties was unsuccessful, yet. The synthesis scheme is presented in Fig. 1.
Analytical methods
Physicochemical characterization
The crystallographic structure of Cu/SiO2 and Ag/SiO2 composites was studied by X-ray Powder Diffraction (XRD). The XRD data were recorded using Empyrean Panalytical equipment in the Bragg–Brentano geometry using Cu Kα radiation (λ = 1.54 Å). The step-scan covered the angular range 20–110° with the step of 0.02°. The phase analyzes for samples were made with use ICCD PDF-4 database.The particle shape, size and morphology were in details investigated using Scanning (SEM) and Transmission (TEM) Electron Microscopy, whereas the surface chemical distribution of individual elements and ratio of components were studied, with energy dispersive X-ray (EDX) and X-ray Photoelectron Spectroscopy (XPS). SEM images were obtained by a FE-SEM 7600F Jeol instrument equipped with an Energy Dispersive X-ray mode (EDX) to visualize the elemental distribution of Ag or Cu, Si, O, C in analyzed area. TEM micrographs were collected with the use JEOL JEM 3010 microscope working at 300 kV equipped with 2k × 2k Orius TM 833 SC200D Gatan CCD camera. The XPS measurements were taken with the use of Prevac & VGScienta spectrometer. Monochromatic Al Kα radiation was used for collecting broad energy range survey spectra as well as spectra of particular core levels including Ag 3d, Cu 2p, O 1s and C 1s. The determination of chemical composition and oxidation states in both Ag/SiO2 and Cu/SiO2 systems was included. The spectra were shifted with respect to carbon C 1s line at 284.6 eV and corrected for the background signal using the integrated Shirley algorithm. The bands were fitted by a composition of Gaussian and Lorentzian lines using MultiPak software.
The optical investigation using Infrared (FTIR) and Raman Spectroscopy (RS) were carried out to analyze the material structure as well as the type of molecular interaction between elements in composites. FTIR measurements were carried out using an Agilent Cary 640 FTIR spectrometer equipped with a standard source and a DTGS Peltier-cooled detector. The spectra have been collected using GladiATR diamond accessory in the 450–4000 cm−1 range. All spectra were accumulated with a spectral resolution of 4 cm−1 and recorded by accumulating of 16 scans.
RS investigations were realized using a WITec confocal CRM alpha 300 Raman microscope. The spectrometer was equipped with an air cooled solid state laser operating at 532 nm. A dry Olympus MPLAN 100 × /0.9 NA objective was used. The integration times of 20 s per spectrum at resolution of 3 cm−1 were applied. The monochromator of the spectrometer was calibrated using Raman scattering line produced by a silicon plate (520.7 cm−1). Finally, the infrared and Raman data were analyzed by baseline correction and using Voigt peak fittings procedure in Grams Software Package.
Antimicrobial properties of nanocomposites
The ‘spot test’ was performed as described in the references37 with minor modifications. Briefly, bacterial and yeast cells were cultivated 24 hours in LB and YPD, respectively, at 28 °C, 160 rpm. Cells suspension was diluted (1![[thin space (1/6-em)]](https://www.rsc.org/images/entities/char_2009.gif) :
:![[thin space (1/6-em)]](https://www.rsc.org/images/entities/char_2009.gif) 50 and 1
50 and 1![[thin space (1/6-em)]](https://www.rsc.org/images/entities/char_2009.gif) :
:![[thin space (1/6-em)]](https://www.rsc.org/images/entities/char_2009.gif) 40 for laboratory bacteria and yeast, respectively) in fresh growth medium and further cultivated (28 °C, 160 rpm) for 4–6 hours until mid-exponential growth phase at OD600 nm values 0.6 for bacteria and 0.8–1.0 for yeast. The cells were harvested by centrifugation at 4700 rpm for 10 min at 20 °C in 50 mL polypropylene falcon, the pellet was suspended in sterile demineralized (DI) water (Milli-Q, Millipore) and centrifuged again. Finally, the cells were re-suspended in DI water to a density of ∼107 CFU mL−1 for bacteria (OD600 nm 0.1) and yeast (OD600 nm 1.2) as described by Suppi et al.37 Filamentous fungi were maintained in test tubes containing Czapek-Dox medium. Cultures were incubated at 30 °C and humidity up to 90% for 2 weeks. 5 mL of sterile 0.2% SDS solution were poured into test tubes in order to reduce hydrophobicity of fungal spores. After vigorous mixing, the spores were separated from the hyphae by filtration of suspension through sterile cotton wool and centrifugation at 4000 rpm. Spores were then re-suspended in sterile DI. After triple washing with water and centrifugation the spore suspension concentration was adjusted to 106 spores per mL.
40 for laboratory bacteria and yeast, respectively) in fresh growth medium and further cultivated (28 °C, 160 rpm) for 4–6 hours until mid-exponential growth phase at OD600 nm values 0.6 for bacteria and 0.8–1.0 for yeast. The cells were harvested by centrifugation at 4700 rpm for 10 min at 20 °C in 50 mL polypropylene falcon, the pellet was suspended in sterile demineralized (DI) water (Milli-Q, Millipore) and centrifuged again. Finally, the cells were re-suspended in DI water to a density of ∼107 CFU mL−1 for bacteria (OD600 nm 0.1) and yeast (OD600 nm 1.2) as described by Suppi et al.37 Filamentous fungi were maintained in test tubes containing Czapek-Dox medium. Cultures were incubated at 30 °C and humidity up to 90% for 2 weeks. 5 mL of sterile 0.2% SDS solution were poured into test tubes in order to reduce hydrophobicity of fungal spores. After vigorous mixing, the spores were separated from the hyphae by filtration of suspension through sterile cotton wool and centrifugation at 4000 rpm. Spores were then re-suspended in sterile DI. After triple washing with water and centrifugation the spore suspension concentration was adjusted to 106 spores per mL.
Afterwards, 100 μL of cell suspension in DI water was added to 100 μl samples of nanomaterials Ag/SiO2h, Cu/SiO2h, Cu/SiO2f. As a reference, ion forms of Ag and Cu (AgNO3 and CuSO4, respectively) were used. All chemicals were tested in six nominal concentrations: 0.01, 0.1, 1.0, 10, 100 and 1000 mg L−1. The stock solutions (2000 mg L−1) of Ag/SiO2h, Cu/SiO2h, Cu/SiO2f, AgNO3 and CuSO4 were prepared freshly in sterile DI water and homogenized using ultrasonic probe (PolSonic 3) at 2 × 160 W for 1 h just before test. The stocks were diluted in DI water and tested concentrations were incorporated onto 96-well microplates (BD Falcon). Test organisms were exposed to chemicals in DI water at 24 °C for 24 h without shaking in the dark. Each experiment was repeated three times.
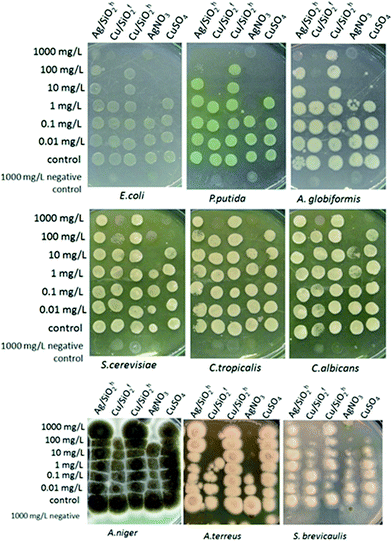
After 24 hour exposure, 5 μL of the cell suspension was pipetted as a ‘spot’ onto LB or YPD agar plates which were incubated for 24 h (bacteria) or 72 h (yeast) at 28 °C. Formation of a visible ‘spot’ (colonies) was used for determination of the ability of test organisms to grow on agar medium. Minimum biocidal concentration (MBC) of the NCs and ion forms of silver and cooper was determined as the lowest tested concentration which completely inhibited the formation of visible colonies after subculturing on toxicant-free agar media.
Inhibitory concentration IC50
Inhibitory concentration IC50 of nanomaterials was assessed for bacterial strains: Escherichia coli (DSM 1103), Pseudomonas putida G7 (DSM 4476), Arthrobacter globiformis (PCM 2134). For this purpose, slightly modified method described by Suppi et al.38 was used. Bacteria culture from mid-exponential growth phase, obtained as described for ‘spot test’, were diluted with fresh LB medium to OD600 nm 0.1. Subsequently, 50 μL of cell suspension was added onto 96-well microplates to 50 μL of six double concentrated solutions of tested compounds prepared in DI water as in ‘spot test’. Thereby, the nominal concentrations (0.01, 0.1, 1, 10, 100, 1000 mg L−1) of Ag/SiO2h, Cu/SiO2h, Cu/SiO2f, AgNO3 and CuSO4 was obtained in rows A–F. As a control, into the row G 50 μL of DI water without any compound was inoculated by 50 μL of cell suspension in LB. Microplates were incubated at 28 °C without shaking in the dark. Each concentration of the tested chemicals and control culture for each bacterial strain was studied in triplicate. Value of the nanomaterial concentration that makes 50% inhibition of the bacterial growth with relation to the control was calculated after 24 h incubation in half-strength LB medium. Such value was based on the curve of inhibition and expressed as means standard deviation (SD).Toxicity of nanocomposites – cell culture and cytotoxicity assay
Human fibroblast (NHDF) cells originated from the American Type Culture Collection were the subject of the toxicity test. Cells were grown as monolayer cultures in 75 cm2 flasks (Nunc) in Dulbecco's Modified Eagle Medium (DMEM). The medium was supplemented with 15% fetal bovine serum (Gibco) and 100 mg L−1 of gentamycin (Gibco). The cell lines were maintained at 37 °C in a 5% CO2 incubator and passaged every 3–4 days as required. Exponentially growing cells were harvested through the trypsinization of sub-confluent cultures. Cells were seeded into 96-well cell culture microtiter plates (Nunc) at concentrations of 4.0 × 10³ cells per well and cultured for 24 h. After this time, the growth medium was exchanged for a medium containing the growing concentrations of the tested compounds. Stock solutions of the compounds being investigated were prepared in sterile DMSO. The highest possible concentration of stock solutions of the tested compounds (in depending on solubility) were prepared in sterile DMSO. The final concentration of DMSO used in the culture medium did not exceed 0.2% and had no effect on cell growth. After 72 h of incubation, with the compounds being investigated, under standard cell culture conditions, the medium was replaced with 100 μL of DMEM without phenol red. The metabolic activity of viable cells was determined by adding 20 μL of CellTiter 96AQueousOne Solutions – MTS (Promega) to each well followed by 1 h incubation. The MTS assay is a colorimetric method for determining the number of viable cells. A standard solution containing 100 μL of DMEM without phenol red and 20 μL of MTS solution was used to determine ‘blank’ absorbance. The absorbance was measured at 490 nm using a SynergyTM4 microplate reader (BioTek).Inhibitory concentration (IC50) was also defined for human cells as the compound concentration that was necessary to reduce the proliferation of cells to 50% of the untreated control cells and expressed as means ± standard deviation (SD) in GraphPad Prism 5 software. Each individual compound was tested in triplicate.
Cell imaging
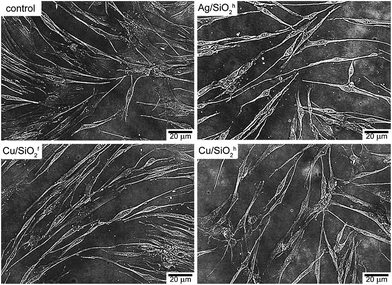
For cell morphology analysis, NHDF cells were seeded in 3 cm Petri dishes (Nunc) and incubated at 37 °C for 24 h. Then, the medium was removed and freshly prepared solutions of tested compounds: Ag/SiO2h (100 mg L−1); Cu/SiO2f (50 mg L−1); Cu/SiO2h (40 mg L−1) were added. After 72 h, the solution of tested compounds was removed and the cells were washed with Phosphate Buffered Saline (PBS) and maintained in DMEM without phenol red. The observation was performed under an inverted Zeiss epifluorescence microscope, Axio Observer Z1 (Carl Zeiss, Germany) in bright field.Results
Physicochemical characterization
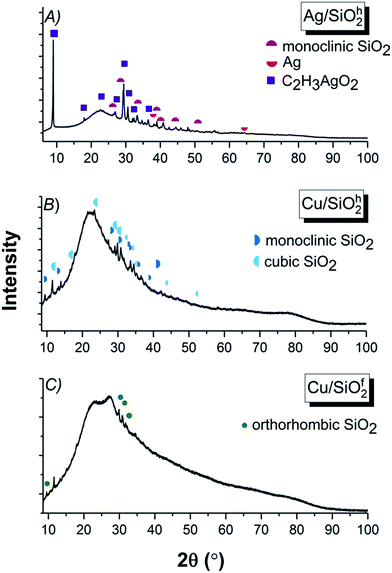
![[3 with combining macron]](https://www.rsc.org/images/entities/char_0033_0304.gif) m) phase of Ag (04-004-8730) with cell parameters a = 4.085 Å were identified. However, the dominant phase originated from the main component of the synthesis, constitutes the silver acetate (00-057-0335) with a = 6.112 Å, b = 5.594 Å, c = 19.763 Å cell parameters and orthorhombic (C2221) space group (Fig. 2A). Due to strong impact of the silicon dioxide the peaks linked to copper on the XRD spectra are difficult to separate with silica. Therefore, in the hydrophobic (SiO2h) sample, two silicon dioxide phases (Fig. 2B) were designated as: monoclinic (01-089-1667) (P/21m) with unit cell parameters of a = 9.680 Å, b = 19.580 Å, c = 7.400 Å and β = 81.10° and cubic (01-075-3901) (Pm
m) phase of Ag (04-004-8730) with cell parameters a = 4.085 Å were identified. However, the dominant phase originated from the main component of the synthesis, constitutes the silver acetate (00-057-0335) with a = 6.112 Å, b = 5.594 Å, c = 19.763 Å cell parameters and orthorhombic (C2221) space group (Fig. 2A). Due to strong impact of the silicon dioxide the peaks linked to copper on the XRD spectra are difficult to separate with silica. Therefore, in the hydrophobic (SiO2h) sample, two silicon dioxide phases (Fig. 2B) were designated as: monoclinic (01-089-1667) (P/21m) with unit cell parameters of a = 9.680 Å, b = 19.580 Å, c = 7.400 Å and β = 81.10° and cubic (01-075-3901) (Pm![[3 with combining macron]](https://www.rsc.org/images/entities/char_0033_0304.gif) n) with a = 10.730 Å. The hydrophilic (SiO2f) silicon dioxide system was characterized by the orthorhombic (01-079-0563) (Immm) space group with unit cell parameters of a = 18.557 Å, b = 13.889 Å and c = 7.249 Å (Fig. 2C).39
n) with a = 10.730 Å. The hydrophilic (SiO2f) silicon dioxide system was characterized by the orthorhombic (01-079-0563) (Immm) space group with unit cell parameters of a = 18.557 Å, b = 13.889 Å and c = 7.249 Å (Fig. 2C).39
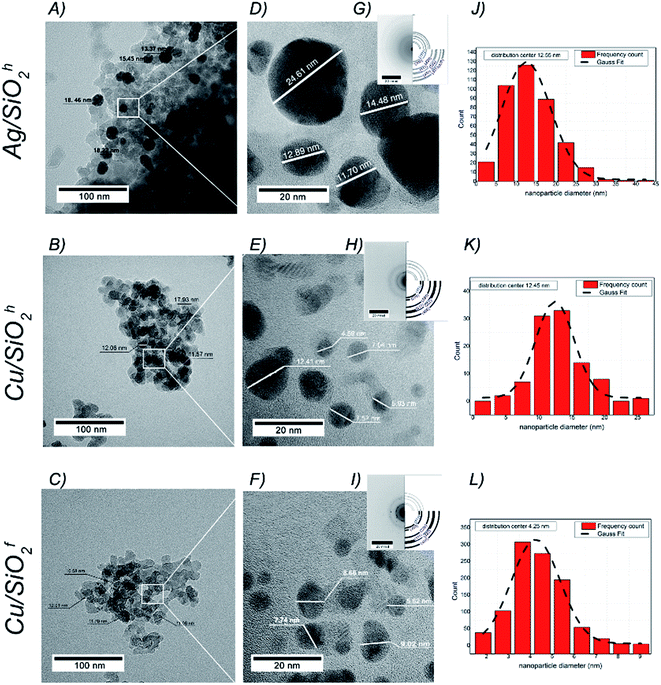
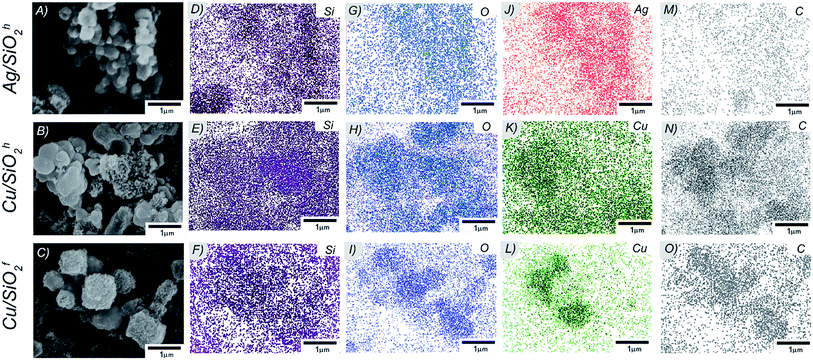
![[3 with combining macron]](https://www.rsc.org/images/entities/char_0033_0304.gif) m space group and cell parameters a = 3.615(1) Å (SEAD patterns in Fig. 3G–I). The diameter of copper particles in hydrophobic matrix determined with an accuracy to 12.45(5) nm. It turns that the smallest copper nanoparticles identified in hydrophilic copper system with the average size equal to 4.25(8) nm (Fig. 3J–L). The morphology of all samples was also investigated by SEM technique. Here, the NPs in silicon dioxide systems formed structures of varying degrees of agglomeration (Fig. 4A–C), with more less homogeneous distribution of Ag, Cu, Si and O in the whole volume of NC material (Fig. 4D–O). The atomic concentration from the EDX indicated the highest concentration of Cu in hydrophilic matrix. The analysis also showed the number of carbon atoms, which may result from residues of polymer or basic substance used during synthesis process (see Table 1).
m space group and cell parameters a = 3.615(1) Å (SEAD patterns in Fig. 3G–I). The diameter of copper particles in hydrophobic matrix determined with an accuracy to 12.45(5) nm. It turns that the smallest copper nanoparticles identified in hydrophilic copper system with the average size equal to 4.25(8) nm (Fig. 3J–L). The morphology of all samples was also investigated by SEM technique. Here, the NPs in silicon dioxide systems formed structures of varying degrees of agglomeration (Fig. 4A–C), with more less homogeneous distribution of Ag, Cu, Si and O in the whole volume of NC material (Fig. 4D–O). The atomic concentration from the EDX indicated the highest concentration of Cu in hydrophilic matrix. The analysis also showed the number of carbon atoms, which may result from residues of polymer or basic substance used during synthesis process (see Table 1).
| Atomic concentration [at%] | EDX | XPS | ||||
|---|---|---|---|---|---|---|
| Ag/SiO2h | Cu/SiO2h | Cu/SiO2f | Ag/SiO2h | Cu/SiO2h | Cu/SiO2f | |
| Ag | 3.41 | — | — | 0.14 | — | — |
| Cu | — | 2.48 | 11.77 | — | 0.56 | 1.04 |
| Si | 4.64 | 3.22 | 1.72 | 32.96 | 22.62 | 18.90 |
| O | 50.61 | 45.89 | 31.81 | 63.87 | 52.15 | 51.84 |
| C | 41.34 | 48.41 | 54.70 | 3.03 | 24.67 | 28.22 |
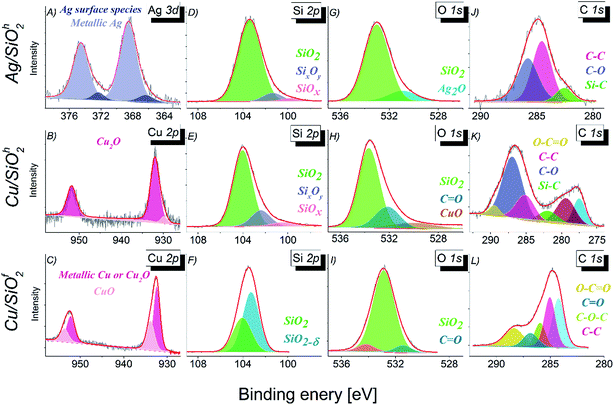 | ||
| Fig. 5 The XPS spectra with the result of a fitting (A) Ag 3d, (B–C) Cu 2p, (D–F) Si 2p, (G–I) O 1s and (J–L) C 1s. | ||
| System | Binding energy [eV] | ||||
|---|---|---|---|---|---|
| Ag 3d5/2 | Cu 2p1/2 | Si 2p | O 1s | C 1s | |
| Ag/SiO2h | 366.35 | — | 99.7 | 530.9 | 282.6 |
| 368.5 | 101.35 | 533.0 | 284.55 | ||
| 103.4 | 285.8 | ||||
| Cu/SiO2h | — | 929.9 | 100.4 | 530.0 | 277.5 |
| 279.4 | |||||
| 282.0 | |||||
| 932.0 | 102.4 | 532.2 | 285.15 | ||
| 286.9 | |||||
| 104.0 | 533.7 | 289.5 | |||
| Cu/SiO2f | — | 932.5 | 103.3 | 531.4 | 284.25 |
| 286.8 | |||||
| 532.9 | |||||
| 285.05 | |||||
| 933.9 | 104.1 | 534.2 | 285.9 | ||
| 288.4 | |||||
The analysis of Ag 3d5/2 core level (Fig. 5A) in case of Ag/SiO2h system indicates presence of silver in two different chemical states. The binding energy of 368.50 eV is related to pure metallic silver.40 However, the same binding energy might be assigned to silver ions in silver acetate. Second component with binding energy equal 366.35 eV can be attributed to surface Ag formed in the O/C–O environment.41 In case of chemical states of copper in Cu/SiO2 systems, two different chemical states were observed (Fig. 5B and C). High binding energy state located at 932.0 eV indicates the presence of Cu2O oxide in the Cu/SiO2h sample.42 In case of Cu/SiO2f the peak at the 932.5 eV can be assigned to pure metallic state of cooper or Cu2O because the binding energies of both chemical states are very close to each other.43 The dominant chemical state of copper in Cu/SiO2f sample, in contrast to the one observed in Cu/SiO2h, is CuO (Table 2). The presence of SiO2 compound, as mentioned above has been confirmed for Ag/SiO2 and Cu/SiO2 systems (Fig. 5D–F).40,44 The analysis of Si 2p line indicated presence of the non-stoichiometric SiOx oxides.44 The other phase of SiO2 has been detected in Cu/SiO2f where the atypical non-stoichiometric SiO2−δ oxide constitutes the dominant component, while the stoichiometric SiO2 has a smaller contribution to the Si 2p core line. The shape analysis of the O 1s core level (Fig. 5G–I) has confirmed the dominant character of SiO2 compound in all systems.
Additionally, the oxygen states indicate presence of Ag2O oxide (530.9 eV),40 CuO oxide (530.0 eV), as well as chemical states which can be related to bonding between carbon and oxygen. The one at lower binding energy is originating from the double C![[double bond, length as m-dash]](https://www.rsc.org/images/entities/char_e001.gif) O bonding (Cu/SiO2h), whereas the one of the higher binding energy in case of Cu/SiO2f to the polymer like bonding. Finally, the photoemission spectra of C 1s core level has revealed the typical organic components like C–O, C–C and C
O bonding (Cu/SiO2h), whereas the one of the higher binding energy in case of Cu/SiO2f to the polymer like bonding. Finally, the photoemission spectra of C 1s core level has revealed the typical organic components like C–O, C–C and C![[double bond, length as m-dash]](https://www.rsc.org/images/entities/char_e001.gif) O bonds.40,45–47 This can be a consequence of the presence of residues remaining in the samples after the synthesis process or environment adsorbents containing carbon (Fig. 5J–L).
O bonds.40,45–47 This can be a consequence of the presence of residues remaining in the samples after the synthesis process or environment adsorbents containing carbon (Fig. 5J–L).
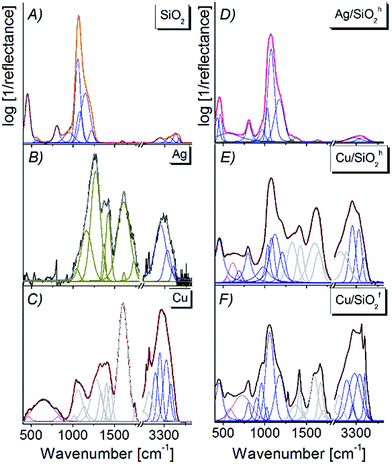 | ||
| Fig. 6 FTIR spectra of (A) pure silica, (B) Ag, (C) Cu, (D) Ag/SiO2h, (E) Cu/SiO2h, (F) Cu/SiO2f nanocomposites spectra fitted by Voigt function in the 450–4000 cm−1 range. | ||
Analyzing the Ag/SiO2h spectrum, one can find the slight red-shift about 10 cm−1 and broadening of main silica band, due to formation of the Si–O–Ag bond.48 At the same time, the splitting of Si–O–Si band centered originally at 445 cm−1 on two bands centered at 429 cm−1 and 465 cm−1 points to the deformation of silica network as well as formation of the outer polymeric cage within silica network (Fig. 6C).48,52 Further analysis showed weak intense bands observed on silver–silica infrared spectra located in the 1650–1750 cm−1 range. This band corresponds to the stretching vibration of C![[double bond, length as m-dash]](https://www.rsc.org/images/entities/char_e001.gif) O bond from the aldehyde group, while bands located in the 3200–3800 cm−1 range can be associated with stretching mode of ν(Si–OH), ν(OH) as well as molecular water adsorbed on the silica surface.1,49,53 Interestingly, an increase in the 3200–3800 cm−1 bands result from an increase amount of hydroxyl groups due to their localization over the AgNPs and effectively embedded silver nanoparticles inside the SiO2 frame. At the same time, a modification in band intensity results from an increase in the number of an intermolecular H-bonding interaction are associated with a hydrogen bond scheme realized by the combination of Si–O–Si framework and hydroxide from AgNPs modifier.
O bond from the aldehyde group, while bands located in the 3200–3800 cm−1 range can be associated with stretching mode of ν(Si–OH), ν(OH) as well as molecular water adsorbed on the silica surface.1,49,53 Interestingly, an increase in the 3200–3800 cm−1 bands result from an increase amount of hydroxyl groups due to their localization over the AgNPs and effectively embedded silver nanoparticles inside the SiO2 frame. At the same time, a modification in band intensity results from an increase in the number of an intermolecular H-bonding interaction are associated with a hydrogen bond scheme realized by the combination of Si–O–Si framework and hydroxide from AgNPs modifier.
The Cu/SiO2 spectrum is dominated by polymer-like bands (1300–3800 cm−1), partially overlapping with silica and organic carbon (400–1300 cm−1) ones. The deconvolution procedure and peak fitting analysis revealed presence of Cu–O (600–700 cm−1), Si–O–Si (450–1500 cm−1) and Si–OH (950 cm−1, 3000 cm−1) vibrations. The bands located at 600–1250 cm−1 might be assigned to the deformation of δ(Cu–O–Si) bonds located at the interface between CuO and SiO2.1 In addition, sharper bands observed in the hydroxyl region of Cu/SiO2f suggest higher contribution of hydroxide than for hydrophobic composite (Fig. 6E and F). High band intensities in this range also determine the formation of hydrogen bonding of copper nanoparticles with silica matrix.
| SiO2 | Ag/SiO2h | Cu/SiO2h | Cu/SiO2f | ||||
|---|---|---|---|---|---|---|---|
| Wavenumber [cm−1] | Band assignment | Wavenumber [cm−1] | Band assignment | Wavenumber [cm−1] | Band assignment | Wavenumber [cm−1] | Band assignment |
| 235 | Si–O | 231 | Ag–O5 | 236 | Si–O | 235 | Si–O |
| 264 | (Ag–O)–Si | 262 | (Cu–O)–Si70,73 | 262 | (Cu–O)–Si70,73 | ||
| 308, 391 | Si–O(–Cu) | 339, 395 | Si–O(–Ag) | 316, 398 | Si–O(–Cu) | 337, 386 | Si–O(–Cu) |
| 478 | Si–O–Si bending (ω1),55–58,60–62 Si–O(–Cu) | 446 | Si–O–Si bending (ω1)57,58,60 | 476 | Si–O–Si bending (ω1),55–58,60,61 Si–O(–Cu) | 466 | Si–O–Si bending (ω1)55–58,60–62 Si–O(–Cu) |
| 554 | Si–O–Si bending (D1 defect),55,56,58,68 | 493 | Si–O–Si bending (D1 defect)60,61 | 552 | Si–O–Si bending (D1 defect) | 512 | Si–O–Si bending (D1 defect)55,68 |
| 563 | (Cu2–O)–Si modes71 | ||||||
| 606 | Si–O–Si bending (D2 defect)56,58,68 | 603 | Si–O–Si bending (D2 defect)55,56 | 598 | Si–O–Si bending (D2 defect), Si–O(–Cu) | ||
| 626 | (Cu–O)–Si32,33 | ||||||
| 673 | (Cu2–O)–Si modes71 | ||||||
| 696 | Overtone (2B1g type of symmetry) | 714 | Overtone (2B1g type of symmetry) | 701, 781 | Overtone (2B1g type of symmetry) | 725 | Overtone (2B1g type of symmetry) |
| 804 | Si–O–Si symmetric stretching mode (ω3) | 798 | Si–O–Si symmetric stretching mode (ω3)55,56 | 806 | Si–O–Si symmetric stretching mode (ω3)55,56,60,62 | 796 | Si–O–Si symmetric stretching mode (ω3)55,56,58,60,68 |
| 972 | SiO4 (ref. 62) | 879, 974 | Si–O62 Si–OH54,64 | 982 | Si–O62 Si–OH54,64 | 854 | SiO4 (ref. 62) |
| 1055, 1165 | Si–O62 | 1058 | Si–O–Si antisymmetric stretching mode (ω4)55 | 1093 | Si–O–Si antysymmetric stretching mode (ω4), Si–O | 1031 | Si–O62 |
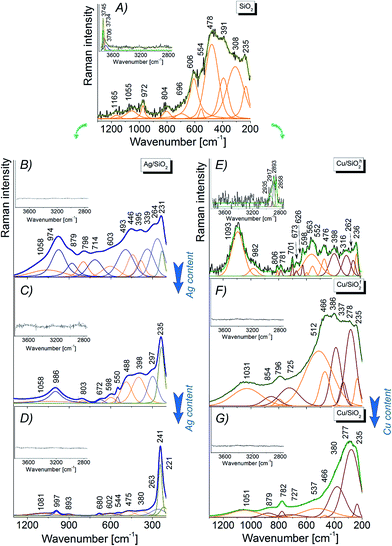
Physicochemical properties of nanocomposites are strongly influenced by the concentration of metal embedded into the matrix. Thus, adding network modifiers, such as silver, copper or carbon, substantially changes the initial silica structure generating additional bands as well as changing intensity of other ones.54 Looking more closely on the Ag/SiO2h spectrum (Fig. 7B) one can observe few low wavenumber bands ascribed to Si–(O–Ag) modes.65,66 The differences at ω1, D2 band positions are probably due to deformation of silica network, while the red-shift of D1 band for about 20 cm−1 with respect to pure silica, arise from elongation of Si–O bond within three-fold ring silica structure. Above the 700 cm−1 range, the Raman bands are generally assigned to –Si–O* structural elements which are characteristic for crystalline silica phase.54,64,67 Interestingly, an increase of Ag content gradually amplifies the band intensity at 235 cm−1, which originates from Si–(O–Ag) mode (Fig. 7B and C) and the blue or red-shift band. This is an effect of silver interaction with silicon oxide network e.g. red-shift bands assigned to –Si–O* structural elements suggest elongation of Si–O bond.54,64,67 Finally, no bands associated with hydroxyl groups have been detected (Fig. 7B–D). On the other hand, Raman spectra of Cu/SiO2 systems strongly depend on the type of silica type (Fig. 7E and F). For hydrophobic Cu/SiO2h system a small shift (few cm−1) with respect to pure silica is an effect of relatively small interaction of copper on amorphous silica network,54,68 while the existence of additional lines indicates a copper–oxide bond (see Table 3). Moreover, two bands located at 262, 626 cm−1 can be assigned to (Cu–O)–Si mode.69,70 Further, bands at 563, 673 cm−1 can be assigned to (Cu2–O)–Si vibration,71 while bands at 701, 781 cm−1 suggest structural deformation of silica network. Interestingly, high intensity of line at 1093 cm−1 suggest statistically high amount of –Si–O* structural groups coming from crystalline silica. In addition, weak band found between 3200–2800 cm−1 indicates presence of organic moieties (C–H) confirmed by the SEM and XPS data. In case of hydrophilic Cu/SiO2f system, amorphous silica-bands are shifted ± 10 cm−1 due to strong copper interaction with SiO2 activating the (Si–O)–Cu vibration.72 Similar to hydrophobic system, two bands at 1031, 854 cm−1 are an evidence of the –Si–O* structural elements originating from the crystalline silica.54,64 The intensities of all bands are closely related to those from pure silica suggesting only a weak interaction of copper with silica network. The increase of copper content in both samples lead to overlapping of bands arising from copper oxide and silica vibration. In that way, Raman spectrum of highly content copper–silica spectrum is dominated by bands at 277, 380, 466, cm−1 assigned to the Cu–O vibration73 and other ones with lower intensity to the (Si–O)–Cu modes.
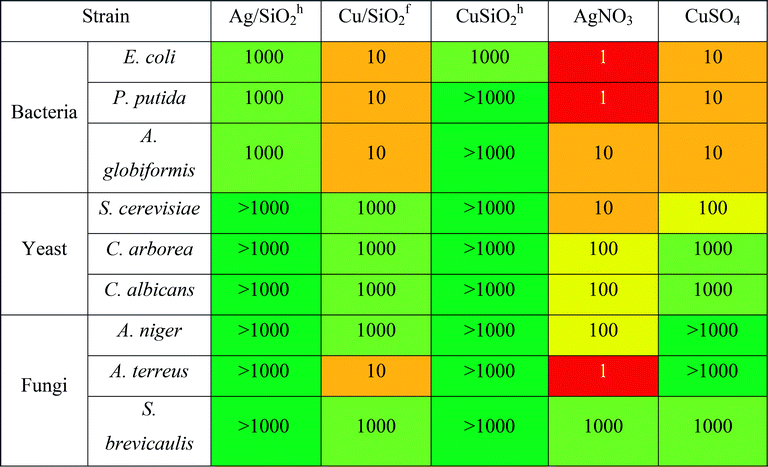
The highest antibacterial effect was observed for hydrophilic Cu/SiO2f, for which minimum biocidal concentration (MBC) was determined at the level of 10 mg L−1 after 24 h (Table 4). The same level of antibacterial properties showed Cu-ions (CuSO4), although it should be considered that content of Cu in synthesized nanocomposites was 2.48% and 11.77% for hydrophobic and hydrophilic systems (based on the SEM + EDX analysis), respectively.
Antifungal properties of copper are used especially in agricultural management where copper consists is an active substance of inorganic fungicides.74 Moreover, antifungal activity of Cu NPs may be higher than for commonly used fungicide in bulk.75 Hence, to shed more light on the toxic effect of the silica-based nanocomposite, more detailed studies against fungal strains of all systems were carried out. The outcomes showed the Cu/SiO2f composite demonstrated higher toxic effect than Cu-ions. For A. terreus the toxic effect calculated for Cu/SiO2f was more than 100 times higher in comparison with Cu-ions. In contrast, the weakest biocidal effect was observed for Cu/SiO2h nanosystem. This effect might be connected to certain nanoparticles properties such as size or degree of metal agglomeration.76 In our study the particle size of hydrophobic Cu/SiO2 was about 3 times bigger compared to the hydrophilic Cu/SiO2 nanocomposite. Moreover, Cu concentration in hydrophobic silica matrix was almost 5 times smaller than hydrophilic one.
Further, the Ag/SiO2 nanocomposite was determined. However, no toxic effect on the yeast or fungi strains was found. The comparison of MBC values of the Ag and Cu combined with hydrophobic SiO2 showed higher antibacterial effect of nanomaterials contained silver. Similar results have been published by Suppi et al.,37 where smaller biocidal effect of Cu NPs in comparison with AgNPs was found.
Inhibitory concentration IC50 test performed on selective bacterial strains revealed lower antibacterial potency compared to the results obtained by ‘spot test’ (see Table 5). It may indicate that observed toxic effect results not from the disruption of the active growth of bacterial strains, but has general nature. It has been considered, that Cu- or Ag-based NPs are highly reactive due to their large specific surface area to the bulk one, which may be responsible for inducing generation of the reactive oxygen species. It may affect microorganisms by disruption of cell wall, lipid peroxidation or damage of DNA/RNA.77
a Range of IC50:  |
|---|
 |
Similarly, to the results obtained by ‘spot test’ for all tested nanocomposites, the CuSiO2f exerted the highest toxic effect against bacteria and the effect was higher in comparison with Cu-ions. Moreover, all NCs exert toxic effect on gram-negative bacteria E. coli. Toxicity of NPs against bacterial strain was examined also in other studies.78,79 It was shown, that silver ions may be released from the surface of Ag/SiO2 coating films and exerted totally inhibited growth effect on E. coli in comparison with S. aureus (90% bactericides), due to trapping silver ion by peptidoglycan in the gram-positive cell wall.78 This effect is similar to our results, where gram-positive strain of A. globiformis showed a lower sensitivity to tested compound compared to E. coli. Additionally, capping of nanoparticles by exopolysaccharides produced by bacteria may be responsible for tolerance of bacteria for AgNPs.79 This may explain small inhibitory effect of nanomaterials against strain of P. putida G7, which is known as producer of exopolymers.80
| a Solubility depending. |
|---|
 |
Conclusions
This paper has summarized a complete process of production and characterization of metallic (silver, copper) silica-based powder nanocomposites with the use of hydrophilic and hydrophobic silica matrices. Diffraction data revealed presence of amorphous and crystalline silica phases while chemical analysis, heterogeneously distribution of metallic ions and carbon within silica matrix as well as their potential agglomeration in submicron clusters. Microscopy images revealed round-shape morphology of metallic ions as well as evidenced an average size of silver and copper embedded into hydrophobic matrix close to 12 nm, while in case of hydrophilic ones close to 4 nm. Surface sensitive methods indicated the presence of silver and copper oxides, surface adsorbed carbon and stoichiometry and non-stoichiometric silica phases. Infrared and Raman spectroscopy showed presence of major silica-active bands as well as metallic-oxide bonds. Biological test revealed antibacterial and antifungal properties of synthesized nanocomposites, in some cases even better than those reported for silver- or copper-based, commonly used chemical compounds. Significantly, the highest biocidal properties were determined for nanocomposite with smallest particle size and proved the lack of cytotoxic effect of all nanocomposites for the human cells.Acknowledgements
A. M. W. is thankful for the financial support from the National Center of Science based on decision 2014/13/D/NZ7/00322.References
- J. Jiang, S.-H. Kim and L. Piao, Nanoscale, 2015, 7, 8299–8303 RSC
.
- G. Ghodake, S.-R. Lim and D. S. Lee, Colloids Surf., B, 2013, 108, 147–151 CrossRef CAS PubMed
.
- H. H. Lara, N. V. Ayala-Nuñez, L. Ixtepan-Turrent and C. Rodriguez-Padilla, J. Nanobiotechnol., 2010, 8, 1 CrossRef PubMed
.
- F. Li, C. Lei, Q. Shen, L. Li, M. Wang, M. Guo, Y. Huang, Z. Nie and S. Yao, Nanoscale, 2012, 5, 653–662 RSC
.
- W. K. Jung, H. C. Koo, K. W. Kim, S. Shin, S. H. Kim and Y. H. Park, Appl. Environ. Microbiol., 2008, 74, 2171–2178 CrossRef CAS PubMed
.
- Nanostructured Materials and Coatings for Biomedical and Sensor Applications, ed. I. V. Uvarova and Y. G. Gogotsi, Springer, Netherlands, 2003, vol. 102 Search PubMed
.
- J. R. Morones, J. L. Elechiguerra, A. Camacho, K. Holt, J. B. Kouri, J. T. Ramírez and M. J. Yacaman, Nanotechnology, 2005, 16, 2346 CrossRef CAS PubMed
.
- D. Carmona, P. Lalueza, F. Balas, M. Arruebo and J. Santamaría, Microporous Mesoporous Mater., 2012, 161, 84–90 CrossRef CAS
.
- D. M. Eby, H. R. Luckarift and G. R. Johnson, ACS Appl. Mater. Interfaces, 2009, 1, 1553–1560 CAS
.
- D. Lee, M. F. Rubner and R. E. Cohen, Chem. Mater., 2005, 17, 1099–1105 CrossRef CAS
.
- Z. Xiu, Q. Zhang, H. L. Puppala, V. L. Colvin and P. J. J. Alvarez, Nano Lett., 2012, 12, 4271–4275 CrossRef CAS PubMed
.
- A. Mollahosseini, A. Rahimpour, M. Jahamshahi, M. Peyravi and M. Khavarpour, Desalination, 2012, 306, 41–50 CrossRef CAS
.
- K.-Y. Yoon, J. Hoon Byeon, J.-H. Park and J. Hwang, Sci. Total Environ., 2007, 373, 572–575 CrossRef CAS PubMed
.
- S. Suppi, K. Kasemets, A. Ivask, K. Künnis-Beres, M. Sihtmäe, I. Kurvet, V. Aruoja and A. Kahru, J. Hazard. Mater., 2015, 286, 75–84 CrossRef CAS PubMed
.
- R. L. Williams, P. J. Doherty, D. G. Vince, G. J. Grashoff and D. F. Williams, Crit. Rev. Biocompat., 1989, 5, 221–243 CAS
.
- A. Oloffs, C. Grosse-Siestrup, S. Bisson, M. Rinck, R. Rudolph and U. Gross, Biomaterials, 1994, 15, 753–758 CrossRef CAS PubMed
.
- P. van Broekhuizen, F. van Broekhuizen, R. Cornelissen and L. Reijnders, J. Nanopart. Res., 2011, 13, 447–462 CrossRef
.
- J. Lee, S. Mahendra and P. J. J. Alvarez, ACS Nano, 2010, 4, 3580–3590 CrossRef CAS PubMed
.
- N. von Goetz, C. Lorenz, L. Windler, B. Nowack, M. Heuberger and K. Hungerbühler, Environ. Sci. Technol., 2013, 47, 9979–9987 CrossRef CAS PubMed
.
- S. K. Das, M. M. R. Khan, T. Parandhaman, F. Laffir, A. K. Guha, G. Sekaran and A. B. Mandal, Nanoscale, 2013, 5, 5549–5560 RSC
.
- O. V. Abramov, A. Gedanken, Y. Koltypin, N. Perkas, I. Perelshtein, E. Joyce and T. J. Mason, Surf. Coat. Technol., 2009, 204, 718–722 CrossRef CAS
.
- A. Guerrero-Martínez, J. Pérez-Juste and L. M. Liz-Marzán, Adv. Mater., 2010, 22, 1182–1195 CrossRef PubMed
.
- J.-P. Kaiser, S. Zuin and P. Wick, Sci. Total Environ., 2013, 442, 282–289 CrossRef CAS PubMed
.
- A. Mandal, S. Sekar, K. M. S. Meera, A. Mukherjee, T. P. Sastry and A. B. Mandal, Phys. Chem. Chem. Phys., 2014, 16, 20175–20183 RSC
.
- A. Mandal, S. Sekar, N. Chandrasekaran, A. Mukherjee and T. P. Sastry, J. Mater. Chem. B, 2015, 3, 3032–3043 RSC
.
- A. Mandal, S. Sekar, N. Chandrasekaran, A. Mukherjee and T. P. Sastry, RSC Adv., 2015, 5, 15763–15771 RSC
.
- A. Mandal, V. Meda, W. J. Zhang, K. M. Farhan and A. Gnanamani, Colloids Surf., B, 2012, 90, 191–196 CrossRef CAS PubMed
.
- A. Mandal, S. Sekar, N. Chandrasekaran, A. Mukherjee and T. Sastry, Proc. Inst. Mech. Eng., Part H, 2013, 227, 1224–1236 CrossRef CAS PubMed
.
- Y. Dong, T. Liu, S. Sun, X. Chang and N. Guo, Ceram. Int., 2014, 40, 5605–5609 CrossRef CAS
.
- G. R. Raghav, A. N. Balaji, K. Murugan and B. HarishKumar, International Research Journal of Engineering Science, Technology and Innovation, 2014, 3, 1368–1373 Search PubMed
.
- M. K. Gangishetty, R. W. J. Scott and T. L. Kelly, Dalton Trans., 2016, 45, 9827–9834 RSC
.
- A. Nowak, J. Szade, E. Talik, A. Ratuszna, M. Ostafin and J. Peszke, Mater. Chem. Phys., 2014, 145, 465–470 CrossRef CAS
.
- A. Nowak, J. Szade, E. Talik, M. Zubko, D. Wasilkowski, M. Dulski, K. Balin, A. Mrozik and J. Peszke, Mater. Charact., 2016, 117, 9–16 CrossRef CAS
.
- J. Peszke, A. Nowak, J. Szade, A. Szurko, D. Zygadło, M. Michałowska, P. Krzyściak, P. Zygoń, A. Ratuszna and M. M. Ostafin, J. Nanopart. Res., 2016, 18, 355 CrossRef
.
- K. Dudek, J. Podwórny, M. Dulski, A. Nowak and J. Peszke, Powder Diffr., 2017, 1–5 CrossRef
.
- Z. Li, L. Jia, Y. Li, T. He and X.-M. Li, Appl. Surf. Sci., 2015, 345, 122–126 CrossRef CAS
.
- S. Suppi, K. Kasemets, A. Ivask, K. Künnis-Beres, M. Sihtmäe, I. Kurvet, V. Aruoja and A. Kahru, J. Hazard. Mater., 2014, 286C, 75–84 Search PubMed
.
- S. Suppi, K. Kasemets, A. Ivask, K. Künnis, I. Kurvet, V. Aruoja and A. Kahru, J. Hazard. Mater., 2014, 1–9 Search PubMed
.
- E. M. Flanigen, J. M. Bennett, R. W. Grose, J. P. Cohen, R. L. Patton, R. M. Kirchner and J. V. Smith, Nature, 1978, 271, 512–516 CrossRef CAS
.
- 2012, NIST X-ray Photoelectron Spectroscopy Database, Version 4.1 (National Institute of Standards and Technology, Gaithersburg, 2012); http://srdata.nist.gov/xps/.
- L. Armelao, D. Barreca, G. Bottaro, A. Gasparotto, C. Maragno and E. Tondello, Surf. Sci. Spectra, 2003, 10, 170–181 CrossRef CAS
.
- J.-Y. Park, K.-A. Lim, R. D. Ramsier and Y.-C. Kang, Bull. Korean Chem. Soc., 2011, 32, 3395–3399 CrossRef CAS
.
- J. F. Moulder, W. F. Stickle, P. E. Sobol and K. D. Bomben, Handbook of X Ray Photoelectron Spectroscopy: A Reference Book of Standard Spectra for Identification and Interpretation of Xps Data, Physical Electronics, Eden Prairie, Minn, 1995 Search PubMed
.
- F. J. Himpsel, F. R. McFeely, A. Taleb-Ibrahimi, J. A. Yarmoff and G. Hollinger, Phys. Rev. B: Condens. Matter Mater. Phys., 1988, 38, 6084–6096 CrossRef CAS
.
- E. Cano, C. L. Torres and J. M. Bastidas, Mater. Corros., 2001, 52, 667–676 CrossRef CAS
.
- O. Akhavan, M. Abdolahad, A. Esfandiar and M. Mohatashamifar, J. Phys. Chem. C, 2010, 114, 12955–12959 CAS
.
- M. S. A. S. Shah, K. Zhang, A. R. Park, K. S. Kim, N.-G. Park, J. H. Park and P. J. Yoo, Nanoscale, 2013, 5, 5093–5101 RSC
.
- S. Ramalingam, L. B. Devi, J. R. Rao and B. U. Nair, RSC Adv., 2014, 4, 56041–56051 RSC
.
- H. Naeimi and V. Nejadshafiee, New J. Chem., 2014, 38, 5429–5435 RSC
.
- F. Zhao, X. Wang, B. Ding, J. Lin, J. Hu, Y. Si, J. Yu and G. Sun, RSC Adv., 2011, 1, 1482–1488 RSC
.
- D. Das, P. Choudhury, L. Bortahkur, B. Gogoi, A. K. Buragohain and S. K. Dolui, RSC Adv., 2014, 5, 2360–2367 RSC
.
- O. Shameema, C. N. Ramachandran and N. Sathyamurthy, J. Phys. Chem. A, 2006, 110, 2–4 CrossRef CAS PubMed
.
- H. Moghanian, A. Mobinikhaledi, A. G. Blackman and E. Sarough-Farahani, RSC Adv., 2014, 4, 28176 RSC
.
- A. Alessi, S. Agnello, G. Buscarino and F. M. Gelardi, J. Raman Spectrosc., 2013, 44, 810–816 CrossRef CAS
.
- T. Deschamps, H. Vezin, C. Gonnet and N. Ollier, Opt. Express, 2013, 21, 8382 CrossRef CAS PubMed
.
- T. Sato, N. Funamori and T. Yagi, Nat. Commun., 2011, 2, 345 CrossRef PubMed
.
- L. Robinet, C. Coupry, K. Eremin and C. Hall, J. Raman Spectrosc., 2006, 37, 789–797 CrossRef CAS
.
- D. W. Matson, S. K. Sharma and J. A. Philpotts, J. Non-Cryst. Solids, 1983, 58, 323–352 CrossRef CAS
.
- V. K. Sharma, R. A. Yngard and Y. Lin, Adv. Colloid Interface Sci., 2009, 145, 83–96 CrossRef CAS PubMed
.
- P. McMillan, Am. Mineral., 1984, 69, 645–659 CAS
.
- N. Kitamura, K. Fukumi, H. Mizoguchi, M. Makihara, A. Higuchi, N. Ohno and T. Fukunaga, J. Non-Cryst. Solids, 2000, 274, 244–248 CrossRef CAS
.
- G. S. Henderson, G. M. Bancroft and M. E. Fleet, Am. Mineral., 1985, 70(9), 946–960 CAS
.
- G. Vaccaro, S. Agnello, G. Buscarino and F. M. Gelardi, J. Phys. Chem. C, 2010, 114, 13991–13997 CAS
.
- F. L. Galeener and A. E. Geissberger, Phys. Rev. B: Condens. Matter Mater. Phys., 1983, 27, 6199–6204 CrossRef CAS
.
- I. Martina, R. Wiesinge, D. Jembrih-Simbürger and M. Schreiner, e-Preserv. Sci., 2012, 9, 1–8 CAS
.
- Infrared and Raman Characteristic Group Frequencies: Tables and Charts, ed. G. Socrates, Wiley-VCH Verlag GmbH & Co. KGaA, 3rd edn, 2004 Search PubMed
.
- A. E. Geissberger and F. L. Galeener, Phys. Rev. B: Condens. Matter Mater. Phys., 1983, 28, 3266–3271 CrossRef CAS
.
- T. Seuthe, M. Grehn, A. Mermillod-Blondin, H. J. Eichler, J. Bonse and M. Eberstein, Opt. Mater. Express, 2013, 3, 755 CrossRef CAS
.
- J. F. Xu, W. Ji, Z. X. Shen, W. S. Li, S. H. Tang, X. R. Ye, D. Z. Jia and X. Q. Xin, J. Raman Spectrosc., 1999, 30, 413–415 CrossRef CAS
.
- H. F. Goldstein, D. Kim, P. Y. Yu, L. C. Bourne, J.-P. Chaminade and L. Nganga, Phys. Rev. B: Condens. Matter Mater. Phys., 1990, 41, 7192–7194 CrossRef CAS
.
- H. Y. H. Chan, C. G. Takoudis and M. J. Weaver, J. Phys. Chem. B, 1998, 103, 357–365 CrossRef
.
- T. Yu, X. Zhao, Z. X. Shen, Y. H. Wu and W. H. Su, J. Cryst. Growth, 2004, 268, 590–595 CrossRef CAS
.
- A. Bhaumik, A. M. Shearin, R. Patel and K. Ghosh, Phys. Chem. Chem. Phys., 2014, 16, 11054–11066 RSC
.
- A. M. Wightwick, S. a. Salzman, S. M. Reichman, G. Allinson and N. W. Menzies, Environ. Sci. Pollut. Res., 2013, 20, 1574–1585 CrossRef CAS PubMed
.
- P. Kanhed, S. Birla, S. Gaikwad, A. Gade, A. B. Seabra, O. Rubilar, N. Duran and M. Rai, Mater. Lett., 2014, 115, 13–17 CrossRef CAS
.
- T. Silva, L. R. Pokhrel, B. Dubey, T. M. Tolaymat, K. J. Maier and X. Liu, Sci. Total Environ., 2014, 468–469, 968–976 CrossRef CAS PubMed
.
- C. Civardi, M. Schubert, A. Fey, P. Wick and F. W. M. R. Schwarze, PLoS One, 2015, 10, e0142578 Search PubMed
.
- N. Baheiraei, F. Moztarzadeh and M. Hedayati, Ceram. Int., 2012, 38, 2921–2925 CrossRef CAS
.
- S. Khan, A. Mukherjee and N. Chandrasekaran, J. Environ. Sci., 2011, 23, 346–352 CrossRef CAS
.
- S. C. Kachlany, S. B. Levery, J. S. Kim, B. L. Reuhs, L. W. Lion and W. C. Ghiorse, Environ. Microbiol., 2001, 3, 774–784 CrossRef CAS PubMed
.
| This journal is © The Royal Society of Chemistry 2017 |

