 Open Access Article
Functionalized graphene oxide for anti-VEGF siRNA delivery: preparation, characterization and evaluation in vitro and in vivo†
Lulu Ren,
Yifan Zhang,
Chunying Cui *,
Yanzhao Bi and
Xu Ge
School of Pharmaceutical Sciences, Capital Medical University, Beijing, 100069, China. E-mail: ccy@ccmu.edu.cn; Fax: +86-10-8391-1668; Tel: +86-10-8391-1668
First published on 10th April 2017
Abstract
RNA interference (RNAi) treatment is a promising and effective method for gene therapy in cancer treatments. Small interference RNA (siRNA) plays an indispensable role in the process of RNAi, resulting in gene silencing. However, naked siRNA has difficulty in crossing the cell membrane and can easily be deactivated by enzymolysis. An ideal carrier is required for siRNA delivery to overcome these disadvantages. In this study, GO–PLL–SDGR (poly-L-lysine and Arg-Gly-Asp-Ser functionalized graphene oxide), a graphene oxide (GO)-based carrier that can actively target tumors, was prepared and characterized. Results of an agarose gel retardation assay indicated that 10 μg of GO–PLL–SDGR could load 1 μg of VEGF-siRNA. It was found that the release of VEGF-siRNA from GO–PLL–SDGR/VEGF-siRNA was slow and sustained. The efficiency of gene silencing and the tumor growth inhibitory activity of GO–PLL–SDGR/VEGF-siRNA were investigated both in vitro and in vivo by RT-qPCR, ELISA and an S180 tumor-bearing mice model. RT-qPCR and ELISA assays revealed that the expressions of VEGF-mRNA and VEGF protein were down-regulated by 40.86% and 51.71%, respectively, in vitro. In vivo, the Cy-3 labeled VEGF-siRNA was observed to assemble in tumor tissues, and the tumor inhibitory rate of GO–PLL–SDGR/VEGF-siRNA was 51.74%. What's more, GO–PLL–SDGR exhibited low cytotoxicity in the MTT assay. As all the evidence shows above, GO–PLL–SDGR could be used in siRNA delivery systems as a non-viral tumor targeting carrier.
1. Introduction
Gene therapy has been an attractive approach for cancer treatment.1–4 In particular, RNAi (RNA interference)-based gene therapy, belonging to a post-transcriptional gene silencing process, is a gene-targeting technology with great potential.5,6 The inhibition of gene expression can be triggered by double-stranded RNA (dsRNA), which is cleaved into small interfering RNAs (siRNAs). The siRNA can induce the formation of RISC (an RNA-induced silencing complex), which leads to certain mRNA degradation.7,8 Therefore, an appropriately designed siRNA can effectively knock down the expression of proteins involved in tumor initiation and progression.9 Vascular endothelial growth factor (VEGF) can be over-expressed in several types of tumors, and it is involved in tumor formation, invasion and metastasis as well as tumor angiogenesis.10,11 Therefore, VEGF-siRNA can be specially designed for down-regulating the expression of VEGF and inhibiting tumor growth. However, naked siRNA can be difficult to pass through cell membranes due to its large molecular weight and negative charge.12 In addition, naked siRNA is easily degraded by nuclease without protection.13 Therefore, the clinical application of siRNA depends on carriers, which can protect and carry the siRNA, increase the cellular uptake and tumor targeting effect of carrier/siRNA complex.Graphene is a single-layer nanosheet with unusual physical and chemical properties including immortal toughness and high conductivity.14 It has attracted the attention of scientists and researchers in recent years.15–17 Graphene oxide (GO), the oxidative product of graphite, contains hydroxyl and epoxide functional groups on the surface center of the sheets, and contains carbonyl and carboxyl groups at the edges.18,19 As the result of existence of these reactive groups, graphene oxide has a good biocompatibility, which contributes to its biological and medical applications.20 The oxygenic groups on graphene oxide provide reaction sites for functional modification,21 and functionalized graphene oxides have been investigated extensively as nanocarriers for drugs.22–27 For instance, Liu and his research team synthesized branched polyethylene glycol (PEG) functionalized nanographene oxide (NGO), it was used as a drug delivery vector to increase the water solubility of antineoplastic.22 Wen and his research team conjugated PEG molecules to graphene oxide through disulfide bond to obtain the redox-responsive drug delivery system NGO–SS–mPEG.23 Xu and Fan conjugated paclitaxel (PTX) to PEGylated graphene oxide through covalent bonds to prolong the blood circulation time of PTX.26 There are evidences that the application of functionalized graphene oxides has extended to the field of gene transfection.28–35 Feng and his research team synthesized PEI-PEG dual-functionalized graphene oxide to deliver pDNA or siRNA into cells and enhance gene delivery.28,29 Moreover, it was proven that branched low-molecular weight polyethylenimine modified graphene oxide can increase DNA transfection efficiency.30 Cell penetrating peptides (CPPs), such as octaarginine (R8), were also employed to modify graphene oxides in order to enhance the gene delivery.35 However, most of these results were obtained in vitro, the gene delivering capacity and the gene silencing efficacy of the delivery system in vivo were undiscovered. In addition, these GO-based gene carriers without targeting ligands modification may have poor tissue specificity and high toxicity.
Poly-L-lysine (PLL) is a water soluble cationic polymer with good biocompatibility, and it has been applied in the modification of many nanoparticles for tumor imaging or therapy.36–38 Wu and his research team synthesized PLL-functionalized graphene oxide as a carrier for photo-sensitizer and doxorubicin, and the nanocomplex showed high solubility and stability in biological solutions.39 In this study, PLL was used to modify GO in order to improve the water solubility and the loading capacity of GO.
Tumor-targeting ability of gene carrier plays a key role in improving the safety and efficiency of gene therapies.40–42 Our previous work demonstrated that the tetrapeptide RGDS (Arg-Gly-Asp-Ser) or RGDV (Arg-Gly-Asp-Val), conjugating with the carbon nanomaterial, can target tumor and deliver VEGF-siRNA into tumor cells efficiently.43 That is mainly because RGD peptides can actively target to the tumor via the interaction of RGD with the integrin αvβ3 overexpressed on cytomembrane of cancer cells.44 Therefore, RGDS could be used to enhance the tumor targeting efficiency of gene carrier. In this paper, RGDS and PLL modified GO (GO–PLL–RGDS) was synthesized and its parameters and activities were evaluated as a tumor targeting carrier for VEGF-siRNA delivery.
2. Materials and methods
2.1 Materials
The graphene oxide (GO) sheet and poly-L-lysine hydrobromide (PLL, Mw = 30![[thin space (1/6-em)]](https://www.rsc.org/images/entities/char_2009.gif) 000–70
000–70![[thin space (1/6-em)]](https://www.rsc.org/images/entities/char_2009.gif) 000 Da) were purchased from Sigma-Aldrich (St. Louis, USA). KOH, TFA (trifluoroacetic acid) and TfOH (trifluoromethanesulfonic acid) were purchased from Beijing Chemical Works (Beijing, China). DCC (dicyclohexylcarbodiimide), EDC·HCl (N1-((ethylimino)methylene)-N3,N3-dimethylpropane-1,3-diamine) and HOBt (1-hydroxybenzotriazole) were obtained from GL Biochem Ltd (Shanghai, China). TE buffer (Tris–HCl (10 mM) and EDTA (1 mM), pH 8.0) were obtained from GL Biochem Ltd (Shanghai, China). Dialysis membranes (Mwco: 8 kD, 100 kD) were purchased from Spectrumlabs (California, USA). Lipo-RNAiMAX (Lipo) was purchased from Invitrogen (California, USA). DMEM (dulbecco's modified eagle's medium), fetal bovine serum (FBS) and trypsin were provided by Hyclone Laboratories Inc. (Logan, UT, USA). Penicillin, streptomycin and MTT (3-(4,5-dimethylthiazol-2-yl)-2,5-diphenyltetrazolium bromide) were purchased from Sigma-Aldrich (St. Louis, USA). Human VEGF ELISA Kit, Mouse VEGF ELISA Kit, High Capacity cDNA Reverse Transcription Kit, High Capacity RNA-to-cDNA Kit, TaqMan Gene Expression Master Mix and TaqMan Gene Expression Assays (VEGF assay, GAPDH assay) kit were purchased from Thermo Fisher Scientific (Massachusetts, USA). TRIzol was obtained from Invitrogen (California, USA). Matrigel was provided by BD Bio-sciences (New Jersey, USA). Other chemicals and reagents were of analytical grade.
000 Da) were purchased from Sigma-Aldrich (St. Louis, USA). KOH, TFA (trifluoroacetic acid) and TfOH (trifluoromethanesulfonic acid) were purchased from Beijing Chemical Works (Beijing, China). DCC (dicyclohexylcarbodiimide), EDC·HCl (N1-((ethylimino)methylene)-N3,N3-dimethylpropane-1,3-diamine) and HOBt (1-hydroxybenzotriazole) were obtained from GL Biochem Ltd (Shanghai, China). TE buffer (Tris–HCl (10 mM) and EDTA (1 mM), pH 8.0) were obtained from GL Biochem Ltd (Shanghai, China). Dialysis membranes (Mwco: 8 kD, 100 kD) were purchased from Spectrumlabs (California, USA). Lipo-RNAiMAX (Lipo) was purchased from Invitrogen (California, USA). DMEM (dulbecco's modified eagle's medium), fetal bovine serum (FBS) and trypsin were provided by Hyclone Laboratories Inc. (Logan, UT, USA). Penicillin, streptomycin and MTT (3-(4,5-dimethylthiazol-2-yl)-2,5-diphenyltetrazolium bromide) were purchased from Sigma-Aldrich (St. Louis, USA). Human VEGF ELISA Kit, Mouse VEGF ELISA Kit, High Capacity cDNA Reverse Transcription Kit, High Capacity RNA-to-cDNA Kit, TaqMan Gene Expression Master Mix and TaqMan Gene Expression Assays (VEGF assay, GAPDH assay) kit were purchased from Thermo Fisher Scientific (Massachusetts, USA). TRIzol was obtained from Invitrogen (California, USA). Matrigel was provided by BD Bio-sciences (New Jersey, USA). Other chemicals and reagents were of analytical grade.
Human cervical carcinoma cell line HeLa cells and human umbilical vein endothelial cells (HUVECs) were obtained from Cancer Hospital in Chinese Academy of Medical Sciences. VEGF-siRNA, fluorescein-labeled VEGF-siRNA (FAM-VEGF-siRNA, Cy3-VEGF-siRNA) and the scramble sequence of siRNA were purchased from Gene-Pharma Co., Ltd (Shanghai, China). The scramble sequence of siRNA served as normal control (NC).
2.2 Preparation of the GO–PLL
GO–PLL was synthesized through previous method.45–47 GO sheets (2 mg) were dispersed into 4 mL of deionized water (DI water) using a ultrasonic cleaner. To obtain nano-size GO, the GO suspension (0.5 mg mL−1) was ultrasonicated again using an ultrasonic probe for 2 h (two seconds interval model). PLL and 4 mL of KOH solution (pH 9) were added into 4 mL of GO suspension, and the pH value of mixture was adjusted to 9.0 with KOH solution (pH 11). Then the mixture was stirred at 70 °C for 24 h. After that, GO–PLL was obtained by centrifugation (12![[thin space (1/6-em)]](https://www.rsc.org/images/entities/char_2009.gif) 000g, 20 min) and washed with DI water three times. Then the GO–PLL was collected and freeze dried. A series of GO–PLL complexes was prepared using various reaction ratios (w/w, 2
000g, 20 min) and washed with DI water three times. Then the GO–PLL was collected and freeze dried. A series of GO–PLL complexes was prepared using various reaction ratios (w/w, 2![[thin space (1/6-em)]](https://www.rsc.org/images/entities/char_2009.gif) :
:![[thin space (1/6-em)]](https://www.rsc.org/images/entities/char_2009.gif) 1, 1
1, 1![[thin space (1/6-em)]](https://www.rsc.org/images/entities/char_2009.gif) :
:![[thin space (1/6-em)]](https://www.rsc.org/images/entities/char_2009.gif) 2, 1
2, 1![[thin space (1/6-em)]](https://www.rsc.org/images/entities/char_2009.gif) :
:![[thin space (1/6-em)]](https://www.rsc.org/images/entities/char_2009.gif) 5, 1
5, 1![[thin space (1/6-em)]](https://www.rsc.org/images/entities/char_2009.gif) :
:![[thin space (1/6-em)]](https://www.rsc.org/images/entities/char_2009.gif) 10, 1
10, 1![[thin space (1/6-em)]](https://www.rsc.org/images/entities/char_2009.gif) :
:![[thin space (1/6-em)]](https://www.rsc.org/images/entities/char_2009.gif) 15) of GO and PLL.
15) of GO and PLL.
2.3 Preparation of GO–PLL–SDGR and GO–PLL–SDGR/VEGF-siRNA
GO–PLL–SDGR and GO–PLL–SDGR/VEGF-siRNA were prepared and showed in Scheme 1.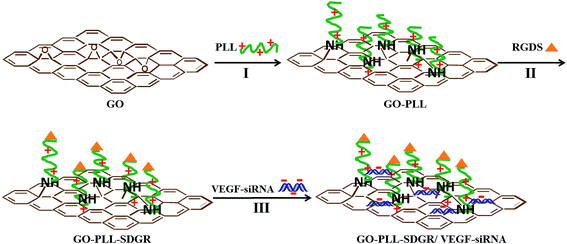 | ||
| Scheme 1 Schematic diagram for GO–PLL–SDGR and GO–PLL–SDGR/VEGF-siRNA preparation. I: KOH, 70 °C. II: preparation of GO–PLL–SDGR from GO–PLL. III: incubation at room temperature for 30 min. | ||
In brief, GO–PLL powder (2 mg) was dispersed into 10 mL of dried DMF by sonication for 1 h to obtain GO–PLL suspension. Boc-Arg(Tos)-Gly-Asp(OMe)-Ser-OH (10 mg) and EDC·HCl (30 mg) were added into 10 mL of DMF, and the mixture was activated by stirring for 15 min. Then, the GO–PLL suspension and 30 mg of HOBt were added into the activated solution and stirred at room temperature. After 24 h, the mixture was collected and centrifuged (12![[thin space (1/6-em)]](https://www.rsc.org/images/entities/char_2009.gif) 000g, 15 min); the sediment was washed with DI water three times. Finally, GO–PLL–Ser-Asp(OMe)-Gly-Arg(Tos)-Boc was obtained by freeze drying. The protecting groups of GO–PLL–Ser-Asp(OMe)-Gly-Arg(Tos)-Boc were taken off by the general methods of saponification and acidolysis using NaOH (2 mol L−1) and TFA/TfOH (4
000g, 15 min); the sediment was washed with DI water three times. Finally, GO–PLL–Ser-Asp(OMe)-Gly-Arg(Tos)-Boc was obtained by freeze drying. The protecting groups of GO–PLL–Ser-Asp(OMe)-Gly-Arg(Tos)-Boc were taken off by the general methods of saponification and acidolysis using NaOH (2 mol L−1) and TFA/TfOH (4![[thin space (1/6-em)]](https://www.rsc.org/images/entities/char_2009.gif) :
:![[thin space (1/6-em)]](https://www.rsc.org/images/entities/char_2009.gif) 1, v/v) respectively. After the suspension was centrifuged at 10
1, v/v) respectively. After the suspension was centrifuged at 10![[thin space (1/6-em)]](https://www.rsc.org/images/entities/char_2009.gif) 000g for 10 min and the sediment was washed three times with distilled water, GO–PLL–Ser-Asp-Gly-Arg (GO–PLL–SDGR) was obtained. GO–PLL–SDGR was further purified by dialysis in DI water. (Mwco of dialysis membrane: 8 kD). After 48 h, GO–PLL–SDGR was collected and freeze dried.
000g for 10 min and the sediment was washed three times with distilled water, GO–PLL–Ser-Asp-Gly-Arg (GO–PLL–SDGR) was obtained. GO–PLL–SDGR was further purified by dialysis in DI water. (Mwco of dialysis membrane: 8 kD). After 48 h, GO–PLL–SDGR was collected and freeze dried.
The loading capacity of GO–PLL–SDGR was investigated by agarose gel retardation assay. GO–PLL–SDGR/VEGF-siRNA and GO/VEGF-siRNA with different N/P ratios (N/P = 2![[thin space (1/6-em)]](https://www.rsc.org/images/entities/char_2009.gif) :
:![[thin space (1/6-em)]](https://www.rsc.org/images/entities/char_2009.gif) 1, 8
1, 8![[thin space (1/6-em)]](https://www.rsc.org/images/entities/char_2009.gif) :
:![[thin space (1/6-em)]](https://www.rsc.org/images/entities/char_2009.gif) 1, 10
1, 10![[thin space (1/6-em)]](https://www.rsc.org/images/entities/char_2009.gif) :
:![[thin space (1/6-em)]](https://www.rsc.org/images/entities/char_2009.gif) 1, 20
1, 20![[thin space (1/6-em)]](https://www.rsc.org/images/entities/char_2009.gif) :
:![[thin space (1/6-em)]](https://www.rsc.org/images/entities/char_2009.gif) 1, 30
1, 30![[thin space (1/6-em)]](https://www.rsc.org/images/entities/char_2009.gif) :
:![[thin space (1/6-em)]](https://www.rsc.org/images/entities/char_2009.gif) 1, 40
1, 40![[thin space (1/6-em)]](https://www.rsc.org/images/entities/char_2009.gif) :
:![[thin space (1/6-em)]](https://www.rsc.org/images/entities/char_2009.gif) 1, 50
1, 50![[thin space (1/6-em)]](https://www.rsc.org/images/entities/char_2009.gif) :
:![[thin space (1/6-em)]](https://www.rsc.org/images/entities/char_2009.gif) 1, w/w) were prepared by adding VEGF-siRNA (1 μg) into GO–PLL–SDGR or GO suspension (1 μg μL−1). All test groups were shaken gently and incubated at room temperature for 30 min.41,48,49 The process was stopped by adding 5 μL of loading buffer. Then, the samples were electrophoresed in 1% (w/v) agarose gel containing ethidium bromide (EtBr, 2 mg mL−1) at 120 V for 20 min. The results were recorded using UV transilluminator.
1, w/w) were prepared by adding VEGF-siRNA (1 μg) into GO–PLL–SDGR or GO suspension (1 μg μL−1). All test groups were shaken gently and incubated at room temperature for 30 min.41,48,49 The process was stopped by adding 5 μL of loading buffer. Then, the samples were electrophoresed in 1% (w/v) agarose gel containing ethidium bromide (EtBr, 2 mg mL−1) at 120 V for 20 min. The results were recorded using UV transilluminator.
2.4 Characterization
The structure of GO, PLL, GO–PLL and GO–PLL–SDGR was characterized by FTIR spectra and UV-vis absorption spectra. UV-vis absorption was measured using UV-Vis spectrophotometer (water served as solvent). The morphologic characteristics of GO–PLL–SDGR and GO–PLL–SDGR/VEGF-siRNA were observed by atomic force microscope (AFM) and transmission electron microscope (TEM). Other physical parameters including zeta potential, hydrodynamic sizes and optical property were evaluated using Zeta potential analyzer and laser pointer. Laser light (λ = 650 nm) was used to induce Tyndall effect, GO (100 μg mL−1) and GO–PLL–SDGR (100 μg mL−1) in ultrapure water were used as test candidates and ultrapure water was used as a blank control.2.5 Calorimetric analysis
Differential scanning calorimeter (DSC) was used as an auxiliary method to confirm the absorption of VEGF-siRNA onto GO–PLL–SDGR. GO (40 μL, 5.28 μg mL−1), GO–PLL–SDGR (40 μL, 5.28 μg mL−1), and GO–PLL–SDGR/VEGF-siRNA (40 μL, concentration of VEGF-siRNA: 40 nM, 80 nM, 120 nM) were heated respectively in a pierced aluminum pan from 20 °C to 200 °C (scan at 20 °C min−1), and the DSC curves were recorded. After each heating, the samples were cooled to 20 °C at a rate of −40 °C min−1.2.6 Release profile of VEGF-siRNA
Dialysis assay was carried out to evaluate the releasing of VEGF-siRNA from GO–PLL–SDGR/VEGF-siRNA and GO. Different concentration (0.25, 0.5, 1, 2, 10 nM) of VEGF-siRNA as standard curve samples were measured by fluorescence spectrophotometer. Test candidates including 500 μL of VEGF-siRNA (100 nM), GO/VEGF-siRNA (100 nM) and GO–PLL–SDGR/VEGF-siRNA (100 nM) were respectively dispersed in RNase-free water (the internal phase in dialysis) and added into dialysis membrane (Mwco: 100 kD). TE buffer (5 mL) was added into RNase free tubes, used as external phase. The dialysis bag was putted in the tube and shaken in water bath at 37 °C. Then external TE buffer was collected and replaced with fresh TE buffer at different time points. The released VEGF-siRNA was measured by fluorescence spectrophotometer, the excitation wavelength was set at 492 nm and emission wavelength was set at 518 nm. According to the standard curve of VEGF-siRNA, the percentage of cumulatively released of VEGF-siRNA was calculated. All experiments were repeated for three times. All siRNA applied in the experiments was FAM-labeled.2.7 Cell culture and cytotoxicity assay
HeLa cells were cultured in DMEM containing 10% FBS, 100 μg mL−1 of streptomycin, and 100 μg mL−1 of penicillin (complete medium) at 37 °C in a humidified atmosphere containing 5% CO2. The cytotoxicity of GO–PLL and GO–PLL–SDGR were evaluated using MTT assay. HeLa cells were seeded in 96-well plate in the density of 4 × 10³ per well and cultured for 24 h. Blank culture medium was used as blank control. GO–PLL (10–150 μg mL−1) and GO–PLL–SDGR (10–150 μg mL−1) in 20 μL of culture medium were added into each well and incubated for another 48 h. Wells containing HeLa cells and medium only were served as growth control. Cell viability was measured with MTT assay. MTT solution was prepared in PBS solution, 25 μL of MTT solution (5 mg mL−1) was added to each well and all test plates were incubated for 4 h. After the incubation, supernatant in each well was removed after centrifuged at 3000 g for 5 min, followed by adding 150 μL of DMSO. The test plates were shaken, and the results were recorded under detective wavelength 570 nm using microplate reader. All experiments were repeated 3 times, and the cell viability was calculated as follow.| Cell viability (%) = [(ODsample − ODblank)/(ODcontrol − ODblank)] × 100%. |
2.8 Cell proliferation inhibitory assay
Anti-proliferation activity of GO–PLL–SDGR/VEGF-siRNA against HeLa cells was evaluated by MTT assay. HeLa cells were seeded in 96-well plate at the density of 4 × 10³ per well and incubated for 24 h. Blank culture medium was used as blank control. After 24 h, the cells were transfected with 10, 40, 80, 120 nM of GO–PLL–SDGR, naked VEGF-siRNA, GO–PLL–SDGR/NC, Lipo/NC, GO–PLL–SDGR/VEGF-siRNA and Lipo/VEGF-siRNA (20 μL per well) respectively. The cells treated with fresh medium served as the growth control. And 6 replicates were included in each group. After 4 h of incubation, the media was replaced with complete medium again and cultured for another 44 h. The cell viability was measured with MTT assay. Results were recorded under 570 nm, and all experiments were repeated 3 times.2.9 The cellular uptake of GO–PLL–SDGR/VEGF-siRNA
HeLa cells (2.5 × 10⁵ cells per dish) were seeded into 35 mm coverglass bottom dish and cultured with complete medium for 24 h. Then the medium was replaced respectively with the serum-free medium containing nothing (blank control), VEGF-siRNA (100 nM), GO–PLL–SDGR/VEGF-siRNA (100 nM) and Lipo/VEGF-siRNA (100 nM), and all dishes were incubated for 4 h. After that, the medium was removed and the cells were washed three times with the cold phosphate buffer saline solution (PBS, pH 7.4, 0.01 M). Hoechst 33![[thin space (1/6-em)]](https://www.rsc.org/images/entities/char_2009.gif) 342 (1 mL per dish, 4 μg mL−1) was added into the dishes to stain the cell nuclei and all dishes were incubated for 20 min at 37 °C. Then, the dye was discarded, and cells were washed with cold PBS solution. The images of cells were obtained by using a laser scanning confocal microscope and analyzed using Leica CLSM software. All siRNA applied in the experiments was FAM-labeled.
342 (1 mL per dish, 4 μg mL−1) was added into the dishes to stain the cell nuclei and all dishes were incubated for 20 min at 37 °C. Then, the dye was discarded, and cells were washed with cold PBS solution. The images of cells were obtained by using a laser scanning confocal microscope and analyzed using Leica CLSM software. All siRNA applied in the experiments was FAM-labeled.
2.10 Real time qPCR
The VEGF mRNA in HeLa cells treated with GO–PLL–SDGR/VEGF-siRNA was detected by using quantitative real time PCR. HeLa cells were seeded into 6-well plate (3.0 × 10⁵ cells per well) and cultured overnight. Then, the cells were transfected with GO–PLL–SDGR/VEGF-siRNA (100 nM), VEGF-siRNA (100 nM), GO–PLL–SDGR/NC (100 nM) and Lipo/VEGF-siRNA (100 nM) respectively. Cells were not treated served as blank control. VEGF-siRNA (100 nM) and GO–PLL–SDGR/NC (100 nM) were used as negative controls, Lipo/VEGF-siRNA (100 nM) was used as positive control. After 4 h, the medium was replaced with complete medium and all plates were cultured for another 44 h. After the incubation, HeLa cells were harvested and the total RNA was extracted using TRIzol reagent according to the product instructions. RNA concentration was determined using Nanodrop spectrophotometer. cDNA was synthesized using High Capacity RNA-to-cDNA Kit. The cDNA (2 μL) were amplified by 7500 Real Time PCR System following the standard instructions. There were three duplicates for each sample in the same run. The housekeeping gene, GAPDH, was used as inner reference. With Applied Biosystems Sequence detection software (7500 Fast System SDS Software version 1.4), all results were reported as relative quantity of expression using ΔΔ Ct method.2.11 ELISA analysis
HeLa cells were seeded into 6-well plate (3.0 × 10⁵ cells per well). After cultured overnight, the cells were transfected with naked VEGF-siRNA (100 nM), GO–PLL–SDGR/NC (100 nM), GO–PLL–SDGR/VEGF-siRNA (100 nM) and Lipo/VEGF-siRNA (100 nM). After 4 h incubation, all media were replaced with complete medium and all cells were cultured for another 44 h. Supernatants from each well were collected and centrifuged (2500g, 4 °C) for 10 min. The amount of VEGF protein in supernatant was measured using Human VEGF ELISA Kit according to the manufacturer's instruction. The amount of VEGF protein in blank control group was used as reference (ODref = 1). OD values were recorded under 450 nm using microplate reader. All experiments were repeated 3 times.2.12 Matrigel angiogenesis assay
To confirm that VEGF-induced tube formation can be inhibited by GO–PLL–SDGR/VEGF-siRNA, HUVECs in culture were used as an in vitro model of angiogenesis.50,51 HeLa cells (3.0 × 10⁵ cells per well) were seeded in 6-well plates and cultured overnight. Then, the cells were transfected with GO–PLL–SDGR/VEGF-siRNA (100 nM), and Lipo/VEGF-siRNA (100 nM) respectively. HeLa cells treated with blank fresh medium served as VEGF-rich group. After 4 h, the medium was replaced with complete medium and all cells were cultured for another 44 h. After that, the medium in different wells was collected for HUVECs culture. HUVECs (6.0 × 10³ cells per well) were seeded onto the matrigel in 96-well plate and cultures with the collected medium respectively. HUVECs treated with fresh medium served as blank control (no VEGF), and with the collected medium from the Lipo/VEGF-siRNA group served as positive control (low VEGF). After 6 h, the cells were imaged under an inverted microscope.2.13 Tumor growth inhibitory assay
ICR mice (6 week-old, 18–22 g) were obtained from the Animal Department of Capital Medical University (Beijing Laboratory Animal Center, Beijing, China). All animal work was performed according to the Health Guidelines of the Capital Medical University, and protocols were approved by the Institutional Animal Ethics Committee of Capital Medical University. Tumor xenograft was made by inoculating S180 cells (2.0 × 10⁶ cells per mouse) into the right armpits of ICR mice. All mice were housed in sawdust-lined cages at constant temperatures (22–25 °C) and suitable humidity (50 ± 2.0%). Food and water were available ad libitum. Tumor volume was measured using a caliper and calculated using the equation: volume (mm3) = length × width2/2. After seven days, the size of tumors reached at 350 mm3 approximately, and all mice were divided into four groups (n = 10) randomly. The mice in the test group were treated with GO–PLL–SDGR/VEGF-siRNA once every other day intravenously at VEGF-siRNA dose of 0.3 mg kg−1. The blank control group was treated with saline solution, while negative control group was treated with naked VEGF-siRNA (0.3 mg kg−1) and positive control group was treated with Doxorubicin (2.0 μmol kg−1). After 5 treatments, all mice were sacrificed and tumors were harvested, weighed, and photographed. The serum of mice was also collected in order to evaluate the VEGF expression using Mouse VEGF ELISA Kit. Brain, liver, spleen, heart, and kidney were also harvested for detecting the distribution of RGDS. Organs and tumor were all cleaned with distilled water and homogenized on the ice to extract RGDS. Protein in the samples was precipitated by addition of 4 volumes of methanol, and the supernatants were collected after centrifugation (10![[thin space (1/6-em)]](https://www.rsc.org/images/entities/char_2009.gif) 000g, 20 min). Each supernatant sample was analyzed by magnetic sector mass analyzer after they were condensed and dried (37 °C).
000g, 20 min). Each supernatant sample was analyzed by magnetic sector mass analyzer after they were condensed and dried (37 °C).
2.14 Tumor targeting efficiency
Tumor targeting efficiency of GO–PLL–SDGR/VEGF-siRNA was further evaluated by fluorescence imaging assay. Tumor xenograft was made by inoculating S180 cells (200 μL, 1.0 × 10⁷ cells per mL) into the right armpits of ICR mice (6 week-old, male, 18–22 g). The cancer-bearing mice were divided into three groups randomly (n = 3) when the size of the tumor reached at approximately 150 mm3. The blank control group was treated with saline solution, while negative control group was treated with Cy3-VEGF-siRNA (0.3 mg kg−1) intravenously. The positive control group was treated with GO–PLL–SDGR/Cy3-VEGF-siRNA intravenously at VEGF-siRNA dose of 0.3 mg kg−1. The mice were sacrificed 24 hours later after the injection, and heart, liver, spleen, lung, kidney, brain and tumor were harvested. The distribution of Cy3-VEGF-siRNA was visualized by in-vivo Imaging System FX Pro (excitation wavelength was set at 550 nm and emission wavelength was set at 570 nm).2.15 Statistics analysis
Data are represented as the average ± standard deviation (SD). Statistical analysis was performed using paired two-sample t-test. P-value < 0.05 was considered statistically significant.3. Results and discussion
3.1 Zeta potential and dispersion stability of GO–PLL
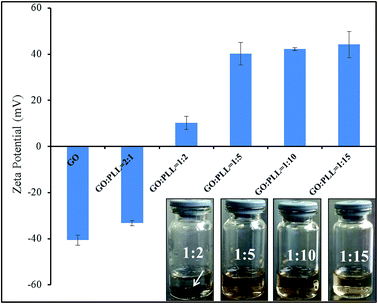
Zeta potential is an important parameter indicating the stability of colloidal suspension. The zeta potentials of GO–PLL synthesized using various reaction ratios (GO/PLL, w/w, 2![[thin space (1/6-em)]](https://www.rsc.org/images/entities/char_2009.gif) :
:![[thin space (1/6-em)]](https://www.rsc.org/images/entities/char_2009.gif) 1, 1
1, 1![[thin space (1/6-em)]](https://www.rsc.org/images/entities/char_2009.gif) :
:![[thin space (1/6-em)]](https://www.rsc.org/images/entities/char_2009.gif) 2, 1
2, 1![[thin space (1/6-em)]](https://www.rsc.org/images/entities/char_2009.gif) :
:![[thin space (1/6-em)]](https://www.rsc.org/images/entities/char_2009.gif) 5, 1
5, 1![[thin space (1/6-em)]](https://www.rsc.org/images/entities/char_2009.gif) :
:![[thin space (1/6-em)]](https://www.rsc.org/images/entities/char_2009.gif) 10, 1
10, 1![[thin space (1/6-em)]](https://www.rsc.org/images/entities/char_2009.gif) :
:![[thin space (1/6-em)]](https://www.rsc.org/images/entities/char_2009.gif) 15) were shown in Fig. 1. With the increasing amount of PLL, zeta potential of GO–PLL increased from −33.22 ± 1.07 mV to 44.16 ± 5.37 mV. When the ratio reached GO
15) were shown in Fig. 1. With the increasing amount of PLL, zeta potential of GO–PLL increased from −33.22 ± 1.07 mV to 44.16 ± 5.37 mV. When the ratio reached GO![[thin space (1/6-em)]](https://www.rsc.org/images/entities/char_2009.gif) :
:![[thin space (1/6-em)]](https://www.rsc.org/images/entities/char_2009.gif) PLL = 1
PLL = 1![[thin space (1/6-em)]](https://www.rsc.org/images/entities/char_2009.gif) :
:![[thin space (1/6-em)]](https://www.rsc.org/images/entities/char_2009.gif) 2, black precipitation (arrow pointed area) could be observed at the bottom of test bottle after 48 h, and the zeta potential was recorded at 10.24 ± 2.79 mV. When the zeta potential reached at 40 mV (GO
2, black precipitation (arrow pointed area) could be observed at the bottom of test bottle after 48 h, and the zeta potential was recorded at 10.24 ± 2.79 mV. When the zeta potential reached at 40 mV (GO![[thin space (1/6-em)]](https://www.rsc.org/images/entities/char_2009.gif) :
:![[thin space (1/6-em)]](https://www.rsc.org/images/entities/char_2009.gif) PLL = 1
PLL = 1![[thin space (1/6-em)]](https://www.rsc.org/images/entities/char_2009.gif) :
:![[thin space (1/6-em)]](https://www.rsc.org/images/entities/char_2009.gif) 5), the GO–PLL was highly dispersed, and the suspension was stable, no aggregation was observed. Therefore, we conjugated GO with PLL at the ratio of 1
5), the GO–PLL was highly dispersed, and the suspension was stable, no aggregation was observed. Therefore, we conjugated GO with PLL at the ratio of 1![[thin space (1/6-em)]](https://www.rsc.org/images/entities/char_2009.gif) :
:![[thin space (1/6-em)]](https://www.rsc.org/images/entities/char_2009.gif) 5 (w/w) in this research.
5 (w/w) in this research.
3.2 Characterization
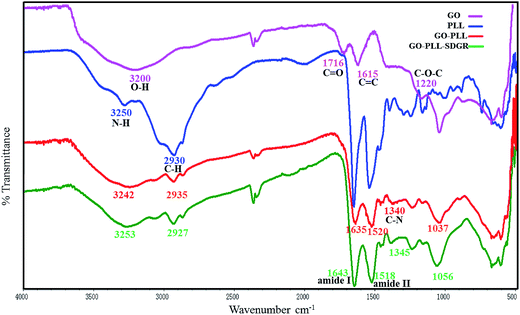
The FTIR measurement could help to confirm the successful preparation of GO–PLL–SDGR. Spectra of GO (pink), PLL (blue), GO–PLL (red) and GO–PLL–SDGR (green) were shown in Fig. 2.The spectrum of GO characterized absorption peaks at 3200 cm−1(broad absorption peak of O–H stretching vibration), 1716 cm−1(C![[double bond, length as m-dash]](https://www.rsc.org/images/entities/char_e001.gif) O stretching vibration), 1615 cm−1(C
O stretching vibration), 1615 cm−1(C![[double bond, length as m-dash]](https://www.rsc.org/images/entities/char_e001.gif) C stretching vibration) and 1220 cm−1(C–O–C vibration). Compared to the spectrum of GO, GO–PLL showed the characteristic peak at 2935 cm−1 (C–H stretching vibration), 1635 cm−1 (C
C stretching vibration) and 1220 cm−1(C–O–C vibration). Compared to the spectrum of GO, GO–PLL showed the characteristic peak at 2935 cm−1 (C–H stretching vibration), 1635 cm−1 (C![[double bond, length as m-dash]](https://www.rsc.org/images/entities/char_e001.gif) O stretching vibration). The peak at 1340 cm−1 (C–N stretching vibration) indicates that PLL covalently connected to GO. In the spectrum of GO–PLL–SDGR, the strong absorption peaks of amide I (1643 cm−1) and amide II (1518 cm−1) were caused by amidation between GO–PLL and RGDS.
O stretching vibration). The peak at 1340 cm−1 (C–N stretching vibration) indicates that PLL covalently connected to GO. In the spectrum of GO–PLL–SDGR, the strong absorption peaks of amide I (1643 cm−1) and amide II (1518 cm−1) were caused by amidation between GO–PLL and RGDS.
The modified graphene oxide was also characterized by UV-vis spectroscopy. As shown in Fig. S1,† the absorption peak of GO (green) in water at 235 nm was attributed to π–π* transition of aromatic ring. Absorption peak for PLL (blue) was at 225 nm. The appearance of shoulder peak of GO–PLL indicated a red-shift from 235 nm to 270 nm caused by ring-opening reaction between GO and PLL. The UV-vis spectrum of GO–PLL–SDGR (orange) showed a dominant absorption at 208 nm and a shoulder peak at 270 nm, resulted from the conjugation of RGDS.
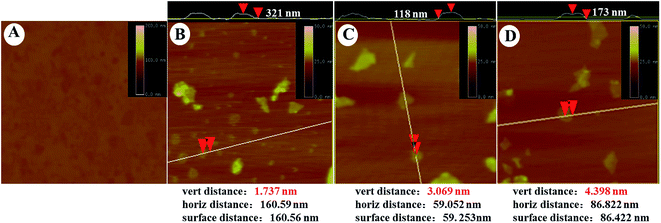
The morphology of GO–PLL–SDGR was studied by TEM and AFM. As TEM images shown in Fig. 3, GO had typical wrinkle sheet-like nanostructure with the diameter size from 100 nm to 350 nm (Fig. 3A), while GO–PLL–SDGR had the smaller diameter size from 60 nm to 150 nm (Fig. 3B). The reduction in size of GO–PLL–SDGR was possibly a result of hydrophilicity improvement. As shown in Fig. 4, the lateral dimension of GO–PLL–SDGR (Fig. 4C) was about 120 nm, and the thickness increased from 1.7 nm of GO (Fig. 4B) to 3.0 nm because of the conjugation of PLL and RGDS. Compared to GO–PLL–SDGR, the diameter size of GO–PLL–SDGR/VEGF-siRNA (Fig. 3C and 4D) increased by appx. 50 nm, and the thickness increased to 4.4 nm due to the loading of VEGF-siRNA.
The Tyndall phenomenon was observed through a single laser beam (λ = 650 nm) as shown in Fig. S2-c,† which suggested that GO and GO–PLL–SDGR aqueous suspension reached the nano-level. As shown in Fig. S2-h,† GO–PLL–SDGR had an average hydrodynamic size of 162.9 nm.
The cellular uptake of the nanocarriers variously depends on their size as well as the surface characteristics.52,53 Zeta potential of GO was −40.59 ± 2.23 mV (Fig. S2-d†), which indicated that GO was negative charged. After modification with PLL and RGDS, zeta potential of GO–PLL–SDGR turned to 25.87 ± 0.47 mV (Fig. S2-e†), which is significant for successfully loading the negatively charged siRNA and keeping the nano-dispersion stable. As shown in Fig. S2-a,† GO–PLL–SDGR could stay stable in water, PBS and DMEM medium after 48 h, while GO could coagulate in PBS and DMEM (arrow pointed area was the precipitation, Fig. S2-b†). The complex of GO–PLL–SDGR/VEGF-siRNA was positively charged with zeta potential at 15.36 ± 2.62 mV (Fig. S2-f†), which is beneficial to transfection and cytophagy.
3.3 Agarose gel retardation assay and calorimetric analysis
The electrostatic adsorption of VEGF-siRNA on GO–PLL–SDGR was analyzed quantitatively and qualitatively by agarose gel retardation assay. As shown in Fig. 5, GO/VEGF-siRNA and GO–PLL–SDGR/VEGF-siRNA at different N/P ratios (w/w, 0![[thin space (1/6-em)]](https://www.rsc.org/images/entities/char_2009.gif) :
:![[thin space (1/6-em)]](https://www.rsc.org/images/entities/char_2009.gif) 1, 2
1, 2![[thin space (1/6-em)]](https://www.rsc.org/images/entities/char_2009.gif) :
:![[thin space (1/6-em)]](https://www.rsc.org/images/entities/char_2009.gif) 1, 8
1, 8![[thin space (1/6-em)]](https://www.rsc.org/images/entities/char_2009.gif) :
:![[thin space (1/6-em)]](https://www.rsc.org/images/entities/char_2009.gif) 1, 10
1, 10![[thin space (1/6-em)]](https://www.rsc.org/images/entities/char_2009.gif) :
:![[thin space (1/6-em)]](https://www.rsc.org/images/entities/char_2009.gif) 1, 20
1, 20![[thin space (1/6-em)]](https://www.rsc.org/images/entities/char_2009.gif) :
:![[thin space (1/6-em)]](https://www.rsc.org/images/entities/char_2009.gif) 1, 30
1, 30![[thin space (1/6-em)]](https://www.rsc.org/images/entities/char_2009.gif) :
:![[thin space (1/6-em)]](https://www.rsc.org/images/entities/char_2009.gif) 1, 40
1, 40![[thin space (1/6-em)]](https://www.rsc.org/images/entities/char_2009.gif) :
:![[thin space (1/6-em)]](https://www.rsc.org/images/entities/char_2009.gif) 1, 50
1, 50![[thin space (1/6-em)]](https://www.rsc.org/images/entities/char_2009.gif) :
:![[thin space (1/6-em)]](https://www.rsc.org/images/entities/char_2009.gif) 1) were tested. It was found that VEGF-siRNA in each GO–PLL–SDGR/VEGF-siRNA group was retarded partly or totally (Fig. 5B), which indicated that VEGF-siRNA was effectively absorbed onto GO–PLL–SDGR. The siRNA band disappeared at the N/P ratio of 10
1) were tested. It was found that VEGF-siRNA in each GO–PLL–SDGR/VEGF-siRNA group was retarded partly or totally (Fig. 5B), which indicated that VEGF-siRNA was effectively absorbed onto GO–PLL–SDGR. The siRNA band disappeared at the N/P ratio of 10![[thin space (1/6-em)]](https://www.rsc.org/images/entities/char_2009.gif) :
:![[thin space (1/6-em)]](https://www.rsc.org/images/entities/char_2009.gif) 1 in Fig. 5B, which revealed that 0.1 mg of VEGF-siRNA could be loaded in 1.0 mg of GO–PLL–SDGR. All GO–PLL–SDGR/VEGF-siRNA complexes in further study were prepared using N/P ratio 10
1 in Fig. 5B, which revealed that 0.1 mg of VEGF-siRNA could be loaded in 1.0 mg of GO–PLL–SDGR. All GO–PLL–SDGR/VEGF-siRNA complexes in further study were prepared using N/P ratio 10![[thin space (1/6-em)]](https://www.rsc.org/images/entities/char_2009.gif) :
:![[thin space (1/6-em)]](https://www.rsc.org/images/entities/char_2009.gif) 1 (w/w), according to this result of gel retardation assay. But unlike GO–PLL–SDGR, GO could not retard the migration of VEGF-siRNA under the electrical field (Fig. 5A). Therefore, surface modification of GO was crucial for its capacity of loading siRNA.
1 (w/w), according to this result of gel retardation assay. But unlike GO–PLL–SDGR, GO could not retard the migration of VEGF-siRNA under the electrical field (Fig. 5A). Therefore, surface modification of GO was crucial for its capacity of loading siRNA.
DSC curves of GO, GO–PLL–SDGR and GO–PLL–SDGR/VEGF-siRNA were recorded and shown in Fig. S3.† GO and GO–PLL–SDGR showed the endothermic peaks at 139.4 °C and 135.6 °C respectively. With the increase amount of VEGF-siRNA, the endothermic peaks of GO–PLL–SDGR/VEGF-siRNA shifted from 133.9 °C to 131.7 °C. The change of endothermic peaks was resulted from the interaction (the electrostatic adsorption between positive charged GO–PLL–SDGR and negative charged VEGF-siRNA) between GO–PLL–SDGR and VEGF-siRNA, which was an auxiliary evidence of the successful loading of VEGF-siRNA onto GO–PLL–SDGR.54,55
3.4 Release profile of VEGF-siRNA
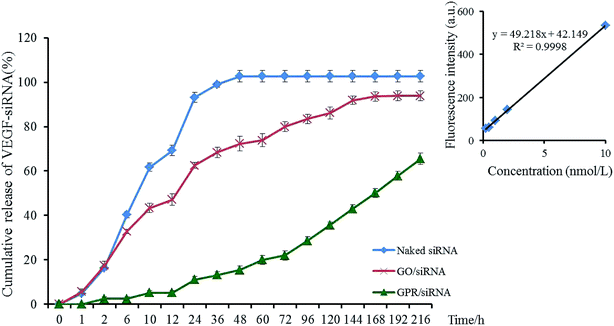
The release profiles of VEGF-siRNA from GO–PLL–SDGR/VEGF-siRNA (green) and GO/VEGF-siRNA (red) in vitro were shown in Fig. 6, and the release of naked VEGF-siRNA (blue) was measured as blank control.The cumulative release curve of GO–PLL–SDGR/VEGF-siRNA (green) showed a slow and sustained release compared with release curve of GO/VEGF-siRNA (red), which was contributed to prolonging the acting time of VEGF-siRNA. While 17.45% of VEGF-siRNA was released from GO/VEGF-siRNA at 2 h, 2.42% of VEGF-siRNA was released from GO–PLL–SDGR/VEGF-siRNA. At 216 h, 65.19% of VEGF-siRNA was released from GO–PLL–SDGR/VEGF-siRNA cumulatively, while VEGF-siRNA was released from GO/VEGF-siRNA completely. Because GO has negative charges, precluding the attraction with negatively charged VEGF-siRNA. However, the positively charged PLLs were suggested as soft arms linking the siRNA to GO–PLL–SDGR, protecting the siRNA from enzymolysis and releasing the siRNA slowly.
3.5 The cellular uptake of GO–PLL–SDGR/VEGF-siRNA
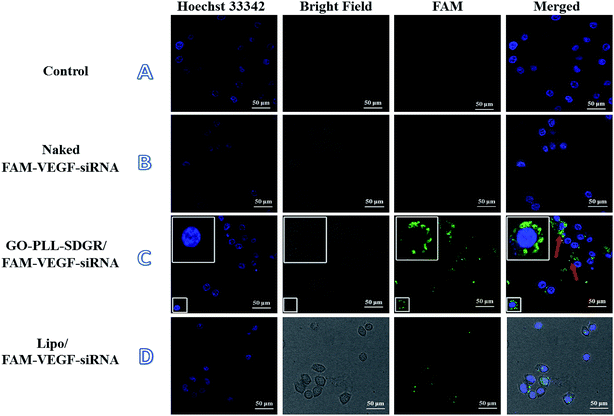
The cellular uptake of GO–PLL–SDGR/VEGF-siRNA was studied using laser scanning confocal microscope. Images of HeLa cells treated with blank medium, naked FAM–VEGF-siRNA, Lipo/FAM–VEGF-siRNA or GO–PLL–SDGR/FAM–VEGF-siRNA were captured and shown in Fig. 7.Clear fluorescent signal was observed in cytoplasm in the GO–PLL–SDGR/FAM–VEGF-siRNA group (Fig. 7C). As a positive control, fluorescent signal was also observed in Fig. 7D, but it was weaker than that in GO–PLL–SDGR/FAM–VEGF-siRNA group. As a negative control, green fluorescence could not be seen in Fig. 7B, indicated that naked FAM–VEGF-siRNA could not be internalized by cells. Therefore, GO–PLL–SDGR could effectively deliver VEGF-siRNA into cells, which was a fundamental quality for siRNA carrier.
3.6 Cytotoxicity of GO–PLL–SDGR and cell proliferation inhibitory assay
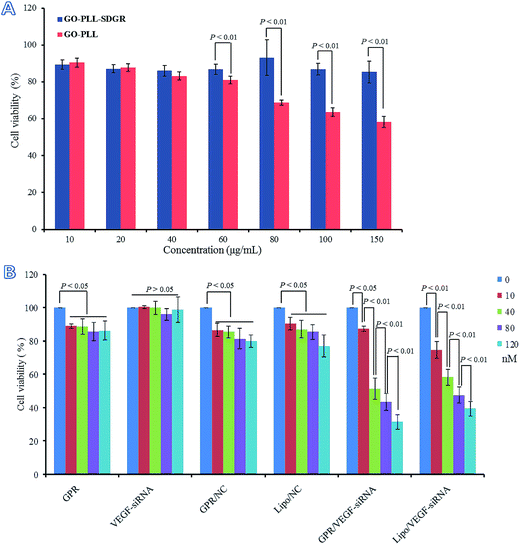
Cytotoxicity of GO–PLL and GO–PLL–SDGR were evaluated by MTT assay and the results were shown in Fig. 8A. The viability of cells treated with GO–PLL–SDGR remained above 85% even when the concentration of GO–PLL–SDGR reached 150 μg mL−1. The result indicated that GO–PLL–SDGR had no significant cytotoxicity. However, cells treated with 80–150 μg mL−1 of GO–PLL showed much lower viability compared to the cells treated with GO–PLL–SDGR at the same concentration, suggesting that the peptide portion of RGDS could lower the cytotoxicity of GO–PLL.It had been reported that the positive charged nano-carrier could be toxic by interacting with negatively charged glycocalyx on cell membrane, and the cytotoxicity of nano-carrier could be minimized by decreasing its positive charges.56,57 GO–PLL–SDGR (zeta potential = 25.87 ± 0.47 mV) with the RGDS modification showed less positive charged than GO–PLL (zeta potential = 40.20 ± 4.89 mV), contributing to a lower cytotoxicity.
The proliferation inhibitory study of GO–PLL–SDGR/VEGF-siRNA was carried out after considered the result of cellular uptake study above. The results were shown in Fig. 8B. Naked VEGF-siRNA had no anti-proliferation effect compared to blank control (P > 0.05). Although the results of GO–PLL–SDGR, GO–PLL–SDGR/NC and Lipo/NC showed difference compared with the blank control (P < 0.05), cell viability in these three groups were still remained over 80% at the maximum concentration (120 nM). However, the result of GO–PLL–SDGR/VEGF-siRNA group was remarkably different compared to blank control, and the cell viability was reduced to 31.5 ± 4.5% at the concentration of 120 nM. The inhibition efficiency enhanced significantly with the increase concentration of GO–PLL–SDGR/VEGF-siRNA, which indicated that, the in vitro anti-proliferation effect of GO–PLL–SDGR/VEGF-siRNA might be concentration-dependent.
3.7 Gene silencing efficiency of GO–PLL–SDGR/VEGF-siRNA on mRNA and protein level
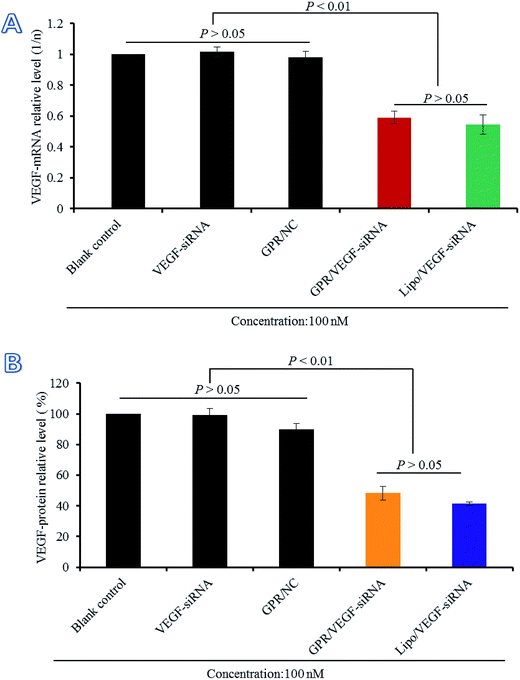
The gene silencing efficiency of GO–PLL–SDGR/VEGF-siRNA on mRNA level was evaluated by real time qPCR compared with naked VEGF-siRNA, GO–PLL–SDGR/NC and Lipo/VEGF-siRNA (served as the positive control). The results were shown in Fig. 9A. Naked VEGF-siRNA and GO–PLL–SDGR/NC had no significant gene silencing effects against VEGF gene compared with the non-treated sample (P > 0.05). According to Fig. 9A, the expression level of VEGF mRNA in HeLa cells treated with GO–PLL–SDGR/VEGF-siRNA was 0.5914 and the non-treated group was 1. The results suggested that GO–PLL–SDGR/VEGF-siRNA could effectively down-regulate the expression of VEGF mRNA in vitro, which revealed that the VEGF-siRNA could be successfully delivered into cells by GO–PLL–SDGR and silence the gene expression.The gene silencing efficiency of GO–PLL–SDGR/VEGF-siRNA was also evaluated by determining the expression of VEGF protein quantificationally. As shown in Fig. 9B, naked VEGF-siRNA and GO–PLL–SDGR/NC had no inhibitory effect on the expression of VEGF protein. And the expression level of VEGF was significantly reduced by 51.71% in the GO–PLL–SDGR/VEGF-siRNA group, compared with blank control. The results of ELISA assay reconfirmed that GO–PLL–SDGR/VEGF-siRNA could effectively silence the gene expression. Both measurements of VEGF mRNA and VEGF protein indicated that GO–PLL–SDGR could deliver VEGF-siRNA efficiently into HeLa cells to degrade VEGF-mRNA specifically and cut down the expression of VEGF protein.
3.8 GO–PLL–SDGR/VEGF-siRNA inhibited VEGF-induced angiogenesis
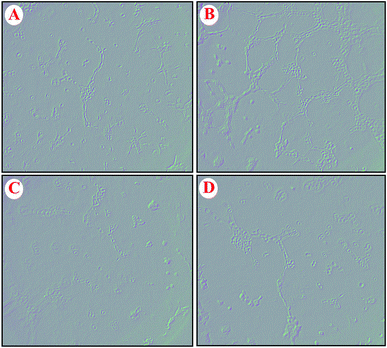
The effect of GO–PLL–SDGR/VEGF-siRNA on the VEGF-induced angiogenesis was examined with human umbilical vein endothelial cells (HUVECs) and the images were shown in Fig. 10. HUVECs cultured with the normal fresh medium were served as a blank control (Fig. 10A). Robust tubes were observed at 6 h after the HUVECs were incubated with VEGF-rich medium that collected from non-treated HeLa cells (Fig. 10B). Because the VEGF that highly expressed in HeLa cells and released into culture medium could induce the tube formation. However, few tubes formed when HUVECs were incubated with the medium that collected from the HeLa cells pretreated with GO–PLL–SDGR/VEGF-siRNA (Fig. 10C), which was similar to the group of Lipo/VEGF-siRNA (positive control, Fig. 10D). As the result of ELISA assay above shown, GO–PLL–SDGR/VEGF-siRNA could down-regulate the expression of VEGF protein in HeLa cells. And the reduction of tube formation in Fig. 10C should be ascribed to the low concentration of VEGF in culture medium. Therefore, the results demonstrated that GO–PLL–SDGR/VEGF-siRNA could inhibit angiogenesis by down-regulating the expression of VEGF, which was a significant pathway of inhibiting tumor growth.3.9 Tumor growth inhibitory assay and tumor targeting efficiency
Tumor growth inhibitory effect of GO–PLL–SDGR/VEGF-siRNA was evaluated with a S180 tumor xenograft model. The results were shown in Fig. 11.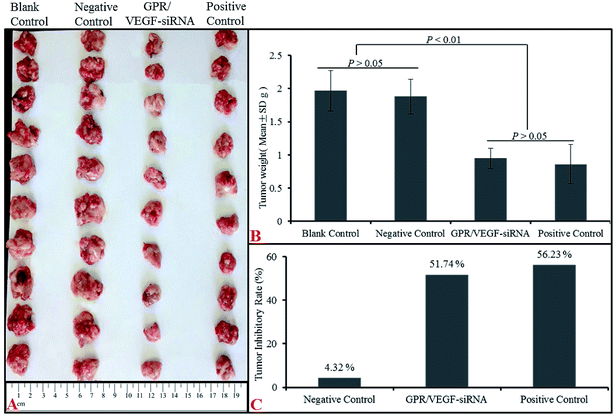 | ||
| Fig. 11 The anti-tumor effect of GPR/VEGF-siRNA in vivo. Image of tumors (A), tumor weight (B) and tumor inhibitory rate (C). n = 10 (GPR: GO–PLL–SDGR). | ||
Mice injected with normal saline (NS), VEGF-siRNA and DOX served as the blank control, negative control and positive control respectively. As Fig. 11B shown, tumor weights from NS group (1.97 ± 0.30 g) and naked VEGF-siRNA group (1.88 ± 0.26 g) had no significant difference (P > 0.05) but much higher than that of GO–PLL–SDGR/VEGF-siRNA (0.95 ± 0.15 g) treated group (P < 0.01). And the tumor inhibitory rate of GO–PLL–SDGR/VEGF-siRNA group (51.74%) was much higher than that of naked VEGF-siRNA group (4.32%), which was in the same scale as DOX group (56.23%). The similar results were also obtained in tumor volumes (Fig. 11A). Tumor tissues from GO–PLL–SDGR/VEGF-siRNA groups were much smaller than that of NS and naked VEGF-siRNA groups. This confirmed that GO–PLL–SDGR/VEGF-siRNA had tumor growth inhibitory effect almost as strong as DOX in vivo.
In order to validate the connection between suppressed VEGF expression and the tumor inhibitory activity, VEGF expression levels in vivo of normal saline (NS), naked VEGF-siRNA and GO–PLL–SDGR/VEGF-siRNA groups were analyzed by ELISA (Fig. S4†). The serum VEGF concentration of the GO–PLL–SDGR/VEGF-siRNA group (61.44 ± 2.62 pg mL−1) was lower than that of both NS group (101.31 ± 5.51 pg mL−1) and naked VEGF-siRNA group (93.21 ± 3.28 pg mL−1), which indicated that suppressing the expression of VEGF by GO–PLL–SDGR/VEGF-siRNA might be the key factor of inhibiting tumor growth.
Magnetic sector mass analyzer was used to preliminarily estimate the distribution of GO–PLL–SDGR/VEGF-siRNA. The extracts were prepared from homogenates of the heart, liver, spleen, brain, kidney and tumor tissue of GO–PLL–SDGR/VEGF-siRNA groups. Results were shown in Fig. S5.† The spectra indicate that RGDS related peak [M + K]+ was detected in the extracts of the tumor tissue, suggesting that GO–PLL–SDGR/VEGF-siRNA could target tumor tissues specifically. However, no RGDS related peak was found in heart, brain, liver, spleen and kidney, which suggested that GO–PLL–SDGR/VEGF-siRNA could not accumulated in these organs. The exact peak of RGDS ([M + K]+) was at 472.15527 m/z.
In order to get the visualized distribution results in vivo, Cy3 labeled VEGF-siRNA was used in fluorescence imaging assay. At 24 h after injection, the distribution of GO–PLL–SDGR/Cy3-VEGF-siRNA and naked Cy3-VEGF-siRNA were evaluated by in vivo imaging system (Fig. 12A). The mean fluorescent intensity of different organs and tumors were obtained by measuring the Cy3 fluorescence signal (Fig. 12B). In GO–PLL–SDGR/Cy3-VEGF-siRNA group, the fluorescent intensity of tumor was significantly stronger (1386.75 ± 175.47 a.u.) than other organs, which indicated that the GO–PLL–SDGR/Cy3-VEGF-siRNA could concentrate in tumor tissues within 24 h. Compared with GO–PLL–SDGR/Cy3–VEGF-siRNA group, the fluorescent intensity of tumor in Cy3-VEGF-siRNA group was weaker (401.40 ± 6.69 a.u.). The results revealed that GO–PLL–SDGR/VEGF-siRNA could deliver the VEGF-siRNA into tumor cells and let it accumulated in the tumor tissue more easily rather than in the other organs. Therefore, GO–PLL–SDGR/VEGF-siRNA has tumor targeted ability, mainly because GO–PLL–SDGR/VEGF-siRNA can actively target the tumor via the interaction of RGDS conjugated and absorbed in the delivery system with the integrin overexpressed on cytomembrane of cancer cells, as well as passively permeate the tumor blood vessels via the enhanced permeability and retention (EPR) effect.58,59
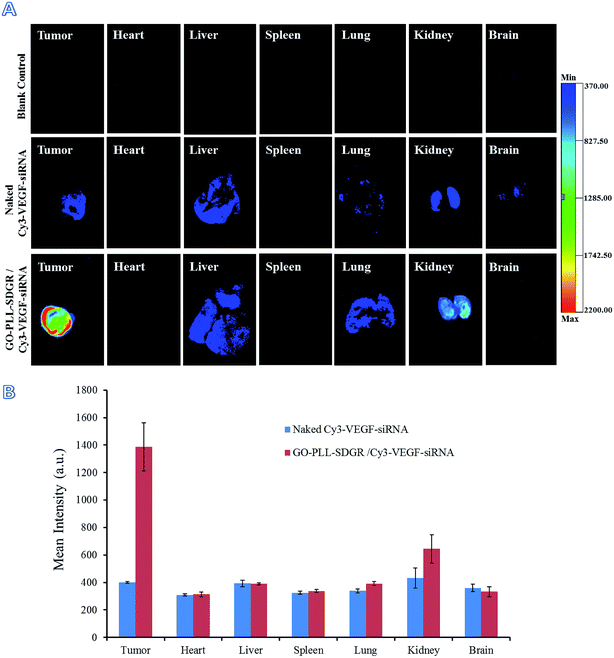 | ||
| Fig. 12 Fluorescent images of tumors and major organs at 24 h after injection (A), fluorescent intensity of tumors and organs by measuring the Cy3 fluorescence signal (B), n = 3. | ||
4. Conclusion
In this research, a non-viral carrier (GO–PLL–SDGR) was prepared and used to deliver VEGF-siRNA for cancer therapy. GO–PLL–SDGR had an average hydrodynamic size of 160 nm and a zeta potential of 25.87 ± 0.47 mV. It is worth mentioning that GO–PLL–SDGR could stay stable in water, PBS and DMEM medium. GO–PLL–SDGR could release VEGF-siRNA slowly and last for over 200 hours, which was critical for enhancing the effects of gene silence. In addition, GO–PLL–SDGR could deliver VEGF-siRNA into tumor cells successfully and down-regulate the expression of VEGF effectively in vitro. What's more, GO–PLL–SDGR/VEGF-siRNA was able to inhibit the tumor growth in a S180 xenograft tumor model by specifically targeting to the xenograft tumor and down-regulate the expression of VEGF. Last but equally important was that GO–PLL–SDGR had no significant cytotoxicity, although the biological safety of GO–PLL–SDGR in vivo requires further systematic investigations in order to avoid potential health problems. In short, these results indicated that GO–PLL–SDGR has great application potential in cancer therapy as a tumor targeting siRNA carrier.Acknowledgements
This work was supported by National Natural Science Foundation (81502688), the Basic-clinical Key Research Grant (16JL72, 17JL67) from Capital Medical University, the Importation and Development of High-Caliber Talents Project of Beijing Municipal Institutions (2013–2015), Natural Science Foundation of Capital Medical University (2015ZR14), and China's 55 of postdoctoral scientific research funds (2014M550768). The authors gratefully acknowledge the supports from Beijing area Major Laboratory of Peptide and Small Molecular Drugs, Engineering Research Center of Endogenous Prophylactic of Ministry of Education of China, and Beijing Laboratory of Biomedical Materials.References
- I. M. Verma and M. D. Weitzman, Annu. Rev. Biochem., 2005, 74, 711–738 CrossRef CAS PubMed.
- M. Bazanperegrino, L. W. Seymour and L. Harris, Cancer Gene Ther., 2007, 14, 117–127 CrossRef CAS PubMed.
- T. Takeda, H. Inaba, M. Yamazaki, S. Kyo, T. Miyamoto, S. Suzuki, T. Ehara, T. Kakizawa, M. Hara, L. J. DeGroot and K. Hashizume, J. Clin. Endocrinol. Metab., 2003, 88, 3531–3538 CrossRef CAS PubMed.
- J. H. Li, M. Chia, W. Shi, D. Ngo, C. A. Strathdee, D. Huang, H. Klamut and F. F. Liu, Cancer Res., 2002, 62, 171–178 CAS.
- S. I. Pai, Y. Y. Lin, B. Macaes, A. Meneshian, C. F. Hung and T. C. Wu, Gene Ther., 2006, 13, 464–477 CrossRef CAS PubMed.
- W. M. Pardridge, Expert Opin. Biol. Ther., 2004, 4, 1103–1113 CrossRef CAS PubMed.
- N. J. Caplen, Gene Ther., 2004, 11, 1241–1248 CrossRef CAS PubMed.
- S. M. Elbashir, W. Lendeckel and T. Tuschl, Genes Dev., 2001, 15, 188–200 CrossRef CAS PubMed.
- K. A. Whitehead, R. Langer and D. G. Anderson, Nat. Rev. Drug Discovery, 2009, 8, 129–138 CrossRef CAS PubMed.
- H. Takahashi and M. Shibuya, Clin. Sci., 2005, 109, 227–241 CrossRef CAS PubMed.
- H. Manzoor, M. I. Qadir, K. Abbas and M. Ali, Afr. J. Pharm. Pharmacol., 2014, 8, 917–923 Search PubMed.
- M. Dominska and D. M. Dykxhoorn, J. Cell Sci., 2010, 123, 1183–1189 CrossRef CAS PubMed.
- K. Gao and L. Huang, Mol. Pharm., 2009, 6, 651–658 CrossRef CAS PubMed.
- H. Chen, M. B. Müller, K. J. Gilmore, G. G. Wallace and D. Li, Adv. Mater., 2008, 20, 3557–3561 CrossRef CAS.
- S. Stankovich, D. A. Dikin, G. H. Dommett, K. M. Kohlhaas, E. J. Zimney, E. A. Stach, R. D. Piner, S. T. Nguyen and R. S. Ruoff, Nature, 2006, 442, 282–286 CrossRef CAS PubMed.
- M. J. Allen, V. C. Tung and R. B. Kaner, Chem. Rev., 2010, 110, 132–145 CrossRef CAS PubMed.
- A. K. Geim, Science, 2009, 324, 1530–1534 CrossRef CAS PubMed.
- F. Kim, L. J. Cote and J. Huang, Adv. Mater., 2010, 22, 1954–1958 CrossRef CAS PubMed.
- D. Chen, H. Feng and J. Li, Chem. Rev., 2012, 112, 6027–6053 CrossRef CAS PubMed.
- Y. Zhu, S. Murali, W. Cai, X. Li, J. W. Suk, J. R. Potts and R. S. Ruoff, Adv. Mater., 2010, 22, 3906–3924 CrossRef CAS PubMed.
- D. R. Dreyer, S. Park, C. W. Bielawski and R. S. Ruoff, Chem. Soc. Rev., 2010, 39, 228–240 RSC.
- Z. Liu, J. T. Robinson, X. Sun and H. Dai, J. Am. Chem. Soc., 2008, 130, 10876–10877 CrossRef CAS PubMed.
- H. Wen, C. Dong, H. Dong, A. Shen, W. Xia, X. Cai, Y. Song, X. Li, Y. Li and D. Shi, Small, 2012, 8, 760–769 CrossRef CAS PubMed.
- G. Liu, H. Shen, J. Mao, L. Zhang, Z. Jiang, T. Sun, Q. Lan and Z. Zhang, Transferrin modified graphene oxide for glioma-targeted drug delivery: in vitro and in vivo evaluations, ACS Appl. Mater. Interfaces, 2013, 5, 6909–6914 CAS.
- Z. Xu, S. Zhu, M. Wang, Y. Li, P. Shi and X. Huang, ACS Appl. Mater. Interfaces, 2014, 7, 1355–1363 Search PubMed.
- H. Xu, M. Fan, A. M. Elhissi, Z. Zhang, K. W. Wan, W. Ahmed, D. A. Phoenix and X. Sun, Nanomedicine, 2015, 10, 1247–1262 CrossRef CAS PubMed.
- M. Zhang, Y. Cao, Y. Chong, Y. Ma, H. Zhang, Z. Deng, C. Hu and Z. Zhang, ACS Appl. Mater. Interfaces, 2013, 5, 13325–13332 CAS.
- L. Feng, S. Zhang and Z. Liu, Nanoscale, 2011, 3, 1252–1257 RSC.
- L. Feng, X. Yang, X. Shi, X. Tan, R. Peng, J. Wang and Z. Liu, Small, 2013, 9, 1989–1997 CrossRef CAS PubMed.
- H. Kim, R. Namgung, K. Singha, I. K. Oh and W. J. Kim, Bioconjugate Chem., 2011, 22, 2558–2567 CrossRef CAS PubMed.
- C. Wang, X. Wang, T. Lu, F. Liu, B. Guo, N. Wen, Y. Du, H. Lin, J. Tang and L. Zhang, RSC Adv., 2016, 6, 22461–22468 RSC.
- H. Bao, Y. Pan, Y. Ping, N. G. Sahoo, T. Wu, L. Li, J. Li and L. H. Gan, Small, 2011, 7, 1569–1578 CrossRef CAS PubMed.
- F. Wang, B. Zhang, L. Zhou, Y. Shi, Z. Li, Y. Xia and J. Tian, ACS Appl. Mater. Interfaces, 2016, 8, 9014–9021 CAS.
- Y. P. Huang, C. M. Hung, Y. C. Hsu, C. Y. Zhong, W. R. Wang, C. C. Chang and M. Lee, Nanoscale Res. Lett., 2016, 11, 1–8 CrossRef CAS PubMed.
- R. Imani, S. H. Emami and S. Faghihi, Phys. Chem. Chem. Phys., 2015, 17, 6328–6339 RSC.
- P. Liu, L. Qin, Q. Wang, Y. Sun, M. Zhu, M. Shen and Y. Duan, Biomaterials, 2012, 33, 6739–6747 CrossRef CAS PubMed.
- Y. Guo, Y. Ma, L. Xu, J. Li and W. Yang, J. Phys. Chem. C, 2007, 111, 9172–9176 CAS.
- D. Ma, Q. M. Lin, L. M. Zhang, Y. Y. Liang and W. Xue, Biomaterials, 2014, 35, 4357–4367 CrossRef CAS PubMed.
- C. Wu, Q. He, A. Zhu, D. Li, M. Xu, H. Yang and Y. Liu, ACS Appl. Mater. Interfaces, 2014, 6, 21615–21623 CAS.
- Z. Wu, S. Zhan, W. Fan, X. Ding, X. Wu, W. Zhang, Y. Fu, Y. Huang, R. Chen, M. Li, N. Xu, Y. Zheng and B. Ding, Nanoscale Res. Lett., 2016, 11, 1–13 CrossRef PubMed.
- P. Kos, A. Herrmann, F. M. Mickler, D. He, S. Morys and E. Wagner, Nanoscale, 2015, 7, 5350–5362 RSC.
- L. Ren, S. Chen, H. Li, Z. Zhang, C. Ye and M. Liu, Nanoscale, 2015, 7, 12843–12850 RSC.
- C. Cui, Y. Wang, W. Zhao, K. Yang, X. Jiang, S. Li, M. Zhao, Y. Song and S. Peng, J. Mater. Chem. B, 2015, 3, 9260–9268 RSC.
- Y. Bi, Y. Zhang, C. Cui, L. Ren and X. Jiang, Int. J. Nanomed., 2016, 11, 5771–5787 CrossRef PubMed.
- C. Wu, Q. He, A. Zhu, D. Li, M. Xu, H. Yang and Y. Liu, ACS Appl. Mater. Interfaces, 2014, 6, 21615–21623 CAS.
- C. Shan, H. Yang, D. Han, Q. Zhang, A. Ivaska and L. Niu, Langmuir, 2009, 25, 12030–12033 CrossRef CAS PubMed.
- J. Sun, J. Chao, J. Huang, M. Yin, H. Zhang, C. Peng, Z. Zhong and N. Chen, ACS Appl. Mater. Interfaces, 2014, 6, 7926–7932 CAS.
- A. Elbakry, A. Zaky, R. Liebl, R. Rachel, A. Goepferich and M. Breunig, Nano Lett., 2009, 9, 2059–2064 CrossRef CAS PubMed.
- Y. Xie, H. Qiao, Z. Su, M. Chen, Q. Ping and M. Sun, Biomaterials, 2014, 35, 7978–7991 CrossRef CAS PubMed.
- M. Abe and Y. Sato, Angiogenesis, 2001, 4, 289–298 CrossRef CAS.
- L. D. Zhang, L. Chen, M. Zhang, H. J. Qi, L. Chen, H. F. Chen, M. K. Zhong, X. J. Shi and Q. Y. Li, Eur. J. Pharmacol., 2015, 769, 167–176 CrossRef CAS PubMed.
- S. Sara, M. D. Solmaz and Y. K. Ahmad, Cell Biol. Int., 2015, 39, 881–890 CrossRef PubMed.
- M. Ding, X. He, Z. Wang, J. Li, H. Tan, H. Deng, Q. Fu and Q. Gu, Biomaterials, 2011, 32, 9515–9524 CrossRef CAS PubMed.
- C. L. Wei, C. Ming and F. E. Yu, Polymer, 2003, 44, 8185–8193 CrossRef CAS.
- H. T. Hu, T. C. Shin, S. Y. Lee, C. C. Chen and J. C. Yang, Polym. Degrad. Stab., 2011, 96, 1522–1529 CrossRef CAS.
- L. Chen, J. M. Mccrate, J. C. Lee and H. Li, Nanotechnology, 2011, 22, 105708–105717 CrossRef PubMed.
- C. Chakraborty, S. Pal, G. P. Doss, Z. H. Wen and C. S. Lin, Front. Biosci., 2013, 18, 1030–1050 CrossRef CAS.
- F. Danhier, B. Le and V. Préat, Mol. Pharm., 2012, 9, 2961–2973 CrossRef CAS PubMed.
- J. Fang, H. Nakamura and H. Maeda, Adv. Drug Delivery Rev., 2011, 63, 136–151 CrossRef CAS PubMed.
Footnote |
| † Electronic supplementary information (ESI) available. See DOI: 10.1039/c7ra00810d |
| This journal is © The Royal Society of Chemistry 2017 |

