 Open Access Article
Creative Commons Attribution 3.0 Unported Licence
Combined experiment and first-principles study of the formation of the Al2O3 layer in alumina-forming austenitic stainless steel
Nan Dongab,
Yongfeng Qiaoab,
Caili Zhangab,
Jian Wangab,
Guangwei Fanc,
Xudong Fangc and
Peide Han *ab
*ab
aKey Laboratory of Interface Science and Engineering in Advanced Materials, Taiyuan University of Technology, Ministry of Education, Taiyuan 030024, China. E-mail: hanpeide@126.com; hanpeide@tyut.edu.cn
bCollege of Materials Science and Engineering, Taiyuan University of Technology, No. 79, Yingze Street, Wanbolin District, Taiyuan 030024, China
cTechnology Center of Taiyuan Iron and Steel Group Company Ltd., Taiyuan 030003, China
First published on 9th March 2017
Abstract
A combination of experiment and first-principles research on the formation of the Al2O3 layer in alumina-forming austenitic stainless steel is presented. The results show that the oxide layer has a multilayer structure with an outer oxidized Cr2O3 and an inner Al2O3. Further, theoretical simulation using the first principles method is applied to research the formation process of the Al2O3 layer in the Fe/Cr2O3 interface as well as the impact of four alloying elements (Cr, Ni, Mn, and Si) on the formation of Al2O3. Results indicate that the Al atom originating from the Fe-based matrix prefers to diffuse into the Cr2O3 slab, thereby resulting in the formation of the Fe/Al2O3/Cr2O3 construction, which agrees with the experimental behaviour. Moreover, the introduction of Cr, Ni, Mn, and Si can slow down the diffusion of Al and result in a slower growth rate of Al2O3. The effects of Cr–Y (Ni, Mn, and Si) co-doping are more significant than those of X (Cr, Ni, Mn, and Si) single doping. Furthermore, Si can improve the adhesion of the Fe/Al2O3/Cr2O3 interface, thus can improve the adhesion of the oxide scales.
1. Introduction
Austenitic heat-resistant stainless steels are primarily utilized as structural materials at high temperatures in the 600–900 °C range, such as aircraft engines, industrial gas turbines, diesel engines, and other steam pipes. Their extensive use is owing to their low cost, excellent oxidation stability and satisfactory high-temperature creep property.1 The excellent oxidation stability of the stainless steel is closely related to the formation of the thermodynamically stable oxide layer, restraining the diffusion of the metal atoms from the matrix and slowing the oxidation rate.2–4 As the common oxide layers, the Cr2O3-based protective scale can prevent stainless steels from oxidizing in high-temperature applications. However, such scale will be destroyed under water-steam environment when the service temperature is higher than 650 °C because of the formation of volatile Crx(OH)y species, thus losing its protective role and causing the failure of the stainless steels.5 Moreover, the adhesive strength of the matrix-oxide scale interface will be decreased and the oxide scales will eventually spall under the longtime thermal cycling applications.6–8 Because of this phenomenon, the matrix metal surface may expose to air and led to a rapid oxidation and a shorter service life.In high-temperature extreme environment applications, Al2O3-based protective scales play the more effective role in protection against oxidation comparing with Cr2O3-based scales owing to the lower growth rate, satisfactory more stable thermodynamic properties, and significantly more excellent resistance towards water vapor. Brady and Yamamoto et al.9 have successfully developed a new austenitic stainless steel with excellent high-temperature oxidation resistance which can be used in water-steam environments owing to the formation of a dense and protective Al2O3 oxide scale. Subsequently, numerous alumina-forming austenitic (AFA) stainless steels have been developed to improve creep property and enhance oxidation performance.10–16 Recently, many studies have been carried out to clarify the structure and the formation process of the protective oxide layer of AFA stainless steels. The results show that the key challenge for AFA stainless steels is to maintain a single-phase austenitic matrix phase and to form the continuous protective Al2O3 scale. Additions of Cr assist protective alumina formation at lower levels of Al by the “third element effect”.17 Ni as a face-centered cubic (fcc) stabilizer significantly improves the oxidation resistance of AFA stainless steels, but changes the amount of the NiAl precipitated phases, further alters the Al level in the matrix. Thus, the equilibrium concentrations of Al, Cr, and Ni are important to obtain the single austenitic matrix and to form the continuous protective Al2O3 scale.14,15,18–21 Moreover, Si has been found to be a significant alloying atom to enhance the anti-oxidation and the mechanical properties of the alloys because it promotes the formation of the Cr2O3 scale. The AFA stainless steel (Fe–25Ni–18Cr–3Al) shows that the addition of the right quantity of Si can improve the oxidation resistance at 800 °C in water-steam environment.22
Nevertheless, exploring the formation mechanism of the oxide layer of AFA stainless steels only using experimental method is very limited. The knowledge on how Cr, Ni, Mn, and Si, single or common, affect the formation of Al2O3 is lacking and has been in dispute; thus, more detailed analyses at the atomic-scales are still required to understand the formation process of Al2O3 of AFA stainless steels. In this paper, we design a new AFA stainless steel (22Cr–25Ni–2.75Cu–0.45Nb–1.5Al). The purpose of this paper is to understand the formation mechanism of the oxide layer of this new AFA stainless steel. The surface oxide layer structures are examined using scanning electron microscopy (SEM), energy dispersive spectroscopy (EDS), X-ray diffraction (XRD), electron probe micro-analyzer (EPMA) and glow discharge spectrometer (GDS). Subsequently, theoretical simulation using the first principle method is applied to research the formation process of the Al2O3 layer in Fe/Cr2O3 interface structure by analyzing the diffusion of Al atom through atomic structures and electronic properties. Lastly, we examine the single and common effects of alloying additives (Cr, Ni, Mn, and Si) on the formation of the Al2O3.
2. Experimental details and calculation methods
The studied steel is 22Cr–25Ni–2.75Cu–0.45Nb–1.5Al, a new AFA stainless steel with higher Cr and Ni contents and named as 1.5Al steel. The specimens for an oxidation test with a dimension of 10 mm × 10 mm × 3 mm were ground by SiC paper to 2000 grit, and exposed in air at 800 °C for 48 h and 120 h; the samples were then air-cooled after oxidation. The surface morphology of the specimen after oxidation was analysed using SEM, and the content of alloying element was examined using EDS. The constituent phases of oxidation products were identified using XRD, the morphology of the cross-sections and element distributions were examined using EPMA and the elemental distributions near the matrix-oxide layer interfaces of different oxidation times were examined using GDS.Atomistic calculations were conducted using first-principles method through the CASTEP code within the local density approximation (LDA).23,24 A plane-wave cut-off kinetic energy was taken as 340 eV. During geometry optimization, the Brillouin zone sampling was carried out with a 4 × 4 × 1 Monkhorst–Pack k-point grid.25 To obtain the correct calculation results, we optimized the coordinates of all atoms in the slab and the lattice parameters a, b, c, α, β and γ of the supercells. Full relaxations were carried out until structures converging: total energies less than 1.0 × 10⁻⁵ eV per atom, stress components less than 0.03 GPa, forces less than 0.3 eV nm−1, and displacements less than 1 × 10⁻⁴ nm. To validate the accuracy of the current theoretical scheme, the crystal lattice constants of the fcc-Fe were calculated to be a = b = c = 3.428 Å, which is in good agreement with the calculated value of 3.430 Å (ref. 26) and the experimental value of 3.647 Å.27 For bulk Cr2O3, we obtain a = b = 4.850 Å and c = 13.929 Å. These values are close to the calculated value of a = b = 5.080 Å and c = 13.840 Å,28 which were obtained by the GGA functional of Perdew and Wang, and the experimental value of a = b = 4.951 Å and c = 13.566 Å.29 The good agreement in the crystal lattice constants thereby validates the application of the methodology to study the interfacial adhesion.
3. Experimental results
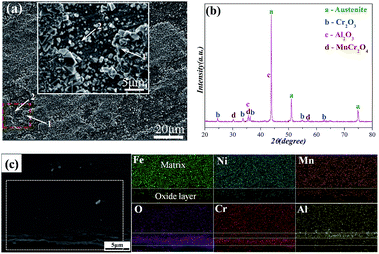
Fig. 1a shows the SEM image of the oxidized surface morphology of the specimen after oxidation at 800 °C for 120 h. The oxide layer is comprised of two different typical microstructures composed of the coarse granular oxides (marked 1) and the finer oxides (marked 2). Selected-area EDS analysis demonstrates that the coarse granular oxides are rich in Cr and Mn, and the finer oxides are mainly the Al2O3 type scale, as shown in Table 1. The corresponding XRD result of the surface of the oxidized sample is displayed in Fig. 1b, the oxide scale is comprised of Cr2O3, Al2O3, and MnCr2O4, and the diffraction peaks corresponding to the Cr2O3 and Al2O3 are much weaker than that of the austenitic matrix phase. To investigate the oxide layer structure more precisely, Fig. 1c shows the profile of the hierarchical structure and the EPMA element maps along the cross-sections of the specimen. A distinct boundary between the matrix and oxide layer can be observed, and two distinct regions of the oxide layer can also be observed from the EPMA element maps image: an inner layer is rich in Al and an outer oxide layer is rich in Cr, the results show that the oxide layer has the multilayer structure of an external Cr2O3 and internal Al2O3. These results are in good agreement with the EDS and XRD analysis.| EDS point | Chemical composition (at%) | |||||
|---|---|---|---|---|---|---|
| Fe | Ni | Mn | Cr | Al | O | |
| 1 | 5.1 | 5.7 | 9.0 | 22.2 | 0.3 | 57.7 |
| 2 | 5.3 | 2.3 | 3.6 | 12.6 | 25.4 | 50.8 |
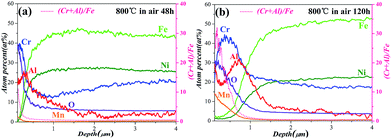
To examine the formation of Al2O3 layer during the oxidation process more precisely, Fig. 2a and b show the elemental distributions near the matrix-oxide layer interface after oxidation at 800 °C for 48 h and 120 h based on the GDS analysis. For the specimen of 1.5Al steel after oxidation at 800 °C for 48 h, the oxide layer is consisted of Al, Cr, O, Ni, Mn, and Fe. The Cr peak is observed at the surface, in which a Cr2O3 type scale may be formed on the surface. Further, an Al peak is observed at the matrix-Cr2O3 interface, so an external scale of Cr2O3 type scale with internal oxides of Al2O3 is developed for the 1.5Al steel. Compared with the oxide layer of the austenitic heat-resistant stainless steels which have no Al,30 the multilayer structure shows that the addition of Al can change the distribution of Cr and change the structure of the oxide layer. With increasing the oxidation time to 120 h, the oxide layer also has the multilayer structure with an outer oxidized Cr2O3 and an inner Al2O3. While the Cr and Al peaks intensities are much higher than those of the specimen for 48 h, and the peaks widths are much larger than those of 48 h, showing that the thickness of the denser oxide layer is larger than that of 48 h. The Cr and Al distribution results indicate that during the oxidation process, Cr and Al tend to diffuse from the matrix to the surface to form the multilayer structure, which acts as barriers to restrain oxygen inward diffusion and metal cations outward diffusion. In general, the Cr content of the thermally grown oxide layer is always considered as the major factor that affect oxidation resistance. While the porous, Fe-rich oxide structure does not show good oxidation resistance. Thus the Cr/Fe ratio of the oxide layer can be considered as a factor to measure the oxidation resistance:31 the larger value of Cr/Fe ratio, the much excellent oxidation resistance. In order to examine the oxidation resistance completely, the values of (Cr + Al)/Fe ratio for 48 h and 120 h are also shown in Fig. 2. For the specimen oxidized after 120 h, the protection provided by the oxide layer is excellent since the (Cr + Al)/Fe ratio is larger than that of the specimen for 48 h. Thus exhibit more excellent oxidation resistance. Our experimentally observed behaviours are in agreement with others' results, which show the multilayer structure of an external Cr2O3 and internal Al2O3.9,10,14,32
4. Calculation results
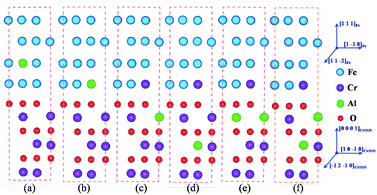
The interface structure of the Fe/Cr2O3 in this paper is almost the same as those of our earlier works.33–35 In order to explain the formation of Al2O3 scale and to verify the experimental results, the diffusion behaviour of Al atom from the Fe matrix to Cr2O3 bulk is examined by calculating the relative energies of different Al sites in the Fe/Cr2O3 model as shown in Fig. 3. At first, an Al atom occupied the Fe-substitutional site in Fe matrix (Model a); secondly, the Al atom moved to the matrix-oxide layer interface by replacing a Fe atom located at the matrix side (Model b); then the Al atom moved to the Cr2O3 bulk by replacing a Cr atom near the interface (Model c), meanwhile, the replaced Cr atom is located at the matrix side to ensure that the atomic numbers are the same as Model a and b and the relative energies of different models are comparable; finally, the Al atom moved into the Cr2O3 bulk far away from the interface (Model d). In order to examine the stable site with two atoms in the Cr2O3 bulk, another Al atom was introduced to the structure on the base of Model c by replacing a Cr atom near the interface (Model e) and far away from the interface (Model f). Subsequently, we examine the potential impact of different alloying additives Cr, Ni, Mn, and Si on the diffusion of Al and the formation of Al2O3 in the Fe/Cr2O3 interface, each additive replaces the Fe atom near the matrix-oxide layer interface.4.1 Formation of Al2O3 in Fe/Cr2O3 interface
To investigate the formation of the Al2O3, the diffusion behaviour of Al atom in the Fe/Cr2O3 interface structure is first discussed and the heats of segregation (ΔEseg) of different models with Al atom at different sites are calculated. ΔEseg is defined as:36,37| ΔEseg = EMf − Ebulkf, | (1) |
| EMf = EM–Alt − Ecleant + EFeatom + mECratom − nEAlatom, | (2) |
To examine the structure stabilities and interfacial adhesive properties of different models, the binding energies (Eb) and the works of adhesion (Wad)38–40 are further calculated based on the following formulas:
 | (3) |
 | (4) |
 is the total energy of the Fe/Cr2O3 interface structure; EFet and
  are the energies of the isolated Fe and Cr2O3 slabs, and A is the total interfacial area of the unit cell.
The calculated values of Etotal, ΔEseg, Eb, and Wad of six configurations are shown in Table 2. Through the comparison of the Etotal and ΔEseg, it is surmised that with only one Al atom in the structure, replacing a Cr atom in Cr2O3 bulk close to the interface (Model c) is predicted to be the most stable Al site with Etotal of −28![[thin space (1/6-em)]](https://www.rsc.org/images/entities/char_2009.gif) 247.159 eV and ΔEseg of −1.149 eV. On the contrary, Model a is found to be the most unstable site with Etotal of −28
247.159 eV and ΔEseg of −1.149 eV. On the contrary, Model a is found to be the most unstable site with Etotal of −28![[thin space (1/6-em)]](https://www.rsc.org/images/entities/char_2009.gif) 246.010 eV and ΔEseg of 0 eV. Thus, in terms of energies, we note that the Al atom tends to diffuse from the site in Fe bulk (Model a) to the site in Cr2O3 bulk near the interface (Model c), and Model b is the intermediate site. As Al atoms gradually diffuse to the Cr2O3 bulk, when two Al atoms are in the oxide slab, the most energetically stable diffusion site is Model e, with Etotal of −25
246.010 eV and ΔEseg of 0 eV. Thus, in terms of energies, we note that the Al atom tends to diffuse from the site in Fe bulk (Model a) to the site in Cr2O3 bulk near the interface (Model c), and Model b is the intermediate site. As Al atoms gradually diffuse to the Cr2O3 bulk, when two Al atoms are in the oxide slab, the most energetically stable diffusion site is Model e, with Etotal of −25![[thin space (1/6-em)]](https://www.rsc.org/images/entities/char_2009.gif) 841.897 eV and ΔEseg of −2.762 eV, but not Model f. As we know, Al2O3 and Cr2O3 have the same crystal structure, so the segregation of Al atoms near the Fe/Cr2O3 interface can result in the formation of Al2O3, facilitating the process of Fe/Al2O3/Cr2O3 construction. Moreover, Model e represents exactly the structure of the Fe/Al2O3/Cr2O3 multilayer oxide. Our calculations provide a strong evidence for our experimental results, and are also supported by the previous experimental investigations on the oxidation of AFA stainless steels.9,10,14,32
841.897 eV and ΔEseg of −2.762 eV, but not Model f. As we know, Al2O3 and Cr2O3 have the same crystal structure, so the segregation of Al atoms near the Fe/Cr2O3 interface can result in the formation of Al2O3, facilitating the process of Fe/Al2O3/Cr2O3 construction. Moreover, Model e represents exactly the structure of the Fe/Al2O3/Cr2O3 multilayer oxide. Our calculations provide a strong evidence for our experimental results, and are also supported by the previous experimental investigations on the oxidation of AFA stainless steels.9,10,14,32
| Construction | Etot | ΔEseg | Eb | Wad |
|---|---|---|---|---|
| Model a | −28![[thin space (1/6-em)]](https://www.rsc.org/images/entities/char_2009.gif) 246.010 246.010 |
0 | −7.704 | 7.235 |
| Model b | −28![[thin space (1/6-em)]](https://www.rsc.org/images/entities/char_2009.gif) 247.018 247.018 |
−1.008 | −7.741 | 7.275 |
| Model c | −28![[thin space (1/6-em)]](https://www.rsc.org/images/entities/char_2009.gif) 247.159 247.159 |
−1.149 | −7.758 | 7.512 |
| Model d | −28![[thin space (1/6-em)]](https://www.rsc.org/images/entities/char_2009.gif) 246.931 246.931 |
−0.921 | −7.738 | 7.240 |
| Model e | −25![[thin space (1/6-em)]](https://www.rsc.org/images/entities/char_2009.gif) 841.897 841.897 |
−2.762 | −7.760 | 8.586 |
| Model f | −25![[thin space (1/6-em)]](https://www.rsc.org/images/entities/char_2009.gif) 840.769 840.769 |
−1.634 | −7.718 | 7.478 |
To reveal the structure stabilities and interfacial properties of different models, the Eb and Wad are also examined. The Table 2 shows that as the Al atom diffuses from the Fe slab (Model a) to the Cr-substitutional site (Model c); the absolute values of Eb are gradually increased, which indicates that the structures become more stable and the interactions of the atoms become stronger. As Al atoms gradually diffuse to the Cr2O3 bulk and form the Fe/Al2O3/Cr2O3 construction (Model e), the structure is most stable with the Eb of −7.760 eV per atom. Furthermore, Wad obtained from six different configurations show that, as Al atom diffuses, the values of Wad are increased and then the mechanical properties of the interfaces are enhanced. Therefore, the Eb and Wad results indicate that the Fe/Al2O3/Cr2O3 construction (Model e) has the most stable structure and the best interfacial adhesion.
The adhesion of an interface is tightly related to the atomic bonding and the layer distances near the interface. Fig. 4 displays the layer distances and shows that as the Al atom diffuses from Model a to Model c, the layer distance of d2 changes negligibly, whereas d1 and d3 change materially. In Model c, the interactions of the Fe atoms in the Fe slab and the interactions between O and Cr atoms in Cr2O3 bulk are all strong, which is corresponding to a more stable structure. As Al atoms gradually diffuse to the Cr2O3 bulk and form the Fe/Al2O3/Cr2O3 construction (Model e), the layer distance of d2 is the smallest, indicating that the adhesion of the interface is the strongest. Simultaneously, d1 and d3 are relatively small comparing with those of other models, indicating that the interactions of atoms in the Fe slab and in the Cr2O3 bulk are also relatively strong. These results show that Model e has the strongest interface interaction as well as the most stable structure.
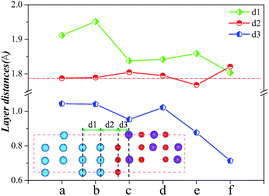 | ||
| Fig. 4 Layer distances near the interfaces of different models of Al in Fe/Cr2O3 interface structure. | ||
To validate the aforementioned results, we calculate the atomic transfer charges of the Fe, Cr, Al, and O atoms using the Mulliken population analysis.41 As shown in Table 3, when an Al atom is in the Fe slab (Model a), the transfer charge of Al atom is −0.05. And the values of the interfacial Fe atoms are 0.00, 0.02 and 0.01, respectively, indicating the existence of metallic bonding between Al and Fe atoms. As the Al atom gradually diffuses, when it replaces the Fe atom near the interface (Model b), the value of Al atom is 0.72. Simultaneously, the values of the two interfacial Fe atoms are all −0.22 and those of the three interfacial O atoms are −0.42, −0.42, and −0.60, respectively. This result indicates that the interactions between the interfacial Fe (Al) atoms and O atoms are enhanced. When the Al atom replaces the Cr atom near the interface (Model c), the value of Al atom is 1.47. By contrast, the values of the three interfacial O atoms are −0.58, −0.58, and −0.59, respectively. The values of the three O atoms in the Cr2O3 bulk next to the Al atoms are −0.60, −0.61, and −0.59, respectively. These results indicate that the Al atom generates a strong positive electric field that offers strong attractive power for O atoms. This assumption is proven to be correct by the more negative values of O atoms next to Al. Finally, the interactions of the interfacial atoms are further enhanced in Model c. As more Al atoms diffuse at Cr2O3 bulk forming the continuous Al2O3 layer (Model e), the values of Al atoms are increased to 1.48 and 1.50. Simultaneously, the values of the three interfacial O atoms are −0.80, −0.71, and −0.80, respectively, and those of the three O atoms in the Cr2O3 bulk next to the Al are −0.72, −0.73, and −0.73, respectively. These show that in Model e, Al atoms provide stronger attractive powers for O atoms; the interactions between the interfacial Al atoms and O atoms are the strongest and the structure is the most stable. These results are accordant to those of the above energy analyses and structural analyses.
| Model a | Model b | Model c | Model d | Model e | Model f | ||||||
|---|---|---|---|---|---|---|---|---|---|---|---|
| Atom | Transfer charge (e) | Atom | Transfer charge (e) | Atom | Transfer charge (e) | Atom | Transfer charge (e) | Atom | Transfer charge (e) | Atom | Transfer charge (e) |
| Fe | 0.09 | Fe | 0.13 | Fe | 0.11 | Fe | 0.12 | Fe | 0.11 | Fe | 0.11 |
| Fe | 0.09 | Fe | 0.14 | Fe | 0.12 | Fe | 0.13 | Fe | 0.12 | Fe | 0.11 |
| Al | −0.05 | Fe | 0.13 | Fe | 0.11 | Fe | 0.11 | Fe | 0.12 | Fe | 0.08 |
| Fe | 0.00 | Fe | −0.22 | Fe | 0.09 | Fe | 0.09 | Fe | 0.14 | Fe | 0.11 |
| Fe | 0.02 | Fe | −0.22 | Fe | 0.09 | Fe | 0.09 | Fe | 0.13 | Fe | 0.11 |
| Fe | 0.01 | Al | 0.72 | Cr | −0.08 | Cr | −0.09 | Cr | −0.08 | Cr | −0.04 |
| O | −0.42 | O | −0.42 | O | −0.58 | O | −0.42 | O | −0.71 | O | −0.54 |
| O | −0.42 | O | −0.42 | O | −0.58 | O | −0.42 | O | −0.80 | O | −0.52 |
| O | −0.42 | O | −0.60 | O | −0.59 | O | −0.43 | O | −0.80 | O | −0.54 |
| Cr | 0.71 | Cr | 0.73 | Al | 1.47 | Cr | 0.70 | Al | 1.48 | Cr | 0.77 |
| Cr | 0.80 | Cr | 0.82 | Cr | 0.83 | Cr | 0.76 | Al | 1.50 | Al | 1.54 |
| O | −0.49 | O | −0.48 | O | −0.60 | O | −0.59 | O | −0.72 | O | −0.77 |
| O | −0.48 | O | −0.49 | O | −0.61 | O | −0.60 | O | −0.73 | O | −0.78 |
| O | −0.48 | O | −0.48 | O | −0.59 | O | −0.60 | O | −0.73 | O | −0.78 |
| Cr | 0.69 | Cr | 0.69 | Cr | 0.66 | Cr | 0.73 | Cr | 0.73 | Cr | 0.76 |
| Cr | 0.74 | Cr | 0.74 | Cr | 0.74 | Al | 1.48 | Cr | 0.78 | Al | 1.52 |
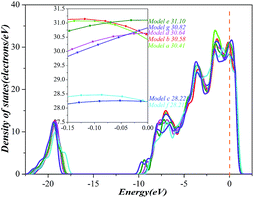
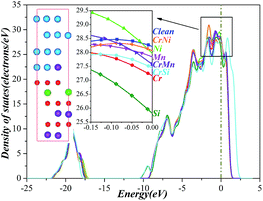
Finally, we investigate the electrochemical stability of different models mentioned above by analysing the density of states (DOS) as shown in Fig. 5. As we know, the electrochemical stability is closely related to the number of electrons at the Fermi level, less electrons implies that the higher electrochemical stability and the more stable structure. DOS analysis indicates that the number of electrons at the Fermi level has significant changes during the diffusion process of Al atom. The numerical values decrease at Model b (28.22 electrons per eV) and Model e (28.21 electrons per eV), but increase at Model c (30.64 electrons per eV), Model d (31.10 electrons per eV), and Model f (30.82 electrons per eV). These results indicate that as Al atoms are at Model b and at Model e, the electron densities are decreased and the electrochemical stabilities are enhanced. Therefore, we may conclude that the model with the highest electrochemical stability is Model e.
4.2 Effects of Cr, Ni, Mn, and Si on the formation of Al2O3
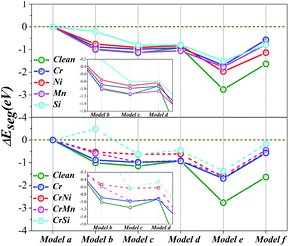
To study the potential impacts of four alloying elements Cr, Ni, Mn, and Si on the formation of Al2O3 in Fe/Cr2O3 interface, we examine the migration behaviour of Al in the X (X = Cr, Ni, Mn, Si) doped and Cr–Y (Y = Ni, Mn, Si) co-doped Fe/Cr2O3 structures. The Al is introduced to different sites in the doped structures, which is shown in Fig. 3. The alloying elements Cr, Ni, Mn, and Si are used to replace the Fe atom near the interface. Then the ΔEseg of Al in different sites of X (X = Cr, Ni, Mn, Si) doped and Cr–Y (Y = Ni, Mn, Si) co-doped Fe/Cr2O3 structures are calculated as shown in Fig. 6. For X (X = Cr, Ni, Mn, Si) doped systems, the ΔEseg indicates that the introduction of X (X = Cr, Ni, Mn, Si) does not change the diffusion behaviour of the Al atom but changes the relative difficulty of the Al diffusion in different degrees. As the X (X = Cr, Ni, Mn, Si) atom is introduced, the absolute values of ΔEseg of all models are decreased materially showing that the driving forces of the diffusion are smaller than that of the clean interface. This result implies that Cr, Ni, Mn, and Si can slow down the diffusion of Al atom and restrain Al from constantly depleting from the alloy matrix, resulting in a slower growth rate of Al2O3. For different alloying elements doped systems, as the Al atom is kept at the same site, the absolute values of ΔEseg approximately hold the following order: clean > Mn-doped > Cr-doped > Ni-doped > Si-doped, which indicates that the growth rate of Al2O3 in the Si-doped systems is the slowest. For Cr–Ni and Cr–Mn co-doped systems, the common effects of Cr–Ni and Cr–Mn on the formation of Al2O3 are almost the same as those of the single element doped systems: Cr–Ni and Cr–Mn co-doped can slow the growth rate of Al2O3. The effects of Cr–Y co-doped are more significant than those of X single doped. The ΔEseg indicates that in Cr–Si co-doped systems, it must overcome the energy barrier to diffuse from the site in the Fe bulk (Model a) to the site in Cr2O3 bulk near the interface (Model c); thus, the growth rate of Al2O3 is the slowest among all different systems. Finally, it can be also noted that Model e is the most energetically stable diffusion site among the constructed structures, showing that the Al atoms concentrate near the Fe/Cr2O3 interface must result in the formation of Fe/Al2O3/Cr2O3 construction.In order to further investigate the impacts of alloying additives on the structure stabilities, interfacial adhesions, and electrochemical properties of the Fe/Al2O3/Cr2O3 constructions, we further carefully perform a thorough investigation of Model e (Fe/Al2O3/Cr2O3) of different alloying elements doped Fe/Cr2O3 interfaces, through the Eb, Wad, interfacial structure, DOS analysis, and Mulliken population analysis.
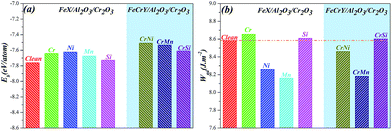
To reveal the impacts of alloying additives on the structure stabilities and interfacial adhesive behaviour of Fe/Al2O3/Cr2O3 construction, the Eb and Wad are also examined in Fig. 7. Fig. 7a shows that as alloying additives are inserted into the systems, the absolute values of Eb are decreased slightly. They are scaled between −7.76 eV per atom and −7.48 eV per atom, which indicate that although the stabilities of the structures are slightly weaker, the structures are also very stable. From Fig. 7b, we note that the Wad of the new doped interfaces change in different degrees in the following order: Cr-doped > Si-doped > Cr–Si co-doped > clean > Cr–Ni co-doped > Ni-doped > Cr–Mn co-doped > Mn-doped. These results indicate that the introduction of Cr, Si and Cr–Si can improve the adhesion of the Fe/Al2O3/Cr2O3 construction further improve the adhesion of the oxide, whereas for other element-doped systems, no significant effects are observed. These results are in good accordance with the experimental behaviour that Si can improve the adhesive strength of surface oxide layers and enhance the oxidation resistance of AFA stainless steels.22
Fig. 4 shows that d2 can reflect the adhesive strength of the interface. We calculate the d2 of the Fe/Al2O3/Cr2O3 constructions for different alloying element doped systems in Fig. 8. The d2 in the Cr–Si co-doped systems is the smallest among all models, showing that the adhesion of the interfaces is the strongest, follow by the Si-doped and Cr-doped systems. These results demonstrate that the introduction of Cr–Si, Si, and Cr to the structure can improve the adhesion of the Fe/Al2O3/Cr2O3 interfaces, which supports the Wad analysis described above.
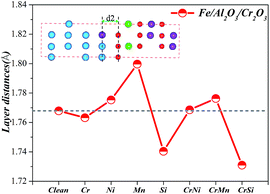 | ||
| Fig. 8 Layer distances near the interface of the (Cr, Ni, Mn, Si)-doped Fe/Al2O3/Cr2O3 constructions. | ||
Then, we examine the impact of the alloying elements (Cr, Ni, Mn, and Si) on the electrochemical stability of Fe/Al2O3/Cr2O3 constructions by analysing the DOS. Fig. 9 shows that the DOS patterns of the Fe/Al2O3/Cr2O3 constructions after doping alloying elements are almost the same as that of the clean interface; thus, as the alloying additives are inserted into the systems, they do not alter the energy levels of the structures. Based on careful research of the electrons at the Fermi level, it can be concluded that as different elements are inserted into the systems, the amounts of the electrons have remarkable changes, and the electrochemical stability is in the following order: Si-doped > Cr-doped > Cr–Si co-doped > Cr–Mn co-doped > Mn-doped > Ni-doped > Cr–Ni co-doped > clean. These results indicate that electrochemical stability is enhanced due to the introduction of the alloying elements, particularly for the Si-doped, Cr-doped, and Cr–Si co-doped systems.
Table 4 lists the atomic transfer charges of the Fe, Cr, Al, and O atoms of the Fe/Al2O3/Cr2O3 constructions for different alloying element doped systems. For the Cr-doped, Ni-doped, Mn-doped, Cr–Ni co-doped, and Cr–Mn co-doped systems, the transfer charges of the interfacial Fe, Cr, Al, and O atoms vary slightly comparing with those of the clean interface, indicating that the effects of the Cr-, Ni-, Mn-, Cr–Ni-, and Cr–Mn-doped on the interactions of the interfacial Fe (Al) atoms and O atoms are not obvious. On the other hand, for Si-doped and Cr–Si co-doped systems, the values of two Al atoms are increased from 1.48, 1.50 to 1.53, 1.53 and 1.52, 1.53, whereas those of Si atoms that replacing Fe atoms are increased to 1.29 and 1.52, respectively. These results indicate that the Al and Si atoms offer the additional attractive powers for O atoms. This assumption is proven to be correct by the more negative values of O atoms neat Al atoms: the values of O next to Al atoms are −1.06, −0.81, −0.73 for Si-doped and −0.75, −0.75, −0.96 for Cr–Si co-doped systems. Therefore, the interactions between the interfacial Al (Si) atoms and O atoms are enhanced. This phenomenon reveals that the Si-doped and Cr–Si co-doped can improve the adhesion of Fe/Al2O3/Cr2O3 interfaces.
| Clean | Cr | Ni | Mn | Si | CrNi | CrMn | CrSi | ||||||||
|---|---|---|---|---|---|---|---|---|---|---|---|---|---|---|---|
| Atom | Transfer charge (e) | Atom | Transfer charge (e) | Atom | Transfer charge (e) | Atom | Transfer charge (e) | Atom | Transfer charge (e) | Atom | Transfer charge (e) | Atom | Transfer charge (e) | Atom | Transfer charge (e) |
| Fe | 0.11 | Fe | 0.10 | Fe | 0.11 | Fe | 0.11 | Fe | 0.03 | Fe | 0.11 | Fe | 0.07 | Fe | 0.12 |
| Fe | 0.12 | Fe | 0.12 | Fe | 0.12 | Fe | 0.12 | Fe | 0.03 | Fe | 0.11 | Fe | 0.08 | Fe | 0.11 |
| Fe | 0.12 | Fe | 0.11 | Fe | 0.12 | Fe | 0.12 | Fe | 0.05 | Fe | 0.12 | Fe | 0.08 | Fe | 0.15 |
| Fe | 0.14 | Cr | 0.01 | Ni | −0.01 | Mn | 0.42 | Si | 1.29 | Cr | 0.09 | Cr | −0.13 | Cr | −0.07 |
| Fe | 0.13 | Fe | 0.28 | Fe | 0.20 | Fe | 0.07 | Fe | −0.15 | Ni | 0.05 | Mn | 0.60 | Si | 1.52 |
| Cr | −0.08 | Cr | 0.01 | Cr | −0.05 | Cr | −0.19 | Cr | −0.49 | Cr | −0.10 | Cr | −0.07 | Cr | −0.07 |
| O | −0.71 | O | −0.73 | O | −0.71 | O | −0.77 | O | −1.06 | O | −0.72 | O | −0.73 | O | −0.75 |
| O | −0.80 | O | −0.82 | O | −0.85 | O | −0.80 | O | −0.81 | O | −0.87 | O | −0.79 | O | −0.96 |
| O | −0.80 | O | −0.73 | O | −0.78 | O | −0.71 | O | −0.73 | O | −0.72 | O | −0.73 | O | −0.75 |
| Al | 1.48 | Al | 1.47 | Al | 1.48 | Al | 1.47 | Al | 1.53 | Al | 1.48 | Al | 1.47 | Al | 1.52 |
| Al | 1.50 | Al | 1.50 | Al | 1.51 | Al | 1.50 | Al | 1.53 | Al | 1.50 | Al | 1.50 | Al | 1.53 |
| O | −0.72 | O | −0.73 | O | −0.72 | O | −0.72 | O | −0.72 | O | −0.72 | O | −0.73 | O | −0.74 |
| O | −0.73 | O | −0.74 | O | −0.72 | O | −0.73 | O | −0.72 | O | −0.73 | O | −0.74 | O | −0.74 |
| O | −0.73 | O | −0.74 | O | −0.72 | O | −0.73 | O | −0.73 | O | −0.73 | O | −0.74 | O | −0.74 |
| Cr | 0.73 | Cr | 0.72 | Cr | 0.74 | Cr | 0.73 | Cr | 0.74 | Cr | 0.73 | Cr | 0.73 | Cr | 0.74 |
| Cr | 0.78 | Cr | 0.78 | Cr | 0.78 | Cr | 0.78 | Cr | 0.78 | Cr | 0.78 | Cr | 0.78 | Cr | 0.78 |
5. Conclusions
In this work, we have systematically determined the formation process of the oxide layer developed on AFA stainless steel (22Cr–25Ni–2.75Cu–0.45Nb–1.5Al) through the experiment combined with first-principle methods. Experimental results show that the oxide layer has an outer oxidized Cr2O3 and an inner Al2O3 multilayer structure. Density functional theory is applied to research the formation of the Al2O3 in Fe/Cr2O3 interface as well as the impacts of alloying elements (Cr, Ni, Mn, Si) on the formation of Al2O3. During oxidation, Al atoms originating from the Fe-based matrix prefer to diffuse into Cr2O3 slab through the interface, resulting in the formation of the Fe/Al2O3/Cr2O3 construction, which is supported by the experimental behaviour. The introductions of Cr, Ni, Mn, and Si to the systems can slow down the diffusion of Al and result in a slower growth rate of Al2O3. The effects of Cr–Y (Ni, Mn, and Si) co-doped are more significant than those of X (Cr, Ni, Mn, and Si) single doped. Furthermore, the Si can improve the adhesion of oxide scales. Our results provide a certain implication for a better understanding of the oxidation of the AFA stainless steels.Acknowledgements
This project was supported by the National Natural Science Foundation of China (Grant No. 51371123), the National Natural Science Foundation of Shanxi province of China (Grant No. 2014011002, 201601D202033, 201601D202034), the Research Fund for the Doctoral Program of Higher Education of China (Grant No. 2013140211003), and the China Scholarship Council (CSC).References
- G. Chai, M. Boström, M. Olaison and U. Forsberg, Procedia Eng., 2013, 55, 232–239 CrossRef CAS.
- H. Hindam and D. Whittle, Oxid. Met., 1982, 18, 245–284 CrossRef CAS.
- F. Stott, G. Wood and J. Stringer, Oxid. Met., 1995, 44, 113–145 CrossRef CAS.
- P. Saltykov, O. Fabrichnaya, J. Golczewski and F. Aldinger, J. Alloys Compd., 2004, 381, 99–113 CrossRef CAS.
- T. Dudziak, M. Łukaszewicz, N. Simms and J. Nicholls, Corros. Eng., Sci. Technol., 2015, 50, 272–282 CrossRef CAS.
- A. Rabiei and A. Evans, Acta Mater., 2000, 48, 3963–3976 CrossRef CAS.
- A. Ul-Hamid, A. Mohammed, S. Al-Jaroudi, H. Tawancy and N. Abbas, Mater. Charact., 2007, 58, 13–23 CrossRef CAS.
- K. Jung, C. S. Kim, F. S. Pettit and G. H. Meier, J. Power Sources, 2011, 196, 4686–4694 CrossRef CAS.
- Y. Yamamoto, M. P. Brady, Z. P. Lu, P. J. Maziasz, C. T. Liu, B. A. Pint, K. L. More, H. Meyer and E. A. Payzant, Science, 2007, 316, 433–436 CrossRef CAS PubMed.
- M. P. Brady, Y. Yamamoto, M. L. Santella and B. A. Pint, Scr. Mater., 2007, 57, 1117–1120 CrossRef CAS.
- M. P. Brady, Y. Yamamoto, M. L. Santella and L. R. Walker, Oxid. Met., 2009, 72, 311–333 CrossRef CAS.
- M. P. Brady, K. A. Unocic, M. J. Lance, M. L. Santella, Y. Yamamoto and L. R. Walker, Oxid. Met., 2011, 75, 337–357 CrossRef CAS.
- X. Xu, X. Zhang, G. Chen and Z. Lu, Mater. Lett., 2011, 65, 3285–3288 CrossRef CAS.
- M. P. Brady, J. Magee, Y. Yamamoto, D. Helmick and L. Wang, Mater. Sci. Eng., 2014, 590, 101–115 CrossRef CAS.
- N. Yanar, B. Lutz, L. Garcia-Fresnillo, M. Brady and G. H. Meier, Oxid. Met., 2015, 84, 541–565 CrossRef CAS.
- D. Zhou, W. Zhao, H. Mao, Y. Hu, X. Xu, X. Sun and Z. Lu, Mater. Sci. Eng., 2015, 622, 91–100 CrossRef CAS.
- C. Wagner, Corros. Sci., 1965, 5, 751–764 CrossRef CAS.
- R. Peraldi and B. Pint, Oxid. Met., 2004, 61, 463–483 CrossRef CAS.
- Y.-S. Choi, J.-J. Shim and J.-G. Kim, J. Alloys Compd., 2005, 391, 162–169 CrossRef CAS.
- Y. Sun, Y. Lv, Y. Zhang, J. Zhao and Y. Wu, Mater. Sci. Technol., 2013, 29, 511–516 CrossRef CAS.
- M. P. Brady, Y. Yamamoto, B. A. Pint, M. L. Santella, P. J. Maziasz and L. R. Walker, Mater. Sci. Forum, 2008, 595, 725–732 CrossRef.
- X. Xu, X. Zhang, X. Sun and Z. Lu, Corros. Sci., 2012, 65, 317–321 CrossRef CAS.
- J. P. Perdew and A. Zunger, Phys. Rev. B: Condens. Matter Mater. Phys., 1981, 23, 5048–5079 CrossRef CAS.
- W. Liu, J. Li, W. Zheng and Q. Jiang, Phys. Rev. B: Condens. Matter Mater. Phys., 2006, 73, 205421 CrossRef.
- H. J. Monkhorst and J. D. Pack, Phys. Rev. B: Solid State, 1976, 13, 5188–5192 CrossRef.
- J. HáGlund, G. A. Fernández, G. Grimvall and M. KöRling, Phys. Rev. B: Condens. Matter Mater. Phys., 1993, 48, 11685–11691 CrossRef.
- Z. S. Basinski and A. L. Sutton, Proc. R. Soc. A, 1955, 229, 459–467 CrossRef CAS.
- M. Xiao, M. Zhao, X. Lang, Y. Zhu and Q. Jiang, Chem. Phys. Lett., 2012, 542, 85–88 CrossRef CAS.
- L. W. Finger and R. M. Hazen, J. Appl. Phys., 1980, 51, 5362–5367 CrossRef CAS.
- J. Fu, N. Li, Q. Zhou and P. Guo, Oxid. Met., 2015, 83, 317–333 CrossRef CAS.
- S. K. Yen and Y. C. Tsai, J. Electrochem. Soc., 1996, 143, 2493–2497 CrossRef CAS.
- Y. Qiao, J. Wang, Z. Zhang, X. Quan, J. Liu, X. Fang and P. Han, Oxid. Met., 2017 DOI:10.1007/s11085-017-9738-0.
- H. Liu, Y. Li, C. Zhang, N. Dong, H. Li, H. Dong and P. Han, Comput. Mater. Sci., 2013, 78, 116–122 CrossRef.
- H. Liu, Y. Li, C. Zhang, N. Dong, H. Li, H. Dong and P. Han, Comput. Mater. Sci., 2014, 82, 367–371 CrossRef CAS.
- N. Dong, C. Zhang, H. Liu, G. Fan, X. Fang and P. Han, Comput. Mater. Sci., 2015, 109, 293–299 CrossRef CAS.
- M. P. J. Punkkinen, K. Kokko, M. Ropo, S. Lu, L. Delczeg, H. Zhang, E. Delczeg-Czirjak, B. Johansson and L. Vitos, J. Phys.: Condens. Matter, 2013, 25, 495501 CrossRef CAS PubMed.
- A. Kiejna and E. Wachowicz, Phys. Rev. B: Condens. Matter Mater. Phys., 2008, 78, 113403 CrossRef.
- S. Y. Liu, J. X. Shang, F. H. Wang and Y. Zhang, J. Phys.: Condens. Matter, 2009, 21, 225005 CrossRef PubMed.
- M. Finnis, J. Phys.: Condens. Matter, 1996, 8, 5811 CrossRef CAS.
- V. I. Razumovskiy, A. Y. Lozovoi and I. M. Razumovskii, Acta Mater., 2015, 82, 369–377 CrossRef CAS.
- M. Segall, R. Shah, C. Pickard and M. Payne, Phys. Rev. B: Condens. Matter Mater. Phys., 1996, 54, 16317–16320 CrossRef CAS.
| This journal is © The Royal Society of Chemistry 2017 |

