 Open Access Article
Creative Commons Attribution 3.0 Unported Licence
Facile synthesis of multifunctional Fe3O4@SiO2@Au magneto-plasmonic nanoparticles for MR/CT dual imaging and photothermal therapy
Xuemei Hou†
ab,
Xuandong Wang† *ab,
Rong Liuab,
Huicong Zhangab,
Xiaolong Liu*c and
Yun Zhang*ab
aKey Laboratory of Design and Assembly of Functional Nanostructures, Fujian Institute of Research on the Structure of Matter, Chinese Academy of Sciences, Fuzhou 350002, P. R. China. E-mail: wangxd@fjirsm.ac.cn; zhangy@fjirsm.ac.cn
bDepartment of Translational Medicine, Xiamen Institute of Rare Earth Materials, Chinese Academy of Sciences, Xiamen 361024, P. R. China
cThe United Innovation of Mengchao Hepatobiliary Technology Key Laboratory of Fujian Province, Mengchao Hepatobiliary Hospital of Fujian Medical University, Fuzhou 350025, P. R. China. E-mail: xiaoloong.liu@gmail.com
First published on 29th March 2017
Abstract
Magneto-plasmonic nanoparticles have exhibited great potential in cancer diagnosis and therapy because of their excellent magnetic and optically activable plasmonic properties. However, it is still a great challenge to combine these two components in one single-nanoparticle. In this work, we developed a facile method to synthesize monodispersed and uniform theranostic agents of Fe3O4@SiO2@GNSs–PEG (PMGNSs) nanoparticles. The as-synthesized PMGNSs composed of a superparamagnetic Fe3O4 inner core, silica as the midlayer and coated with gold nanoshells at the outside, with uniform size distribution of less than 100 nm. It has been demonstrated to be with excellent magnetic resonance (MR) and computed tomography (CT) imaging contrast abilities at different concentrations. Meanwhile, the as-synthesized PMGNSs exhibited high stability with no significant change of photothermal performance after five laser ON/OFF cycles, and high photothermal conversion ability with temperature increase of 40 °C under 808 nm laser irradiation at 2 W cm−2 for 10 min at the concentration of 160 μg ml−1. Furthermore, in vitro photothermal therapy ability has also been demonstrated on HePG2 cancer cells.
Introduction
Because of their unique physiochemical properties, nanomaterials have been widely used in biomedical applications, especially in various imaging techniques including ultrasound imaging (USI),1 magnetic resonance imaging (MRI),2,3 computed tomography (CT),4,5 positron emission tomography (PET),6 fluorescence imaging (FLI)7 and photoacoustic tomography (PAT).8 Among the above imaging techniques, CT has been used as one of the most commonest imaging modality with high resolution and detailed 3D visual structure of tissues of interest.9 However, every imaging technology possesses its own inherent advantages and limitations. The main weakness for CT imaging is low sensitivity for low density soft tissues.10 Integrating two or more imaging modalities on one nanostructure could provide more comprehensive information for better diagnosis and therapy. MRI is another useful imaging tool for whole-body diffusion-weighted imaging in disease diagnosis, especially in soft tissues with excellent spatial resolution, offering high sensitivity information.11 Combining MR and CT imaging could compensate the limitations for each other, and the dual contrast agent could be simultaneously used in the precision diagnosis of various diseases.In recent years, Fe3O4/Au nanocomposites have been demonstrated to be important MRI/CT theranostic agents due to their inherent advantages.12,13 In such nanocomposites, the magnetic component is often used as a T2-weighted MRI contrast for cancer diagnosis and therapy because of its contrast enhancement and high relaxivity properties. Magnetic nanoparticles (MNPs) also could be easily manipulated by an external magnetic field for targeted drug delivery and for magnetic hyperthermia therapy.14,15 However, there are still some weaknesses of MNPs which could be rapidly cleared by macrophages preventing their trans-endothelia passage and tissue penetration.16 As the component of the Fe3O4/Au nanocomposites, gold nanoparticles (GNPs) have high atomic number for high X-ray absorption, making them to be helpful in enhancing computed tomography (CT) imaging.17 GNPs have been widely used in biomedical applications because of their biocompatibility, high stability and could be easily functionalized with the biomarkers for targeting tumor cells.18,19 In addition, GNPs with the localized surface plasmon resonance (LSPR)20 have been demonstrated great potential applications in near-infrared (NIR) laser-induced photothermal therapy (PTT), which is a minimally therapy, depending on absorbing the NIR light and converting the optical energy into heat to kill the cancer cells by thermal ablation.21 For example, gold nanocages,22,23 gold nanorods,24,25 gold nanostars26,27 and gold nanoshells28,29 have been reported with strong absorption in NIR region and high thermal efficiency, making them ideal PTT agents. In the above gold nanostructures, gold nanoshells have the obvious advantages: biocompatible, monodisperse, tunable visible-NIR plasmonic spectrum and high stability.30,31 Therefore, it is an urgent need to combine MNPs and gold nanoshells on one nanostructure, which could be used for both MR/CT imaging guided photothermal therapy.
Until now, several strategies have been reported for the synthesis of magnetic nanoparticles coated with gold nanoshells (MGNSs), such as direct coating, seed growth method. Direct coating MNPs with gold nanoshells seems to be a simple method, however, it is often a difficult task to combine two incompatible surfaces and results in poor dispersion, and it fails to generate MGNSs with NIR responses, as the thin gold layer without dielectric layer results in GNPs-like plasmonic response in visible region.32,33 Thus, the midlayer of amino-modified silica or polymer was often used to form gold nanoshells by seed growth.34–36 However, some problems still present in the preparation of MGNSs, such as most of size is larger than 100 nm, the morphology is irregular, which may influence further biomedical applications.37,38 Successful preparation of suitable size and uniform MGNSs by a facile method still remains to be a challenge.
In this research, we report a facile method to synthesize monodisperse, uniform and well-defined nanostructure of PMGNSs nanoparticles with appropriate size (less than 100 nm) by seed growth method. The PMGNSs nanoparticles were composed of a superparamagnetic Fe3O4 inner core, silica as the midlayer and coated with gold nanoshells by seed mediated growth method. They have been demonstrated to be effective MR and CT imaging contrast agents. High stability was also displayed with no significant change after five laser ON/OFF cycles, and high photothermal effect with temperature increase of 40 °C under 808 nm laser irradiation at 2 W cm−2 for 10 min at the concentration of 160 μg ml−1. Low cytotoxicity was demonstrated that the viability more than 90% at the concentration of 200 μg ml−1 of PMGNSs. The viability could reduce to 40% under 808 nm laser irradiation at 2 W cm−2 for 3 min at the concentration of 200 μg ml−1. Comprehensive evaluation has shown that the PMGNSs nanoparticles are with good biocompatibility and great potential to be used as MR/CT dual-modal imaging guided photothermal therapy agents for biomedical applications.
Experimental
Materials
Ferric chloride hexahydrate (FeCl3·6H2O, 99%), oleic acid (OA, AR), 1-octadecene (ODE, 90.0%), cyclohexane (C6H12, 99.5%), sodium oleate (NaOA, CP), hexane (C6H12, 97.0%), ammonia solution (NH3·H2O, 25–28%), acetone (C3H6O, 99.5%), sodium hydroxide (NaOH, 96.0%), potassium carbonate (K2CO3, 99.0%), hydroxylammonium chloride (NH2OH·HCl, 98.5%) were purchased from Aladdin Industrial Inc. Tetraethyl orthosilicate (TEOS, 99.0%), polyoxyethylene (5) nonylphenylether (NP-5), tetrakis(hydroxymethyl)phosphonium chloride (THPC, 80% solution in H2O), hydrogen tetrachloroaurate(III) hydrate (HAuCl4·3H2O, 99.9% metals basis) were purchased from Sigma-Aldrich. mPEG-SH (Mw = 2000) was purchased from Biomatrik Inc. HepG2 cells (hepatocellular carcinoma) were purchased from ATCC (Manassas, VA). The cells were cultured in RPMI 1640 medium with high glucose (ATCC, Manassas, VA) supplemented with 10% FBS (PAN-Biotech GmbH) and 100 IU ml−1 penicillin–streptomycin (Manassas, VA). Phosphate buffered saline (1X) was purchased from HyClone. Cell Counting Kit-8 (CCK-8) and Calcein-AM/PI Double Stain Kit were purchased from Dojindo Laboratories (Japan). The ultrapure water with a resistivity of 18.2 MΩ cm was obtained from Milli-Q Gradient System (Millipore, Bedford, MA, USA) and used for all of the experiments.Characterization
Transmission electron microscopy (TEM) images were taken on a JEM-2100 system at an accelerating voltage of 200 kV. Fourier transform infrared spectra (FT-IR) were performed by a Thermo Nicolet iS50 FT-IR Spectrometer over a potassium bromide pellet, and the diffuse reflectance spectra were scanned over the range from 400 cm−1 to 4000 cm−1. The UV-Vis-NIR spectra were recorded by a Agilent Cary 5000 UV-Vis-NIR Spectrophotometer. The Fe and Au element component analysis were obtained on the Ultima 2 (Horiba-Jobin Yvon) Inductively Coupled Plasma-Optical Emission Spectrometry. The magnetic properties were performed by hysteresis loops measured under a hysteresis curves tester (VSM: USA model lakeshore 7400). The photothermal performance was verified, when the PMGNSs solution was exposed to 808 nm laser (BTW: diode laser system) and the temperature was recorded by a thermocouple microprobe (STPC-510P, Xiamen Baidewo Technology Co., China). The cellular apoptosis were observed with a confocal laser scanning fluorescence microscopy (Carl Zeiss LSM 780, USA). The MRI was taken on a 9.4 T (Bruker Magnetom) system with different concentrations of PMGNSs solution. The CT imaging was taken on a Single Photon Emission Computed Tomography/Computed Tomography (SPECT/CT Mediso nanoScan SC) system by various concentrations of PMGNSs solution.Synthesis of hydrophobic Fe3O4 nanoparticles
The Fe3O4 MNPs were prepared according to a modified thermal-decomposition method.39 In the synthetic procedure, the iron-oleate complex precursor was firstly prepared, a mixed solution of ultrapure water/ethanol (30 ml/40 ml), FeCl3·6H2O (5.4 g), NaOA (18.2 g) and hexane (70 ml) were added into conical flask in sequence, keep stirring at 40 °C for 2 h. The resulting solution was separated by a separatory funnel, washed with ultrapure water twice and collected the above organic layer containing the Fe(oleate)3 precursor complex. Secondly, the Fe(oleate)3 precursor (6 ml) was added into a three-necked-round-bottomed flask and stirred for 2 h to volatilize solvent under argon flow at room temperature. When the solution turned to viscous, oleic acid (1 ml) and 1-octadecene (30 ml) were added, heating up to 120 °C for 10 min at argon condition to remove the water. Afterwards, the reaction system was heated to 300 °C at the heating rate of 3.3 °C min−1, kept stirring for 2 h. The black production of hydrophobic Fe3O4 nanoparticles were washed with ethanol and separated by centrifugation for several times, then collected and redispersed into 10 ml hexane.Synthesis of Fe3O4@SiO2 core–shell nanoparticles modified with APTES
The Fe3O4@SiO2 was synthesized by a typical reverse microemulsion method. Briefly, 0.5 ml of NP-5 was dispersed in 8.85 ml cyclohexane and stirred for 30 min at 650 rpm. Subsequently, as-prepared Fe3O4 nanoparticles solution (200 μl) was added into the above mixed one and stirred for 1 h. Then, ammonia solution (1 ml) was dropwise added and stirred for another 1 h. Then, TEOS (0.2 ml) was dropwise added by twice (adding 100 μl per 12 h). Finally, APTES (25 μl) was dropped into the reaction system and the mixture was vigorously stirred at room temperature for another 12 h. The resulting product of Fe3O4@SiO2 core–shell nanoparticles were collected after centrifuging and washing by ethanol at 9000 rpm 30 min for three times to remove emulsifier, and redispersed in ethanol (5 ml).Synthesis of Fe3O4@SiO2@GNSs–PEG core/shell/shell nanoparticles (PMGNSs)
In a typical procedure, the MGNSs were formed by the seed growth method. Firstly, gold seeds were prepared by the reduction of HAuCl4·3H2O with THPC. 0.5 ml of 1 M NaOH was added to 38 ml of ultrapure water and stirred for 3 min. Then, 1 ml of 1% THPC was injected and stirred for 7 min and subsequently 2 ml of 1% HAuCl4 aqueous solution was added stirring for 2 min. The resulting brown gold seeds were stored at 4 °C. Secondly, gold seeds absorbed on the surface of Fe3O4@SiO2 core–shell nanoparticles. Gold seeds solution (1 ml) was mixed with Fe3O4@SiO2 (30 μl) for stirring 30 min. Then, the resulted Fe3O4@SiO2@GNPs nanoparticles were collected after centrifuging and washing with water to remove the extra gold seeds, and redispersed in water (1 ml). Thirdly, the gold nanoshells formed by a seed growth method. PVP aqueous solution (120 μl, 0.5%) was added into growth media of K2CO3/HAuCl4 (5 ml) solution which has been mixed for 12 h, while vigorously stirring for 5 min. Following, the as-prepared MGNPs were added into the above solution and stirred for another 5 min. In the end, as the adding of NH2OH·HCl (120 μl, 0.02 M) dropwise into the reaction system the solution changed to bluish green, and stirring for 30 min, indicating that gold nanoshells were formed, the MGNSs were washed with water. mPEG-SH was used to modify the surface of MGNSs to decrease the biotoxicity of nanomaterials. 2 mM K2CO3 (500 μl) and 1 mM mPEG-SH (100 μl) were mixed together and stirred for some hours. Then, the MGNSs (5 ml) were added and stirred overnight at room temperature. Finally, the resulted MGNPs modified with mPEG-SH (PMGNSs) were collected after the centrifuging and washing with water and ethanol three times.Cell culture and cytotoxicity assay
Human liver carcinoma cells of HepG2 were maintained in Roswell Park Memorial Institute (RPMI-1640), supplemented with 10% fetal bovine serum (FBS) at 37 °C in a humidified atmosphere of 5% CO2. The cell culture media was supplemented with 100 unit per ml penicillin and 100 μg ml−1 streptomycin to inhibit the growth of other extraneous bacteria. For cytotoxicity assay, 5000 cells were seeded in 96-well plates and cultured for 24 h, followed by addition of PMGNSs with different concentrations. After additional 24 h, cell viability was determined by a cell counting kit 8 (CCK-8) assay following the instruction from the manufacturer. All the experiments were carried out for four replicates.Photothermal ablation
Human liver carcinoma cells of HepG2 were seeded in 96-well plates and cultured for 24 h. Subsequently, different concentrations of PMGNSs nanoparticles were injected and cultured for another 24 h. Then, the cells were irradiated with a 808 nm laser at predetermined output power density and duration for 3 min, cultured for one more 24 h and examined the cell viability by CCK-8 assay.In vitro living/dead cell staining
HepG2 cells were firstly seeded into a 96-well plate at 37 °C in a 5% CO2 atmosphere for 24 h. Then, the cells were washed three times with PBS buffer to remove the dead cells, followed by incubation with PMGNSs at the concentration of 200 μg ml−1 dispersed in culture medium at 37 °C for 4 h. Subsequently, the HepG2 cells were washed by PBS buffer to remove non-uptaken PMGNSs for three times, and then exposed to 808 nm laser (2 W cm−2) for 3 min. After the laser irradiation, the cells were incubated with fresh culture medium at 37 °C for 2 h. Then, the cells were stained with the calcine AM/propidium iodide (PI) to evaluate cell apoptosis induced by the photothermal treatment of the PMGNSs and observed by a confocal lasers scanning fluorescence microscope (Carl Zeiss LSM 780, USA).In vitro MR imaging of PMGNSs
To investigate the MR imaging function of the PMGNSs, an in vitro T2-weighted MR imaging experiment was conducted on a 9.4 T (Bruker Magnetom) system. Tubes containing a series concentration of PMGNSs solution were measured, and water was used as the control. The signal strength is indicated by the brightness of the images.In vitro CT imaging of PMGNSs
To examine the CT imaging function of the PMGNSs, an in vitro CT imaging experiment was conducted on a single photon emission computed tomography/computed tomography (Mediso nanoScan SC) system. Tubes containing the PMGNSs solution were arrayed by increasing concentration, and water was placed as the control. The signal strength is indicated by the different colors of the images.Results and discussion
Synthesis and characterization of PMGNSs
The synthesis process of PMGNSs included four steps, schematic diagram was shown in Fig. 1a. Briefly, monodispersed hydrophobic Fe3O4 nanoparticles were prepared by a modified thermal decomposition method with the average diameter of 12 nm in the first step (Fig. 1b). Secondly, MNPs were successfully encapsulated in silica by reverse microemulsion method, the main mechanism is that NP-5 as a surfactant, ligand exchange with the oleic acid group of Fe3O4, and then hydrolyzed TEOS during coating silica.40 In the meantime, APTES was used to modify the surface of Fe3O4@SiO2 nanoparticles, for further step absorbing of the gold seeds and the growth of gold nanoshells. The Fe3O4@SiO2 nanoparticles display a well defined core–shell nanostructure coated one single Fe3O4 perfectly in the center and surrounded by a homogeneous silica layer, corresponding to the thickness of silica shell about 24 nm (Fig. 1c). Silica was mainly used as the modifier and dielectric midlayer. As the homogeneous Fe3O4 nanoparticles synthesized by thermal decomposition method, they were hydrophobic and hard for directly biological applications. The silica coating is a very good surface modifier, because of its excellent biocompatibility, stability, nontoxicity and could easily modified by organosilane coupling agents. Then, small size of gold seeds with 2 nm diameter were attached onto silica modified with APTES through the amine group and electrostatic interaction (Fig. 1d). Finally, the gold nanoshells were formed by seeds mediated growth method,41,42 and the thickness of gold nanoshell is about 15 nm, mPEG-SH modified the MGNSs through Au–SH bonding effects. The whole size of PMGNSs is about 90 nm, which is suitable for biomedical application.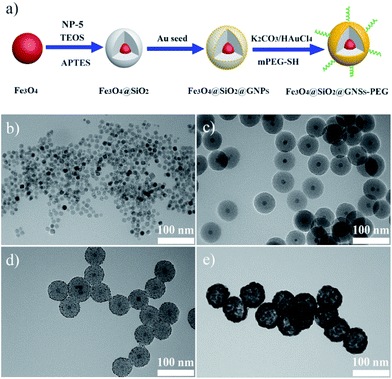 | ||
| Fig. 1 (a) Schematic diagram of PMGNSs synthesis and PEGylation. TEM images of (b) Fe3O4, (c) Fe3O4@SiO2 nanoparticles, (d) Fe3O4@SiO2@GNPs, and (e) Fe3O4@SiO2@GNSs–PEG. | ||
The UV-VIS-NIR absorption spectra of Fe3O4 (2A-a), Fe3O4@SiO2 (2A-b) and Fe3O4@SiO2@GNSs–PEG (PMGNSs) (2A-c) were shown in Fig. 2A. There are no obvious absorption peaks in Fe3O4 (2A-a) and Fe3O4@SiO2 (2A-b). While, there is a broad surface plasmon resonance characteristic peak of gold nanoshells at the range from 500 nm to the near infrared region (2A-c), indicating that gold nanoshells have been successfully assembled. To confirm the step-by-step synthesis of PMGNSs, the FT-IR spectra of Fe3O4, Fe3O4@SiO2 and PMGNSs were measured. As shown in Fig. 2B, the FT-IR spectra of OA capped Fe3O4 (Fig. 2B-a) showed the characteristic peaks of 592 cm−1 was contributed to the Fe–O vibration, 2851 and 2922 cm−1 were respectively contributed to the CH3 and the CH2 stretching vibrations. The two peaks of 1634 and 1409 cm−1 were related to antisymmetric vibration and symmetric vibration of COO– group. With the coating of silica (Fig. 2B-b), the bands at 1096 and 953 cm−1 attributed to antisymmetric vibration of Si–O–Si, 795 and 464 cm−1 symmetric vibration of Si–O, stretch vibration of Fe–O bonds, there is a shift with the exchange of surface ligands, which also indicate the silica coating on the surface of Fe3O4 NPs through ligand exchange. As is shown in Fig. 2B-c characteristic peaks of 3413, 2858, 2919 and 1078 cm−1 were respectively contributed to the O–H stretching, CH3 stretching, CH2 stretching and C–O stretching vibrations, which are the typical infrared absorption band of mPEG-SH. As the use of hydroxylamine hydrochloride for the growth of gold nanoshells, the absorption band of 1633 cm−1 (bending vibration of –NH2) was also observed from the FT-IR spectra. According to the result, it further revealed we successfully obtained the PMGNSs.
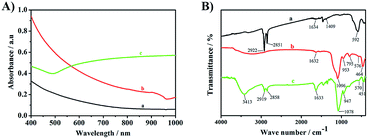 | ||
| Fig. 2 The UV-VIS-NIR absorption spectra of Fe3O4 (A-a), Fe3O4@SiO2 (A-b), PMGNSs (A-c), and the FT-IR spectra of Fe3O4 (B-a), Fe3O4@SiO2 (B-b) and PMGNSs (B-c). | ||
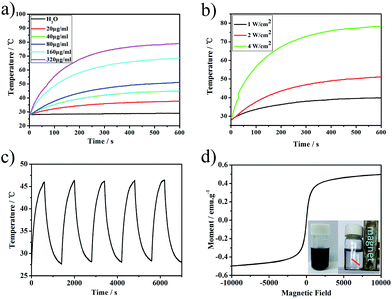
As the PMGNSs have a broad surface plasmon resonance (SPR) peak at the range from 500 nm to the NIR region, which makes them to be potential used for PTT. To study the photothermal property of PMGNSs, the temperature increasing profiles of PMGNSs solution generated by NIR laser irradiation were carried out. The temperature profiles of ultrapure water and PMGNSs solution with different concentrations (Fig. 3a) and different power density 1 W cm−2, 2 W cm−2 and 4 W cm−2 (Fig. 3b) as a function of 808 nm laser irradiation time for 10 min, the temperature rises when increasing the power density of the laser irradiation. We also investigated the temperature profiles of PMGNSs aqueous solutions with different concentrations (20, 40, 80, 160 and 320 μg ml−1) and ultrapure water by a NIR laser irradiation (808 nm at 2 W cm−2 for 10 min). As increasing the concentrations of PMGNSs in the aqueous solution, the temperature rising remarkably. The photothermal heating curves showed a strong laser-power-dependent photothermal effect for PMGNSs with the highest temperature increment up from to 79.1 °C at the concentration of 320 μg ml−1. In obvious contrast, only 1.0 °C of the temperature increasing was observed for ultrapure water at the same treatment conditions. These results indicate that PMGNSs can rapidly and efficiently convert the energy from 808 nm laser into thermal energy. The temperature profiles of five cycles of heating under 2 W cm−2 laser irradiation and cooling down (Fig. 3c). After five cycles, the temperature of PMGNSs aqueous solution with the concentration of 80 μg ml−1 can still could rise up to 46.4 °C, as a function of 808 nm laser irradiation time for 10 min at the power density of 2 W cm−2. The heating profiles confirmed that the PMGNSs have excellent photothermal stability. The magnetic property of PMGNSs was evaluated by a vibrating sample magnetometer (VSM) at room temperature (Fig. 3d). The magnetization curves showed that the PMGNSs have no evident remanence or coercivity, suggesting their superparamagnetic behaviors, it also means that the PMGNSs have the potential been used as magnetic resonance imaging contrasts. The saturation magnetization (Ms) value of PMGNSs was 0.52 emu g−1. From the inset image of Fig. 3d, the PMGNSs can be easily attracted aside by a magnet.
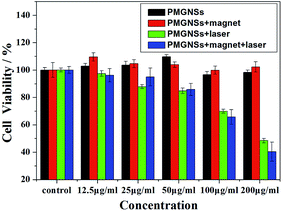 | ||
| Fig. 4 Cell viability of HepG2 treated with different concentrations (0, 12.5, 25, 50, 100 and 200 μg ml−1) of PMGNSs, PMGNSs + magnet, PMGNSs + laser and PMGNSs + magnet + laser. | ||
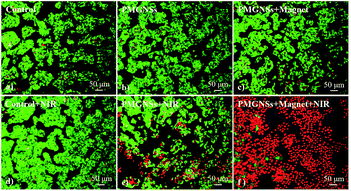
To further evaluate the localized magnetic targeted phototherapeutic effect of PMGNSs, HepG2 cells were incubated with 200 μg ml−1 PGMNSs for 4 h, then irradiated with 808 nm laser at 2 W cm−2 for 3 min, the cells were costained by calcine AM and propidium iodide (PI) to differentiate live (green) and dead (red) cells, respectively, and imaged by a confocal fluorescence microscope for living/dead cells at different condition. As shown in Fig. 5, no obvious viability was observed when HepG2 cells were treated with laser, PMGNSs alone or PMGNSs under magnet comparing with the negative control (Fig. 5a–d). When HepG2 cells treated with PMGNSs and laser irradiation, a large number of cells were dead by thermal ablation (Fig. 5e), even more cellular death when plus a magnet for targeted photothermal therapy (Fig. 5f). These experiments demonstrate the significant phototherapeutic effect of the PMGNSs, they could be used as a high effective PTT agent for treatment of cancer cells.
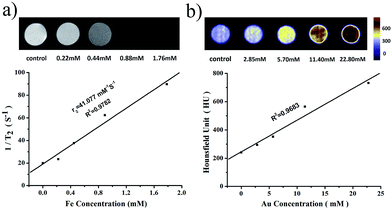
Since the high atomic number and electron density, gold component has the property of high X-ray attenuation. To demonstrate the CT enhancing capability of PMGNSs, the SPECT/CT in vitro experiment was implement by a Single Photon Emission Computed Tomography/Computed Tomography (SPECT/CT Mediso nanoScan SC) system. The inset illustration of Fig. 6b presents the in vitro phantom and color-mapped CT images using various concentrations of Au from 0 to 22.80 mM (quantitatively measured by ICP-OES). As the increase of PMGNSs, the color obviously changed as the contrast enhancement signals form blue violet-yellow-red. From the quantitative measurement of the X-ray attenuation ability of PMGNSs, the HU values of different concentrations were measured. From these data, we could come to a conclusion that the PMGNSs could act as good CT imaging contrast agents.
Conclusions
In summary, we have successfully fabricated monodispersed, uniform and elaborate core/shell/shell PMGNSs nanoparticles. The obtained nanoparticles could be well dispersed in the aqueous solution and possess excellent superparamagnetic and plasmonic properties, enabling the PMGNSs nanoparticles be used as the contrast agents for MR/CT dual imaging. At the same time, PMGNSs nanoparticles have high photothermal therapy effect and high stability. Low biotoxicity will pave ways for providing a multifunctional and versatile cancer theranostic platform combining MR/CT imaging targeted effective photothermal therapy.Conflict of interest
The authors declare no competing financial interest.Acknowledgements
The work was supported by the National Natural Science Foundation of China (No. 31400699 and 61605209), and the Natural Science Foundation of Fujian Province of China (No. 2014J01142 and 2015J05172).References
- K. H. Min, H. S. Min, H. J. Lee, D. J. Park, J. Y. Yhee, K. Kim, I. C. Kwon, S. Y. Jeong, O. F. Silvestre, X. Chen, Y. S. Hwang, E. C. Kim and S. C. Lee, ACS Nano, 2015, 9, 134–145 CrossRef CAS PubMed.
- H. B. Na, I. C. Song and T. Hyeon, Adv. Mater., 2009, 21, 2133–2148 CrossRef CAS.
- Z. Zhao, Z. Zhou, J. Bao, Z. Wang, J. Hu, X. Chi, K. Ni, R. Wang, X. Chen, Z. Chen and J. Gao, Nat. Commun., 2013, 4, 2266 Search PubMed.
- Y. Liu, K. Ai and L. Lu, Acc. Chem. Res., 2012, 45, 1817–1827 CrossRef CAS PubMed.
- A. Jakhmola, N. Anton and T. F. Vandamme, Adv. Healthcare Mater., 2012, 1, 413–431 CrossRef CAS PubMed.
- X. Sun, W. Cai and X. Chen, Acc. Chem. Res., 2015, 48, 286–294 CrossRef CAS PubMed.
- Z. Li, Q. Sun, Y. Zhu, B. Tan, Z. P. Xu and S. X. Dou, J. Mater. Chem. B, 2014, 2, 2793 RSC.
- D. Zhang, M. Wu, Y. Y. Zeng, N. S. Liao, Z. X. Cai, G. Liu, X. L. Liu and J. F. Liu, J. Mater. Chem. B, 2016, 4, 589–599 RSC.
- I. Willekens, E. Van De Casteele, N. Buls, F. Temmermans, B. Jansen, R. Deklerck and J. de Mey, BMC Cancer, 2014, 14, 9 CrossRef PubMed.
- A. S. P. Lin, A. W. Palmer, C. L. Duvall, G. C. Robertson, M. E. Oest, B. Rai, M. E. Levenston and R. E. Guldberg, Advanced Bioimaging Technologies in Assessment of the Quality of Bone and Scaffold Materials: Techniques and Applications, 2007, pp. 239–256 Search PubMed.
- A. Datir, S. L. J. James, K. Ali, J. Lee, M. Ahmad and A. Saifuddin, Clin. Radiol., 2008, 63, 373–378 CrossRef CAS PubMed.
- H. Cai, K. Li, J. Li, S. Wen, Q. Chen, M. Shen, L. Zheng, G. Zhang and X. Shi, Small, 2015, 11, 4584–4593 CrossRef CAS PubMed.
- W. Feng, X. Zhou, W. Nie, L. Chen, K. Qiu, Y. Zhang and C. He, ACS Appl. Mater. Interfaces, 2015, 7, 4354–4367 CAS.
- C. S. S. R. Kumar and F. Mohammad, Adv. Drug Delivery Rev., 2011, 63, 789–808 CrossRef CAS PubMed.
- Q. Zhao, L. Wang, R. Cheng, L. Mao, R. D. Arnold, E. W. Howerth, Z. G. Chen and S. Platt, Theranostics, 2012, 2, 113–121 CrossRef CAS PubMed.
- X. Li, Y. Hu, J. Xiao, D. Cheng, Y. Xiu and H. Shi, Nanoscale Res. Lett., 2015, 10, 367 CrossRef PubMed.
- D. Kim, S. Park, J. H. Lee, Y. Y. Jeong and S. Jon, J. Am. Chem. Soc., 2007, 129, 7661–7766 CrossRef CAS PubMed.
- M. Kodiha, Y. M. Wang, E. Hutter, D. Maysinger and U. Stochaj, Theranostics, 2015, 5, 357–370 CrossRef PubMed.
- H. Hinterwirth, G. Stubiger, W. Lindner and M. Lammerhofer, Anal. Chem., 2013, 85, 8376–8384 CrossRef CAS PubMed.
- M. Zhu, X. Cai, M. Fujitsuka, J. Zhang and T. Majima, Angew. Chem., Int. Ed., 2017, 56, 2064–2068 CrossRef CAS PubMed.
- Z. Zhang, J. Wang and C. Chen, Adv. Mater., 2013, 25, 3869–3880 CrossRef CAS PubMed.
- M. S. Yavuz, Y. Y. Cheng, J. Y. Chen, C. M. Cobley, Q. Zhang, M. Rycenga, J. W. Xie, C. Kim, K. H. Song, A. G. Schwartz, L. H. V. Wang and Y. N. Xia, Nat. Mater., 2009, 8, 935–939 CrossRef CAS PubMed.
- S. E. Skrabalak, J. Y. Chen, Y. G. Sun, X. M. Lu, L. Au, C. M. Cobley and Y. N. Xia, Acc. Chem. Res., 2008, 41, 1587–1595 CrossRef CAS PubMed.
- A. M. Alkilany, L. B. Thompson, S. P. Boulos, P. N. Sisco and C. J. Murphy, Adv. Drug Delivery Rev., 2012, 64, 190–199 CrossRef CAS PubMed.
- M. A. Mackey, M. R. Ali, L. A. Austin, R. D. Near and M. A. El-Sayed, J. Phys. Chem. B, 2014, 118, 1319–1326 CrossRef CAS PubMed.
- Y. Tian, S. Luo, H. J. Yan, Z. G. Teng, Y. W. Pan, L. Y. Zeng, J. Wu, Y. J. Li, Y. Liu, S. J. Wang and G. M. Lu, J. Mater. Chem. B, 2015, 3, 4330–4337 RSC.
- Y. Liu, J. R. Ashton, E. J. Moding, H. Yuan, J. K. Register, A. M. Fales, J. Choi, M. J. Whitley, X. Zhao, Y. Qi, Y. Ma, G. Vaidyanathan, M. R. Zalutsky, D. G. Kirsch, C. T. Badea and T. Vo-Dinh, Theranostics, 2015, 5, 946–960 CrossRef CAS PubMed.
- H. Liu, D. Chen, L. Li, T. Liu, L. Tan, X. Wu and F. Tang, Angew. Chem., Int. Ed., 2011, 50, 891–895 CrossRef CAS PubMed.
- S. Lal, S. E. Clare and N. J. Halas, Acc. Chem. Res., 2008, 41, 1842–1851 CrossRef CAS PubMed.
- S. J. Oldenburg, R. D. Averitt, S. L. Westcott and N. J. Halas, Chem. Phys. Lett., 1998, 288, 243–247 CrossRef CAS.
- C. Fu, C. He, L. Tan, S. Wang, L. Shang, L. Li, X. Meng and H. Liu, Sci. Bull., 2016, 61, 282–291 CrossRef CAS.
- Z. C. Xu, Y. L. Hou and S. H. Sun, J. Am. Chem. Soc., 2007, 129, 8698–8699 CrossRef CAS PubMed.
- T. Zhou, B. Wu and D. Xing, J. Mater. Chem., 2012, 22, 470–477 RSC.
- X. J. Ji, R. P. Shao, A. M. Elliott, R. J. Stafford, E. Esparza-Coss, J. A. Bankson, G. Liang, Z. P. Luo, K. Park, J. T. Markert and C. Li, J. Phys. Chem. C, 2007, 111, 6245–6251 CAS.
- X. Wang, H. Liu, D. Chen, X. Meng, T. Liu, C. Fu, N. Hao, Y. Zhang, X. Wu, J. Ren and F. Tang, ACS Appl. Mater. Interfaces, 2013, 5, 4966–4971 CAS.
- Y. Jin, C. Jia, S. W. Huang, M. O'Donnell and X. Gao, Nat. Commun., 2010, 1, 41 Search PubMed.
- N. Kostevšek, K. Žužek Rožman, M. S. Arshad, M. Spreitzer, S. Kobe and S. Šturm, J. Phys. Chem. C, 2015, 119, 16374–16382 Search PubMed.
- L. Wang, J. Bai, Y. Li and Y. Huang, Angew. Chem., Int. Ed., 2008, 47, 2439–2442 CrossRef CAS PubMed.
- J. Park, K. An, Y. Hwang, J. G. Park, H. J. Noh, J. Y. Kim, J. H. Park, N. M. Hwang and T. Hyeon, Nat. Mater., 2004, 3, 891–895 CrossRef CAS PubMed.
- H. L. Ding, Y. X. Zhang, S. Wang, J. M. Xu, S. C. Xu and G. H. Li, Chem. Mater., 2012, 24, 4572–4580 CrossRef CAS.
- C. S. Levin, C. Hofmann, T. A. Ali, A. T. Kelly, E. Morosan, P. Nordlander, K. H. Whitmire and N. J. Halas, ACS Nano, 2009, 3, 1379–1388 CrossRef CAS PubMed.
- L. Li, S. Fu, C. Chen, X. Wang, C. Fu, S. Wang, W. Guo, X. Yu, X. Zhang, Z. Liu, J. Qiu and H. Liu, ACS Nano, 2016, 10, 7094–7105 CrossRef CAS PubMed.
Footnote |
| † Xuemei Hou and Xuandong Wang contributed equally. |
| This journal is © The Royal Society of Chemistry 2017 |

