 Open Access Article
Creative Commons Attribution 3.0 Unported Licence
Ansavaricins F–I, new DNA topoisomerase inhibitors produced by Streptomyces sp. S012†
Zhiqiang Zhanga,
Xingkang Wua,
Rentai Songb,
Juanli Zhangc,
Haoxin Wangb,
Jing Zhub,
Chunhua Lua and
Yuemao Shen *ab
*ab
aKey Laboratory of Chemical Biology (Ministry of Education), School of Pharmaceutical Sciences, Shandong University, No. 44 West Wenhua Road, Jinan, Shandong 250012, P. R. China. E-mail: yshen@sdu.edu.cn; Tel: +86-531-88382108
bState Key Laboratory of Microbial Technology, Shandong University, No. 27 South Shanda Road, Jinan, Shandong 250100, P. R. China
cDepartment of Pharmacy, Xijing Hospital, The Fourth Military Medical University, Changle West Street 15, Xi'an, Shaanxi 710032, P. R. China
First published on 7th March 2017
Abstract
Ansamycins are a family of macrolactams characterized by an aromatic chromophore with an aliphatic chain (ansa chain) connected back to a nonadjacent position through an amide bond. In this study, four new polyketides of ansamycin class, designated as ansavaricins F–I (1–4), were obtained from the Streptomyces sp. S012 strain. All the compounds were structurally characterized as open-chain streptovaricin derivatives by using NMR and HRESIMS techniques, and showed different degrees of inhibition against human DNA topoisomerases. Ansavaricin H is a promising lead for the development of new inhibitors of human DNA topoisomerases.
Introduction
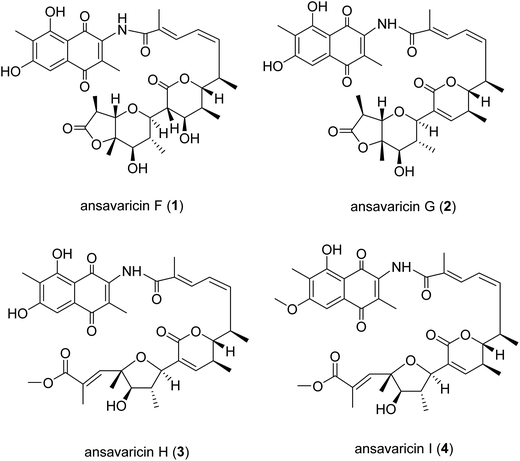
The ansamycins constitute a class of antibiotics including the antituberculosis rifamycins,1 antitumor geldanamycin,2 and numerous other compounds as well as the streptovaricins.3 Structurally, ansamycins are characterized by a macrocycle consisting of an aromatic moiety (naphthalene or benzene derivative) linked by an aliphatic chain that terminates at the chromophore in an amide linkage.4 These macrolactams are constructed by the multidomain modular type I PKSs using 3-amino-5-hydroxybenzoic acid (AHBA) as the starter unit,5 followed by various post-PKS modifications. Thus, PCR-based screening with primers for the amplification of conserved regions of the AHBA synthase genes provides a valuable tool for mining new ansamycins.6,7 Previously, we have adapted this method to establish a library of plant-associated and marine-derived actinomycetes,8 and discovered novel ansamycins including hygrocins,8,9 divergolides,10,11 juanlimycins,12 neoansamycins,13 and ansatrienins.14Streptomyces sp. S012 (ESI Fig. S30†) was isolated from the soil of Nanjing Zhongshan Botanical Garden and identified to be an AHBA synthase gene-positive strain (ESI Fig. S38†) producing streptovaricins. The streptovaricins, members of the ansamycin class, are a family of important macrolactams both for their remarkable structures and their biological properties.15 All the streptovaricin antibiotics including protostreptovaricins and damavaricins consist of a unique naphthoquinone core and a polyhydroxylated aliphatic chain (ansa chain) linking two non-adjacent positions of the naphthalenic chromophore. Among them, streptovaricin U is the only reported open-chain streptovaricin that the ansa chain is not cyclized and has inhibitory activity against RAUSCHER leukemia virus RNA-dependent DNA polymerase.16 Previously, we described our findings of new streptovaricin derivatives including ansavaricins A–E (5–9) with significant inhibition on the secretion of SPI-1 effectors of Salmonella enterica serovar typhimurium.17 Recently, we have succeeded in elucidating four more new open-chain streptovaricins, namely ansavaricins F–I (1–4, Fig. 1), in which the ansa chains had been cleaved. The difference was that these new compounds showed no inhibition on the secretion of SPI-1 effectors of Salmonella enterica serovar typhimurium, but exhibited different degrees of inhibition against human DNA topoisomerases.
Results and discussion
Isolation and identification of ansavaricins produced by Streptomyces sp. S012
The strain S. sp. S012 was cultured on ISP3 agar plates for 12 d at 28 °C and extracted with EtOAc/MeOH (80![[thin space (1/6-em)]](https://www.rsc.org/images/entities/char_2009.gif) :
:![[thin space (1/6-em)]](https://www.rsc.org/images/entities/char_2009.gif) 20, v/v) to afford a dark crude extract that was partitioned between doubly-distilled water and EtOAc (1
20, v/v) to afford a dark crude extract that was partitioned between doubly-distilled water and EtOAc (1![[thin space (1/6-em)]](https://www.rsc.org/images/entities/char_2009.gif) :
:![[thin space (1/6-em)]](https://www.rsc.org/images/entities/char_2009.gif) 1, v/v). The EtOAc-soluble partition was dissolved in 95% methanol and petroleum ether to obtain the MeOH extract (4.2 g). The MeOH extract was fractionated by a combination of various column chromatographic methods, resulting in the isolation and structural characterization of four new streptovaricins, ansavaricins F–I (1–4). Meanwhile, the inhibition on topoisomerases activity of ansavaricins A–E (5–9) and ansavaricins F–I (1–4) were also evaluated.
1, v/v). The EtOAc-soluble partition was dissolved in 95% methanol and petroleum ether to obtain the MeOH extract (4.2 g). The MeOH extract was fractionated by a combination of various column chromatographic methods, resulting in the isolation and structural characterization of four new streptovaricins, ansavaricins F–I (1–4). Meanwhile, the inhibition on topoisomerases activity of ansavaricins A–E (5–9) and ansavaricins F–I (1–4) were also evaluated.
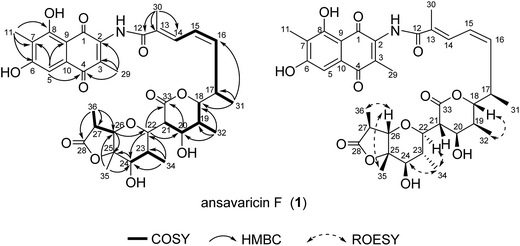
Compound 1 was isolated as a red powder. The HRESIMS gave a quasi-molecular ion [M + H]+ at m/z 682.2858 (calcd for C36H44NO12+, 682.2858) (ESI Fig. S25†). The 13C NMR spectroscopic data of 1 showed two carbonyl signals at δC 185.1 and 185.3, characteristic for the quinone carbonyls (Table 1). Additionally, HMBC correlations of H-5 and Me-11 protons revealed that this compound belonged to naphthoquinone that was similar with previously described chaxamycin A and C by comparison of their NMR data (Table 1 and Fig. 2).18 The six-carbon fragment from C-12 to C-17 was established on the basis of 1H–1H COSY correlations between H-14 and H-15, H-15 and H-16, and between H-16 and H-17, along with the HMBC correlations from the protons of Me-30 to C-12, C-13 and C-14. The 1H–1H COSY correlations from H-18 to H-21 and HMBC correlations from the protons of Me-32 to C-18, C-19 and C-20, and that from H-21 to C-20 and C-33 permitted the construction of a five-membered unit possessing C-18, C-19, C-20, C-21 and C-33 in the molecule. Compared with ansavaricin C (7), the downfield chemical shift of H-18 (δH = 4.77 in 1, δH = 3.55 in 7) which was similar to that of streptovaricin F owning six-membered lactone (δH = 4.62) suggested an α-pyrone ring among C-18–C-21 and C-33 (δC = 170.4).17,19 The α-pyrone ring was connected to the six-carbon fragment from C-12 to C-17 on the basis of the HMBC correlation from the Me-31 protons to C-18 and that from H-18 to C-16. The HMBC and 1H–1H COSY correlations disclosed the connection from C-22 to C-28 (Table 1). The HMBC correlation from H-26 to C-22 permitted the identification of a pyran ring, which was connected to fragment from C-18 to C-21 revealed by the HMBC correlations from H-22 to C-20 and C-33. In consideration of the degrees of unsaturation, molecular formula and 13C chemical shifts from C-22 to C-28 (Table 1), an ester linkage was proposed between C-28 and C-25.
| Pos. | δH (mult., J Hz) | δC | 1H–1H COSY | HMBC |
|---|---|---|---|---|
| 1 | 185.3s | |||
| 2 | 140.7s | |||
| 3 | 138.0s | |||
| 4 | 185.1s | |||
| 5 | 7.51 (br s) | 108.9d | C-1/C-4, C-7, C-9 | |
| 6 | 163.1s | |||
| 7 | 118.2s | |||
| 8 | 164.8s | |||
| 9 | 108.3s | |||
| 10 | 132.6s | |||
| 11 | 2.41 (s) | 9.0q | C-6, C-7, C-8 | |
| 12 | 168.2s | |||
| 13 | 132.2s | |||
| 14 | 7.95 (d, 11.7) | 130.8d | H-15 | C-12, C-30 |
| 15 | 6.75 (t, 11.4) | 125.4d | H-16 | C-17 |
| 16 | 6.24 (t, 10.7) | 139.6d | H-15, H-17 | C-14 |
| 17 | 3.31 (m) | 35.1d | H-31 | |
| 18 | 4.77 (dd, 10.3, 1.9) | 85.0d | H-19 | C-16 |
| 19 | 2.60 (m) | 34.5d | H-18, H-20, H-32 | |
| 20 | 4.30 (t, 2.6) | 73.8d | H-19, H-21 | C-18, C-33 |
| 21 | 3.50 (d, 1.6) | 51.3d | H-20 | C-20, C-33 |
| 22 | 4.06 (d, 10.3) | 78.1d | C-20, C-24, C-33 | |
| 23 | 2.82 (m) | 38.6d | H-24, H-34 | |
| 24 | 3.99 (d, 11.1) | 76.3d | H-23 | C-25 |
| 25 | 84.3s | |||
| 26 | 4.52 (d, 11.2) | 85.8d | H-27 | C-22, C-24, C-25, C-35, C-36 |
| 27 | 3.47 (m) | 36.4d | H-26, H-36 | |
| 28 | 176.5s | |||
| 29 | 2.31 (s) | 14.3q | C-2, C-3, C-4 | |
| 30 | 2.28 (s) | 13.8q | C-12, C-13, C-14 | |
| 31 | 1.23 (d, 6.9) | 19.0q | H-17 | C-16, C-17, C-18 |
| 32 | 1.32 (d, 6.8) | 14.5q | H-19 | C-18, C-19, C-20 |
| 33 | 170.4s | |||
| 34 | 1.36 (d, 6.4) | 13.6q | H-23 | C-22, C-23, C-24 |
| 35 | 1.77 (s) | 18.7q | C-24, C-26 | |
| 36 | 1.45 (d, 6.8) | 14.0q | H-27 | C-26, C-27, C-28 |
| NH | 10.05 (s) | C-3 |
The relative configuration of 1 was deduced by analyses of ROESY correlations. The E-configuration of the C-13/14 double bond was proposed from the relative upfield shift of the allylic methyl group C-30 (δC = 13.8) (Table 1). The geometry of the C-15/16 double bond was determined to be Z-form on the basis of the cis-1H–1H coupling constants between H-15 (J = 11.4 Hz) and H-16 (J = 10.7 Hz) (Table 1). The structure and absolute configuration of the known compound streptovaricin C had been determined by X-ray analysis of a heavy atom derivative.19,20 Although the structure of 1 was different from that of streptovaricin C, the ROESY correlations described in Fig. 2 suggested that both of them had the same relative configurations at C-18, C-19, C-22, C-23, C-24 and C-25. The ROESY cross-peaks observed from H-35 to H-26 and H-26 to H-36 proposed the relative configurations at the C-26 and C-27 positions. The stereochemistries of C-17, C-20 and C-21 were assumed to be the same as that of other streptovaricins on the basis of biosynthetic logic (ESI Fig. S29†).5,20 On the basis of the above analyses, the gross structure of 1 was deduced as a new ansamycin type polyketide, for which we proposed the name ansavaricin F.
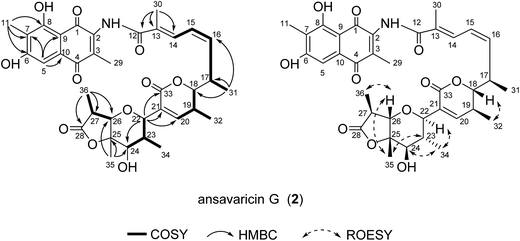
The molecular formula of compound 2 was assigned as C36H41NO11 by interpretation of a protonated molecular ion peak at m/z 664.2754 [M + H]+ (calcd for C36H42NO11+, 664.2752) in the HRESIMS spectrum (ESI Fig. S26†). The NMR data revealed that 2, similar to 1, had a heterocyclic system of a δ-lactone ring, a tetrahydropyran ring and one γ-lactone (Table 2). The changes of chemical shifts at C-20 (δC = 73.8, δH = 4.30 in 1, δC = 150.4, δH = 7.05 in 2), C-21 (δC = 51.3, δH = 3.50 in 1 and δC = 130.8 in 2) indicated that the carbon–carbon double bond was formed between C-20 and C-21 by dehydration (Tables 1 and 2). The key HMBC correlation from H-26 (δH = 4.40) to C-22 permitted the ether linkage between C-26 and C-22. The δ-lactone ring was proposed by the downfield chemical shift of H-18 (δH = 4.04). Considering the degrees of unsaturation, molecular formula and the chemical shifts of C-25 (δC = 84.5) and C-28 (δC = 176.9) compared to those of 1, an ester linkage was assumed to be constructed between C-25 and C-28. Further interpretation of NMR spectroscopic data of 2 was assigned in Table 2 and Fig. 3. The relative configuration of 2 was the same with that of 1 by comparison of their NMR data and ROESY spectrum (Tables 1 and 2, Fig. 2 and 3). Thus, the structure of ansavaricin G (2) was proposed.
| Pos. | δH (mult., J Hz) | δC | 1H–1H COSY | HMBC |
|---|---|---|---|---|
| 1 | 185.3s | |||
| 2 | 138.2s | |||
| 3 | 140.7s | |||
| 4 | 185.1s | |||
| 5 | 7.51 (s) | 108.8d | C-1/C-4, C-7, C-9, C-10 | |
| 6 | 163.1s | |||
| 7 | 118.3s | |||
| 8 | 164.8s | |||
| 9 | 108.4s | |||
| 10 | 132.2s | |||
| 11 | 2.41 (s) | 9.0q | C-6, C-7, C-8 | |
| 12 | 168.3s | |||
| 13 | 133.2s | |||
| 14 | 7.80 (s) | 130.4d | H-15 | C-12, C-30 |
| 15 | 6.60 (t, 11.4) | 125.9d | H-16 | C-13, C-17 |
| 16 | 5.98 (t, 10.7) | 138.4d | H-15, H-17 | C-14 |
| 17 | 3.19 (m) | 34.4d | H-16, H-31 | C-31 |
| 18 | 4.04 (dd, 2.3, 10.9) | 86.8d | H-19 | C-16, C-17, C-31 |
| 19 | 2.67 (m) | 32.9d | H-18, H-20, H-32 | C-18, C-20 |
| 20 | 7.05 (d, 2.1) | 150.4d | H-19 | C-18, C-19, C-22, C-32, C-33 |
| 21 | 130.8s | |||
| 22 | 4.99 (m) | 73.1d | H-23 | C-20, C-21, C-24, C-33 |
| 23 | 2.26 (m) | 40.6d | H-22, H-24, H-34 | |
| 24 | 4.17 (d, 10.9) | 76.4d | H-23 | C-23, C-25, C-34, C-35 |
| 25 | 84.5s | |||
| 26 | 4.40 (d, 11.1) | 86.5d | H-27 | C-22, C-24, C-25, C-35, C-36 |
| 27 | 3.62 (br s) | 36.5d | H-26, H-36 | C-26, C-36 |
| 28 | 176.9s | |||
| 29 | 2.31 (s) | 14.5q | C-2, C-3, C-4 | |
| 30 | 2.27 (s) | 13.826q | C-12, C-13, C-14 | |
| 31 | 1.11 (d, 6.9) | 18.5q | H-17 | C-16, C-17, C-18 |
| 32 | 1.09 (d, 7.2) | 16.3q | H-19 | C-18, C-19, C-20 |
| 33 | 165.1s | |||
| 34 | 1.30 (d, 6.5) | 13.831q | H-23 | C-22, C-23, C-24 |
| 35 | 1.84 (s) | 18.8q | C-24, C-25, C-26 | |
| 36 | 1.37 (d, 6.9) | 14.0q | C-26, C-27, C-28 | |
| NH | 10.06 (s) |
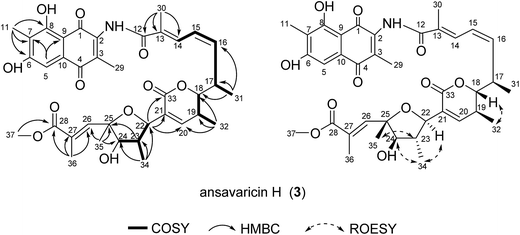
The molecular formula of compound 3 was assigned as C37H43NO11 on the basis of analysis of HRESIMS data (a protonated molecular ion at m/z 678.2911 [M + H]+, 695.3169 [M + NH4]+, calcd for C37H44NO11+, 678.2909) (ESI Fig. S27†). The 1H and 13C NMR data of 3 was nearly identical to those of 2 (Table 3). The presence of four sp2 carbon signals at C-20 (δC = 148.2), C-21 (δC = 142.2), C-26 (δC = 144.2) and C-27 (δC = 130.8) and two olefinic protons at H-20 (δH = 6.73) and H-26 (δH = 7.88) were attributable to two double bonds (Table 3). The chemical shifts of H-18 (δH = 4.06), C-33 (δC = 165.5), C-22 (δC = 78.5) and C-25 (δC = 83.0) compared to those of 1 and 2 (Tables 1–3), and the degrees of unsaturation and molecular formula suggested the presence of a δ-lactone ring and a tetrahydrofuran instead of a tetrahydropyran ring in 3. The E-configuration of the C-26/27 double bond was proposed from the relative upfield shift of the allylic methyl group C-36 (δC = 15.24) (Table 3). The relative configurations of C-17, C-18, C-19, C-22, C-23, C-24 and C-25 were proposed identical to those of 2 on the basis of ROESY correlations and same biosynthetic origin (Fig. 4 and ESI Fig. S29†).5,20 Hence, compound 3 was deduced as ansavaricin H.
| Pos. | δH (mult., J Hz) | δC | 1H–1H COSY | HMBC |
|---|---|---|---|---|
| 1 | 185.5s | |||
| 2 | 141.0s | |||
| 3 | 138.7s | |||
| 4 | 185.4s | |||
| 5 | 7.62 (s) | 109.1d | C-1/C-4, C-7, C-9 | |
| 6 | 163.3s | |||
| 7 | 118.5s | |||
| 8 | 164.9s | |||
| 9 | 108.6s | |||
| 10 | 132.4s | |||
| 11 | 2.40 (s) | 9.1q | C-6, C-7, C-8 | |
| 12 | 168.8s | |||
| 13 | 133.3s | |||
| 14 | 7.83 (d, 11.6) | 130.7d | H-15 | C-12, C-30 |
| 15 | 6.64 (t, 11.4) | 126.0d | H-16 | C-13, C-17 |
| 16 | 6.00 (t, 10.7) | 138.9d | H-15, H-17 | C-14 |
| 17 | 3.30 (m) | 34.7d | H-16, H-31 | |
| 18 | 4.06 (dd, 10.7, 2.0) | 87.2d | H-19 | C-16 |
| 19 | 2.53 (m) | 32.9d | H-18, H-32 | |
| 20 | 6.73 (d, 1.0) | 148.2d | C-32, C-22, C-18, C-33 | |
| 21 | 132.2s | |||
| 22 | 4.94 (d, 9.5) | 78.5d | H-23 | C-20, C-21, C-23, C-33, C-34 |
| 23 | 2.33 (s) | 47.1d | H-22, H-24, H-34 | C-22, C-25 |
| 24 | 4.03 (d, 9.6) | 85.6d | H-23 | C-26, C-34, C-35 |
| 25 | 83.0s | |||
| 26 | 7.88 (s) | 144.2d | C-25, C-27, C-28, C-36 | |
| 27 | 130.8s | |||
| 28 | 170.0s | |||
| 29 | 2.33 (s) | 14.5q | C-2, C-3, C-4 | |
| 30 | 2.32 (s) | 14.0q | C-12, C-13, C-14 | |
| 31 | 1.19 (d, 6.7) | 18.8q | H-17 | C-16, C-17, C-18 |
| 32 | 1.09 (d, 7.1) | 16.7q | H-19 | C-18, C-19, C-20 |
| 33 | 165.5s | |||
| 34 | 1.38 (d, 6.5) | 15.20q | H-23 | C-22, C-23, C-24 |
| 35 | 1.65 (s) | 25.6q | C-24, C-25, C-26 | |
| 36 | 2.33 (s) | 15.24q | C-26, C-27, C-28 | |
| 37 | 3.74 (s) | 52.5q | C-28 | |
| NH | 10.15 (s) |
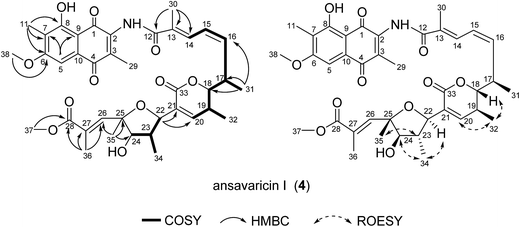
Compound 4 was obtained as a red powder with UV/Vis λmax 220 and 270 nm. The molecular formula of compound 4 was determined to be C38H45NO11 by high-resolution ESIMS (m/z 692.3062 [M + H]+, 709.3324 [M + NH4]+, calcd for C38H46NO11+, 692.3065) (ESI Fig. S28†), which was identified as an analogue of 3 with a methoxy at C-6 rather than a hydroxyl in 3 by comparison of NMR data (Tables 3 and 4). Therefore, compound 4 was conjectured to be ansavaricin I (Fig. 5).
| Pos. | δH (mult., J Hz) | δC | 1H–1H COSY | HMBC |
|---|---|---|---|---|
| 1 | 185.0s | |||
| 2 | 138.8s | |||
| 3 | 140.5s | |||
| 4 | 184.8s | |||
| 5 | 7.34 (s) | 103.4d | C-1/C-4, C-7, C-9 | |
| 6 | 164.2s | |||
| 7 | 119.8s | |||
| 8 | 161.5s | |||
| 9 | 107.5s | |||
| 10 | 132.1s | |||
| 11 | 2.21 (s) | 8.7q | C-6, C-7, C-8 | |
| 12 | 168.4s | |||
| 13 | 133.2s | |||
| 14 | 7.78 (d, 11.7) | 130.4d | H-15 | C-12, C-30 |
| 15 | 6.59 (t, 11.4) | 125.7d | H-16 | C-13, C-17 |
| 16 | 5.95 (t, 10.7) | 138.5d | H-15, H-17 | C-14 |
| 17 | 3.13 (m) | 34.4d | H-16, H-18, H-31 | |
| 18 | 3.98 (t, 9.4) | 86.8d | H-17, H-19 | C-16 |
| 19 | 2.49 (m) | 32.7d | H-18, H-20, H-32 | |
| 20 | 6.70 (s) | 147.8d | C-18, C-19, C-22, C-32, C-33 | |
| 21 | 132.3s | |||
| 22 | 4.94 (d, 9.5) | 78.3d | H-23 | C-20, C-21, C-34 |
| 23 | 2.31 (m) | 47.1d | H-22, H-24, H-34 | |
| 24 | 3.98 (t, 9.4) | 85.3d | H-23 | C-34, C-35 |
| 25 | 82.7s | |||
| 26 | 7.90 (s) | 144.0d | C-25, C-27, C-28, C-36 | |
| 27 | 130.7s | |||
| 28 | 169.7s | |||
| 29 | 2.35 (s) | 15.1q | C-2, C-3, C-4 | |
| 30 | 2.27 (s) | 13.8q | C-12, C-13, C-14 | |
| 31 | 1.11 (d, 6.8) | 18.5q | H-17 | C-16, C-17, C-18 |
| 32 | 1.01 (d, 7.1) | 16.5q | H-19 | C-18, C-19, C-20 |
| 33 | 165.1s | |||
| 34 | 1.36 (d, 6.5) | 15.0q | H-23 | C-22, C-23, C-24 |
| 35 | 1.61 (s) | 25.5q | C-24, C-25, C-26 | |
| 36 | 2.33 (s) | 14.6q | C-26, C-27, C-28 | |
| 37 | 3.70 (s) | 52.2q | C-28 | |
| 38 | 3.76 (s) | 56.5q | C-6 | |
| NH | 10.16 (s) |
Topoisomerases I and II inhibitory activities of ansavaricins
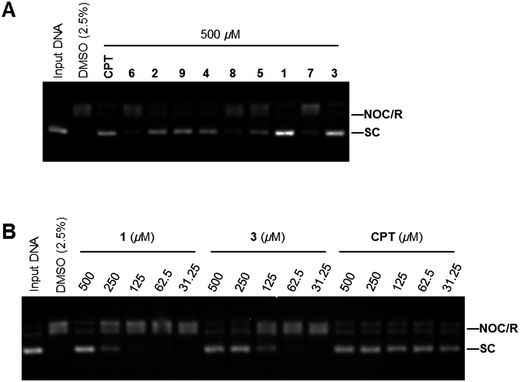
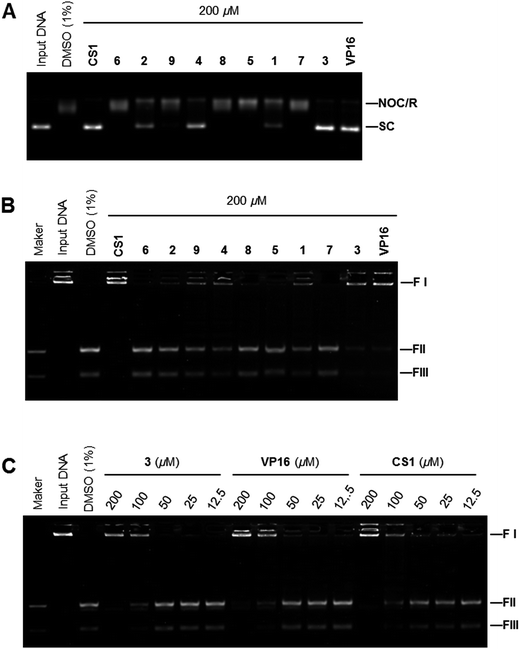
Because ansavaricins shared structural elements named naphthoquinones and quinones with some established topoisomerase II poisons,21 we assessed the topoisomerases inhibitory activities of ansavaricins A–E (5–9) and ansavaricins F–I (1–4) extracted from Streptomyces sp. S012. We first examined topoisomerases (Topo) inhibitory activity using Topo-mediated supercoiled DNA relaxation assay. While six compounds (1, 2, 3, 4, 5 and 9) had Topo I inhibitory activities at 500 μM treatment. 1 and 3 inhibited Topo I more strongly than other ansavaricins (Fig. 6A and ESI Fig. S31†). A dose-dependent assay showed that 3 had stronger Topo I inhibitory activity than 1 (Fig. 6B and ESI Fig. S32†). Meanwhile, four compounds (1, 2, 3 and 4) inhibited Topo IIα activities at the concentration of 200 μM, and 3 exhibited stronger Topo IIα inhibitory activity than others (Fig. 7A and ESI Fig. S33†). Subsequently, the kinetoplast DNA (kDNA) decatenation assay was applied to screen Topo IIα specific inhibitors. Five compounds (1, 2, 3, 4 and 9) inhibited the decatenation activities of Topo IIα at 200 μM, and the inhibitory activity of 3 on Topo IIα-mediated kDNA decatenation was more potent than other ansavaricins (Fig. 7B and ESI Fig. S34†). Based on the dose-dependent inhibition assay, the extent of inhibition on Topo IIα-mediated kDNA decatenation by 3 was equal to positive compounds, VP16 and CS1 (Fig. 7C and ESI Fig. S35†).22,23 On the basis of results of relaxation and decatenation assays, 3 was confirmed to inhibit potently both Topo I and Topo IIα. In addition, on the basis of these results, it appeared that ansavaricins with acyclic ansa chains were proposed to be more potent in topoisomerases inhibitory activities than the cyclized compounds, which provided valuable information regarding structure–activity relationships for the development of new topoisomerases inhibitors.Evaluation of the cytotoxic activity of ansavaricin H on human cancer cell lines
The inhibitors of both Topo I and Topo IIα are well known as antitumor agents. Therefore, the cytotoxicity of ansavaricin H (3) was assayed against six human cell lines: HeLa, MDA-MB-453, MDA-MB-231, THP-1, HepG2 and HL7702. Compound 3 exhibited anti-proliferation activity against all tested cancer cell lines (Fig. 8) and inhibited HeLa (Fig. 8A) and MDA-MB-453 (Fig. 8B) cells proliferation with IC50 values of approximately 50 μM, whereas the IC50 values were over 200 μM for MDA-MB-231 (Fig. 8C) and THP-1 cells (Fig. 8D). Meanwhile, we also observed the toxicity of 3 in the treatment of normal cells (Fig. 8F). HL7702 is a normal hepatic cell line and HepG2 is a hepatoma carcinoma cell line. Based on our results, 3 was more toxic to HL7702 cells than HepG2 cells (Fig. 8E). Meanwhile, it was important to note that VP16 also showed higher toxicity to HL7702 cells. It was possible that HL7702 cells were more sensitive to drug treatment in vitro. Hence, compound 3 displayed selective inhibitory activity against tested cancer cell lines and was more cytotoxic against HeLa and MDA-MB-453 cells than other tested cell lines.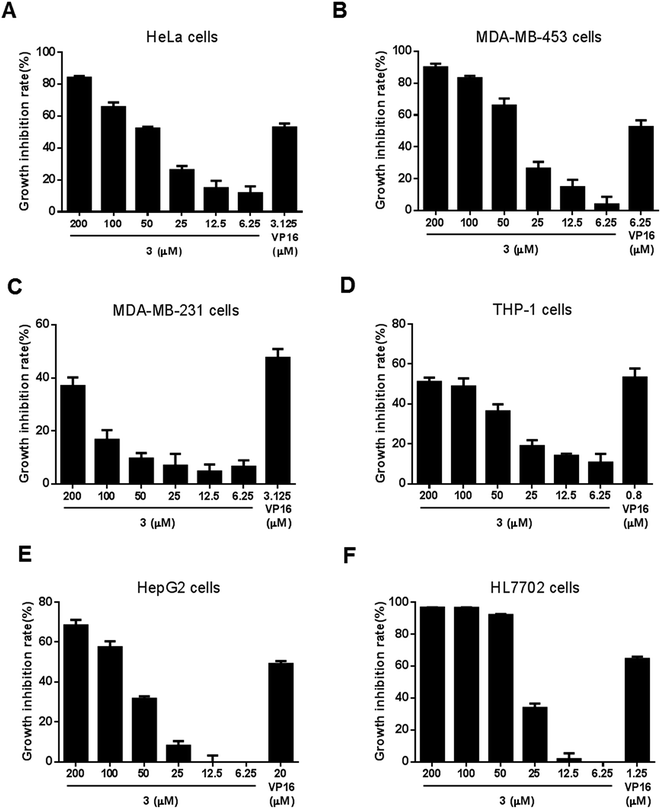 | ||
| Fig. 8 Cytotoxic activities against six human cell lines of compound 3. The cell growth inhibition was measured by SRB assay. VP16 was used as a positive control at the concentration of IC50. Data represented mean ± SD. These results were also presented in ESI Fig. S36 and S37.† | ||
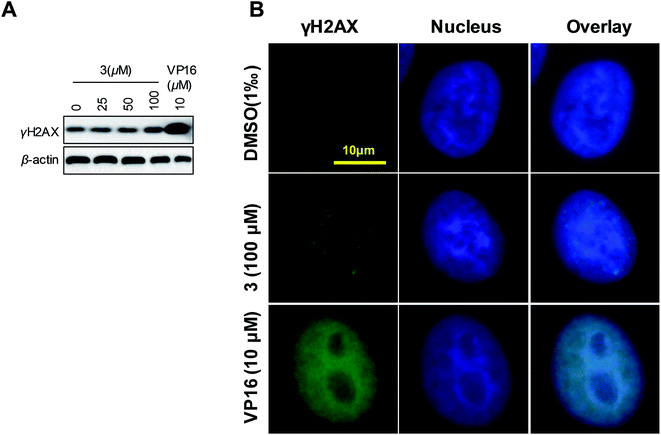
On the basic concept that topoisomerases inhibition generally lead to DNA damage, we further investigated the effect of 3 on DNA damage by evaluating the levels of γH2AX. Increasing γH2AX and cleaved PARP serve as the marker of cells undergoing DNA damage response and apoptosis, respectively. Western blot analysis revealed a slight increase in γH2AX and cleaved PARP levels in 3-treated HeLa cells compared with the control (Fig. 9A). To further identify the result that 3 induced DNA damage, we analyzed γH2AX foci by immunofluorescence. We observed a dotted increasing γH2AX foci in 3 treated cells (Fig. 9B). We concluded that 3 induced DNA damage in special region of genome. Hence, we supposed that, compare to VP16, 3 induced DNA damage in a site-selective manner. These results demonstrated that 3 appeared to induce DNA damage and apoptosis in HeLa cells.
Experimental
General experimental procedures
NMR spectra were recorded on a Bruker DRX-600 MHz and DRX-400 MHz NMR spectrometer (Bruker Daltonics Inc., Billerica, Massachusetts) with tetramethylsilane (TMS) as an internal standard. HR-ESIMS were measured on an LTQ-Orbitrap XL. Sephadex LH-20 was obtained from the GE Amersham Biosciences (Pis-cataway, New Jersey). Reversed-phase C-18 silica gel for column chromatography was obtained from Merck (Darmstadt, Germany). Silica gel GF254 for thin-layer chromatography (TLC) was purchased from Qingdao Marine Chemical Ltd (Qingdao, China). HPLC separations were mainly performed on three HPLC systems: Waters 1525 Binary HPLC Pump equipped with Waters 996 Photodiode Array Detector using Agilent Eclipse XDB-C18 column (5 μm, 9.4 × 250 mm); Waters 2545 Pump equipped with Waters 2998 Detector using Sunfire Prep OBD-C18 column (5 μm, 19 × 150 mm); Agilent 1260 instrument equipped with Agilent Eclipse XDB-C18 column (5 μm, 9.4 × 250 mm).Amplification of 16S rRNA gene sequences and taxonomical identification
The DNA preparations were used as template for partial 16S rRNA gene PCR amplifications applying the universal primers 27f and 1492r. The reaction mixture (50 μL) includes 10–100 ng genomic DNA, 20 pmol of each universal primer (27f: 5′ > AGAGTTTGATCMTGGCTCAG < 3′, 1492r: 5′ > TACGGYTACCTTGTTACGACTT < 3′), 1.6 μL dNTP (2.5 mmol L−1 each), 1.25 U of rtaq (TaKaRa Biotechnology Co., Dalian, China), 5 μL 10× PCR Buffer (Mg2+ Plus). The PCR cycling program was as following: initial denaturing for 10 min at 95 °C, 30 cycles of denaturation for 30 s at 94 °C, annealing for 30 s at 58 °C, extension for 60 s at 72 °C and final extension for 10 min at 72 °C. The amplicons were gel purified and bidirectional sequenced by Sanger method. The sequences of 16S rRNA were assigned into taxonomic ranks (genus) using Ribosomal Database Project (RDP) Classifier.24Amplification of AHBA gene sequences
For screening of AHBA synthase gene, PCR was performed in 1× GC buffer I (TaKaRa). Four degenerate primers (AHBA351, AHBA418, AHBA1080, AHBA1289) were designed to recover unexploited potential strains. The reaction mixture (20 μL) includes 10–100 ng genomic DNA, 5 pmol each primer (AHBA351: 5′ > GCSGTCACSAACGGSACSCAYGCSCTSGA < 3′, AHBA418: 5′ > ATCGTSCCSGCSTTCACSTTCATCTC < 3′, AHBA1080: 5′ > AYNCGGAACATSGCCATGTAGTG < 3′, AHBA1289: 5′ > SCGGTGGTGCAGCCASANGCMGT < 3′), 1.6 μL dNTP (2.5 mmol L−1 each), 0.5 U of Ex-taq (TaKaRa). The PCR cycling program was as following: initial denaturation for 10 min at 95 °C, 35 cycles of denaturation for 30 s at 94 °C, annealing for 30 s at 58 °C, extension for 30 s at 72 °C and final extension for 10 min at 72 °C. To avoid redundant work, two rounds of PCR screening were conducted. The first round of PCR amplification was performed at ten-strain level to identify the positive groups. The individual strains of positive group were subjected to the second round to identify the positive one. Positive PCR products were cloned into T vector and then sequenced and compared.25Strain and fermentation
Strain S012 was isolated from rhizosphere soil collected at Zhongshan Botanical Garden, Nanjing, China. It was identified as a Streptomyces species, according to the 16S rRNA sequence (GenBank accession no. KY411968). It was an AHBA synthase gene-positive strain according to PCR screening and was cultured in triangular flasks with oatmeal medium (oatmeal 30 g, saline salt 1 mL, pH 7.2) to afford a seed culture. The fermentation (30 L) was performed on oatmeal medium for 12 d at 28 °C in Petri dishes. The saline salt contained FeSO4·7H2O 0.1 g, ZnSO4·7H2O 0.1 g, MnCl2·4H2O 0.1 g, dd H2O 100 mL.Extraction and isolation
To extract the metabolites, the culture was diced and extracted three times overnight with EtOAc/MeOH (80![[thin space (1/6-em)]](https://www.rsc.org/images/entities/char_2009.gif) :
:![[thin space (1/6-em)]](https://www.rsc.org/images/entities/char_2009.gif) 20, v/v) at room temperature and partitioned between EtOAc and doubly-distilled water until the EtOAc layer was colorless. Then, the EtOAc soluble fraction was dried with sodium sulfate (anhydrous) and the solvent was removed under vacuum to afford the EtOAc extract. EtOAc extract was dissolved in 95% methanol and extracted five times with an equal volume of petroleum ether to afford the defatted MeOH extract (4.2 g).
20, v/v) at room temperature and partitioned between EtOAc and doubly-distilled water until the EtOAc layer was colorless. Then, the EtOAc soluble fraction was dried with sodium sulfate (anhydrous) and the solvent was removed under vacuum to afford the EtOAc extract. EtOAc extract was dissolved in 95% methanol and extracted five times with an equal volume of petroleum ether to afford the defatted MeOH extract (4.2 g).
The MeOH extract was fractionated by MPLC (145 g RP-18 silica gel; 30%, 50%, 70% MeOH–H2O and 100% MeOH, 1 L each, respectively) to afford 4 subfractions: Fr. 1–6 obtained from 30%, Fr. 7–11 from 50%, Fr. 12–21 from 70% and Fr. 22–30 from 100% MeOH. In accordance with the HPLC results, Fr. 1–4, Fr. 5–11, Fr.12–15 and Fr. 16–30 were combined and marked as Fr. A, Fr. B, Fr. C and Fr. D, respectively.
Fr. B was chromatographed over Sephadex LH-20 (120 g; MeOH) to afford: Fr. B1–B4. Fr. B4 was purified by reversed-phase HPLC (Waters 2545 instrument; Sunfire Prep OBD-C18, 19 × 150 mm, 5 μm, 15 mL min−1, UV 254 nm) eluted with 55% CH3CN to obtain ansavaricin H (3) (tR = 20.1 min, 5.2 mg).
Fr. C was chromatographed over Sephadex LH-20 (120 g; MeOH) to obtain Fr. C1–C4. The resulting Fr. C1 was purified by MPLC (145g RP-18 silica gel; 30%, 50%, 70% CH3CN and 100% MeOH, 600 mL each, respectively) to afford: Fr. C1a–C1e. Fr. C1d was further separated by MPLC (40 g RP-18 silica gel; 50%, 60%, 70%, 80% and 100% MeOH, 300 mL each, respectively) and finally purified by HPLC (Waters 1525 instrument; ZORBAX Eclipse XDB-C18 9.4 × 250 mm, 5 μm, 50% CH3CN, 3.5 mL min−1, UV 254 nm) to obtain ansavaricin F (1) (tR = 9.6 min, 5.0 mg).
Fr. D was further purified by Sephadex LH-20 (120 g) eluted with MeOH to give Fr. D1–D4. The resulting Fr. D3 was further separated by Sephadex LH-20 (120 g) using MeOH to yield four fractions (Fr. D3a–Fr. D3d). The fourth fraction, Fr. D3d, was further purified by MPLC (145 g RP-18 silica gel; 50%, 70%, 80%, 90% and 100% MeOH, 600 mL each, respectively) to afford Fr. D3d1–Fr. D3d5. Fr. D3d3 was further purified by MPLC (40 g RP-18 silica gel; CH3CN) and finally purified by HPLC (Waters 2545 instrument; Sunfire Prep OBD-C18, 19 × 150 mm, 5 μm, 60% CH3CN, 15 mL min−1, UV 254 nm) to yield ansavaricin I (4) (tR = 8.1 min, 3.1 mg). Fr. D3d5 was purified by reversed-phase HPLC (Waters 2545 instrument; Sunfire Prep OBD-C18, 19 × 150 mm, 5 μm, 70% CH3CN, 15 mL min−1, UV 254 nm) to obtain ansavaricin G (2) (tR = 8.8 min, 4.0 mg).
![[thin space (1/6-em)]](https://www.rsc.org/images/entities/char_2009.gif) ε): 222.0 (2.25), 268.0 (2.18); 1H and 13C NMR data, see Table 1; HRESIMS: m/z 682.2858 [M + H]+ (calcd for C36H44NO12+, 682.2858).
ε): 222.0 (2.25), 268.0 (2.18); 1H and 13C NMR data, see Table 1; HRESIMS: m/z 682.2858 [M + H]+ (calcd for C36H44NO12+, 682.2858).![[thin space (1/6-em)]](https://www.rsc.org/images/entities/char_2009.gif) ε): 218.0 (2.40), 270.0 (2.32); 1H and 13C NMR data, see Table 2; HRESIMS: m/z 664.2754 [M + H]+ (calcd for C36H42NO11+, 664.2752).
ε): 218.0 (2.40), 270.0 (2.32); 1H and 13C NMR data, see Table 2; HRESIMS: m/z 664.2754 [M + H]+ (calcd for C36H42NO11+, 664.2752).![[thin space (1/6-em)]](https://www.rsc.org/images/entities/char_2009.gif) ε): 224.0 (2.17), 272.0 (1.88); 1H and 13C NMR data, see Table 3; HRESIMS: m/z 678.2911 [M + H]+ (calcd for C37H44NO11+, 678.2909).
ε): 224.0 (2.17), 272.0 (1.88); 1H and 13C NMR data, see Table 3; HRESIMS: m/z 678.2911 [M + H]+ (calcd for C37H44NO11+, 678.2909).![[thin space (1/6-em)]](https://www.rsc.org/images/entities/char_2009.gif) ε): 220.0 (2.14), 270.0 (1.95); 1H and 13C NMR data, see Table 4; HRESIMS: m/z 692.3062 [M + H]+ (calcd for C38H46NO11+, 692.3065).
ε): 220.0 (2.14), 270.0 (1.95); 1H and 13C NMR data, see Table 4; HRESIMS: m/z 692.3062 [M + H]+ (calcd for C38H46NO11+, 692.3065).Topoisomerase I-mediated supercoiled DNA relaxation assay
The Topo I-mediated supercoiled DNA relaxation reactions were performed as Topo I (Takara) production description. The reaction mixture (20 μL) contained 35 mM Tris–HCl (pH 8.0), 72 mM KCl, 5 mM MgCl2, 5 mM DTT, 5 mM spermidine, 0.01% BSA, 0.25 μg of pBR322 DNA (Takara), and 1 unit of topoisomerase I (one unit is defined as the amount of enzyme required to fully relax 0.25 μg of pBR322 DNA for 30 min at 37 °C under standard assay conditions). Human topoisomerase I dilutions were performed in 1× Topo I reaction buffer without DNA. Reactions were carried out at 37 °C for 30 min and stopped by the addition of 2.5 μL 10× stop buffer (Takara). All reaction mixture were run at a 1% agarose without ethidium bromide (EB) and stained with EB for observation. DNA bands were imaged by ChemiDoc XRS + Imaging System (Bio-Rad) and quantified using the Image Lab Software. DNA relaxation inhibition rate was calculated by setting DNA cleavage inhibition levels of input DNA to 100%. Results were plotted using GraphPad Prism 6.Topoisomerase IIα-mediated supercoiled DNA relaxation assay
The Topo IIα-mediated supercoiled DNA relaxation reactions were performed as Topo IIα (Affymetrix) production description. The reaction mixture (20 μL) contained 10 mM Tris–HCl (pH 7.9), 50 mM NaCl, 50 mM KCl, 5 mM MgCl2, 0.1 mM EDTA, 15 μg mL−1 BSA, 1% glycerol, 1 mM ATP, 0.25 μg of pBR322 DNA, and 1 unit of Topo IIα. In the product information sheet, one unit of Topo IIα was defined as the amount of enzyme required to fully relax 0.25 μg of pBR322 DNA for 30 min at 37 °C under standard assay conditions. Human Topo IIα dilutions were performed in Topo IIα dilution buffer (10 mM NaH2PO4, pH 7.1, 50 mM NaCl, 0.2 mM DTT, 0.1 mM EDTA, 0.5 mg mL−1 BSA, 10% glycerol). Reactions were carried out at 37 °C for 30 min and stopped by the addition of 2.5 μL 10× stop buffer (Takara). All reaction mixture were run at a 1% agarose without ethidium bromide (EB) and stained with EB for observation. All reaction mixture were treated, resolved and analyzed as described above.kDNA decatenation assay
The kDNA decatenation reactions were performed as following description. A typical reaction mixture (20 μL) contained 10 mM Tris–HCl (pH 7.9), 50 mM NaCl, 50 mM KCl, 5 mM MgCl2, 0.1 mM EDTA, 15 μg mL−1 BSA, 1% glycerol, 1 mM ATP, 100 ng of kDNA (TopoGene), and 1 unit of Topo IIα. The definition of Topo IIα activity was as described above. Human Topo IIα dilutions were performed in Topo IIα dilution buffer (10 mM NaH2PO4, pH = 7.1, 50 mM NaCl, 0.2 mM DTT, 0.1 mM EDTA, 0.5 mg mL−1 BSA, 10% glycerol). Reactions were carried out at 37 °C for 30 min and stopped by the addition of 2.5 μL 10× stop buffer (Takara). All reaction mixture were run at a 1% agarose with ethidium bromide (EB). The decatenated kDNA maker was from TopoGene. All samples were imaged and analyzed as described above. DNA decatenation inhibition rate was calculated by setting DNA cleavage inhibition levels of input DNA to 100%.Cell proliferation inhibition analysis
The sulforhodamine B (SRB) assay is used for cell proliferation inhibition analysis, based on the measurement of cellular protein content. The human cancer cell lines HeLa, MDA-MB-453, MDA-MB-231, THP-1, HepG2 and HL7702 were purchased from Cellbank of Chinese Academy of Sciences. Culture the cells with a seeding density of 3000–8000 cells per well in 96 well plate. After cell attachment, the cells were exposed to test compound. The assay plate was incubated at 37 °C in a humidified incubator with 5% CO2 for 72 h. After remove cell culture medium, gently add 100 μL cold 10% (wt/vol) trichloroacetic acid (TCA) to each well, and incubate the plate at 4 °C for over 1 h. Wash the plate five times with slow-running tap water, and remove the excess water using paper towels. Add 100 μL of 0.4% (wt/vol) SRB solution to each well and stain for 10 min at room temperature. Then quickly rinse the plate five times with 1% (vol/vol) acetic acid to remove unbound dye, and allow them to dry at room temperature. Add 200 μL of 10 mM Tris base solution (pH 10.5) to each well and let the protein-bound dye be dissolved in 10 mM Tris base solution. Measure the OD at 570 nm in a microplate reader (Bio-Rad). Calculate the percentage of cell-growth inhibition using the formulate below.Western blot analysis
Western blot analysis was performed as following description. Cells were collected and lysed in cell lysis buffer (20 mM Tris–HCl, pH 7.4, 150 mM NaCl, 1% NP-40, 0.5% sodium deoxycholate and 0.1% SDS), which was supplemented with protease inhibitors cocktail (Roche) and phosphatase inhibitors cocktail (Roche). After centrifugation, cell lysates were sampled for SDS-PAGE and transferred to PVDF membrane (Millipore) for western blotting. The membrane was blocked with 5% BSA in TBST (50 mM Tris–HCl, 150 mM NaCl, 0.05% Tween 20, pH 7.6) for 1 h at room temperature. The membrane was then incubated with specific primary antibodies at 4 °C overnight. Afterward, the membrane was washed with TBST and probed with horseradish peroxidase-conjugated secondary antibodies (Abcam) for 1 h at room temperature. Detection of chemiluminescence signals was performed using ECL reagent (100 mM Tris–HCl, pH 8.5, 2.5 mM luminol, 0.4 mM p-coumaric acid, 5.4 mM H2O2) visualized on an ChemiDoc XRS+ imaging system (Bio-Rad).Conclusions
In summary, we isolated and characterized four new streptovaricin derivatives in which the ansa chains were not cyclized. Ansavaricin H (3) was confirmed to inhibit potently both Topo I and Topo IIα and displayed selectively inhibitory activities in vitro cytotoxicity-test. Experiments proved that 3 was more cytotoxic against HeLa and MDA-MB-453 cells than other tested cell lines. Compared to VP16, compound 3 induced DNA damage in a site-selective manner. Above all, compound 3 can be a novel scaffold for the development of site-selective genotoxic agents targeting topoisomerases. Moreover, this study also proves that PCR screening of AHBA synthase is an efficient approach to discover new ansamycins from microbial resources.Acknowledgements
This work was supported by a grant from the National Natural Science Foundation of China (81373304, 81530091, 81673317), the Taishan Scholars Project Specific Funding, and the Program for Changjiang Scholars and Innovative Research Team in University (IRT13028).Notes and references
- H. G. Floss and T. W. Yu, Chem. Rev., 2005, 105, 621–632 CrossRef CAS PubMed.
- Y. Fukuyo, C. R. Hunt and N. Horikoshi, Cancer Lett., 2010, 290, 24–35 CrossRef CAS PubMed.
- R. McCune, K. Dettschle, C. Jordahl, R. Des Pbez, C. Muschenheim and W. McDermott, Am. Rev. Tuberc. Pulm. Dis., 1957, 75, 659–666 CAS.
- V. Prelog and W. Oppolzer, Helv. Chim. Acta, 1973, 56, 2279–2287 CrossRef CAS.
- Q. Kang, Y. Shen and L. Bai, Nat. Prod. Rep., 2012, 29, 243–263 RSC.
- N. Zhu, P. Zhao and Y. Shen, Curr. Microbiol., 2008, 58, 87 CrossRef PubMed.
- Y. Wu, C. Lu, X. Qian, Y. Huang and Y. Shen, Curr. Microbiol., 2009, 59, 475–482 CrossRef CAS PubMed.
- C. Lu, Y. Li, J. Deng, S. Li, Y. Shen, H. Wang and Y. Shen, J. Nat. Prod., 2013, 76, 2175–2179 CrossRef CAS PubMed.
- S. Li, C. Lu, J. Ou, J. Deng and Y. Shen, RSC Adv., 2015, 5, 83843–83846 RSC.
- S.-R. Li, G.-S. Zhao, M.-W. Sun, H.-G. He, H.-X. Wang, Y.-Y. Li, C.-H. Lu and Y.-M. Shen, Gene, 2014, 544, 93–99 CrossRef CAS PubMed.
- G. Zhao, S. Li, Z. Guo, M. Sun and C. Lu, RSC Adv., 2015, 5, 98209–98214 RSC.
- J. Zhang, Z. Qian, X. Wu, Y. Ding, J. Li, C. Lu and Y. Shen, Org. Lett., 2014, 16, 2752–2755 CrossRef CAS PubMed.
- S. Li, Y. Li, C. Lu, J. Zhang, J. Zhu, H. Wang and Y. Shen, Org. Lett., 2015, 17, 3706–3709 CrossRef CAS PubMed.
- X. Li, J. Zhu, G. Shi, M. Sun, Z. Guo, H. Wang, C. Lu and Y. Shen, RSC Adv., 2016, 6, 88571–88579 RSC.
- S. Ito, G. Gilljams, B. Wahren, H. Wigzell, N. Yamamoto, K. Sasaki and K. Onodera, J. Antibiot., 1990, 43, 1045–1046 CrossRef CAS PubMed.
- W. M. Knoll, K. L. Rinehart Jr., P. F. Wiley and L. H. Li, J. Antibiot., 1980, 33, 249–251 CrossRef CAS PubMed.
- Z. Zhang, J. Zhang, R. Song, Z. Guo, H. Wang, J. Zhu, C. Lu and Y. Shen, RSC Adv., 2017, 7, 5684–5693 RSC.
- M. E. Rateb, W. E. Houssen, M. Arnold, M. H. Abdelrahman, H. Deng, W. T. A. Harrison, C. K. Okoro, J. A. Asenjo, B. A. Andrews, G. Ferguson, A. T. Bull, M. Goodfellow, R. Ebel and M. Jaspars, J. Nat. Prod., 2011, 74, 1491–1499 CrossRef CAS PubMed.
- A. H. J. Wang, I. C. Paul, K. L. Rinehart and F. J. Antosz, J. Am. Chem. Soc., 1971, 93, 6275–6276 CrossRef CAS PubMed.
- A. L. Staley and K. L. Rinehart, J. Antibiot., 1991, 44, 218–224 CrossRef CAS PubMed.
- C. Bailly, Chem. Rev., 2012, 112, 3611–3640 CrossRef CAS PubMed.
- M. Duca, D. Guianvarc'h, K. Oussedik, L. Halby, A. Garbesi, D. Dauzonne, C. Monneret, N. Osheroff, C. Giovannangeli and P. B. Arimondo, Nucleic Acids Res., 2006, 34, 1900–1911 CrossRef CAS PubMed.
- Y. Shen, W. Chen, B. Zhao, H. Hao, Z. Li, C. Lu and Y. Shen, Biochem. Biophys. Res. Commun., 2014, 453, 302–308 CrossRef CAS PubMed.
- Q. Wang, G. M. Garrity, J. M. Tiedje and J. R. Cole, Appl. Environ. Microbiol., 2007, 73, 5261–5267 CrossRef CAS PubMed.
- H. X. Wang, Y. Y. Chen, L. Ge, T. T. Fang, J. Meng, Z. Liu, X. Y. Fang, S. Ni, C. Lin, Y. Y. Wu, M. L. Wang, N. N. Shi, H. G. He, K. Hong and Y. M. Shen, J. Appl. Microbiol., 2013, 115, 77–85 CrossRef CAS PubMed.
Footnote |
| † Electronic supplementary information (ESI) available: Spectroscopic data and other relevant information for compounds 1–4. See DOI: 10.1039/c7ra00961e |
| This journal is © The Royal Society of Chemistry 2017 |

