 Open Access Article
Creative Commons Attribution 3.0 Unported Licence
Source separation of V and Fe by two-stage selective leaching during V extraction from stone coal
Yizhong Yuan *ab,
Yimin Zhang*abc,
Tao Liuabc,
Tiejun Chenabc and
Jing Huangabc
aCollege of Resources and Environment Engineering, Wuhan University of Science and Technology, Wuhan 430081, China. E-mail: yyz2038@163.com; zym126135@126.com; Tel: +86-159-27698430 Tel: +86-027-68862057
bHubei Provincial Engineering Technology Research Center of High efficient Cleaning Utilization for Shale Vanadium Resource, Wuhan 430081, China
cHubei Collaborative Innovation Center for High Efficient Utilization of Vanadium Resources, Wuhan 430081, China
First published on 27th March 2017
Abstract
A method of two stage selective leaching for separation of V and Fe during V extraction from stone coal was developed. In the primary procedure stone coal was roasted in an inert atmosphere at 900 °C for 1 h, and then the roasted product was leached for Fe removal in 7% (vol%) H2SO4 at 30 °C for 30 min when the liquid-to-solid ratio (L/S) was 3![[thin space (1/6-em)]](https://www.rsc.org/images/entities/char_2009.gif) :
:![[thin space (1/6-em)]](https://www.rsc.org/images/entities/char_2009.gif) 1 mL g−1. The Fe removal residue was then leached under the conditions of 20% (vol%) H2SO4, L/S = 2
1 mL g−1. The Fe removal residue was then leached under the conditions of 20% (vol%) H2SO4, L/S = 2![[thin space (1/6-em)]](https://www.rsc.org/images/entities/char_2009.gif) :
:![[thin space (1/6-em)]](https://www.rsc.org/images/entities/char_2009.gif) 1 mL g−1, at 95 °C for 4 h. In the first stage, 98.1% Fe could be removed from the roasted product with only 2.0% V loss. In the second stage, a 97.8% V leaching efficiency was obtained, which was 10.4% higher than the leaching efficiency of the roasted product using one-stage leaching. Based on the different solubilities in acid of muscovite and FeS, the decomposition product of pyrite at high temperature in an inert atmosphere, this method admirably prevented Fe from entering the V leaching liquor, realizing source separation of V and Fe during V extraction from stone coal.
1 mL g−1, at 95 °C for 4 h. In the first stage, 98.1% Fe could be removed from the roasted product with only 2.0% V loss. In the second stage, a 97.8% V leaching efficiency was obtained, which was 10.4% higher than the leaching efficiency of the roasted product using one-stage leaching. Based on the different solubilities in acid of muscovite and FeS, the decomposition product of pyrite at high temperature in an inert atmosphere, this method admirably prevented Fe from entering the V leaching liquor, realizing source separation of V and Fe during V extraction from stone coal.
1 Introduction
Stone coal, a type of V-bearing black shale, is an important vanadium resource in China due to its vast deposit amounts.1–3 Most of the V in stone coal exists as V(III) because of the reducing environment where stone coal forms, which readily replaces Al(III) as an isomorphism in structures of mica group minerals.1,4–6 Hence, the V in stone coal is stable and difficult to extract. At present, sulfuric acid leaching after high temperature roasting is widely used due to its good adaptability to raw materials, high efficiency and environmental characteristics.7–10 However, in the sulfuric acid leaching process, many other impurities such as Fe, Al, Mg, and P are always leached into the acid leaching liquor together with V. These impurities are detrimental to the recovery of vanadium from the acid leaching liquor.11,12 Particularly detrimental is Fe, a type of valence variable ion that mostly comes from the pyrite in stone coal, as it will seriously affect the enrichment process of V from the V leaching liquor and the final V-bearing products.8,13,14In most cases, V and Fe are separated from the acid leaching liquor by ion exchange, solvent extraction and chemical precipitation.11,15–19 The ion exchange process is usually used for V leaching liquors with a low impurity concentration and a low acidity.20–22 Solvent extraction has higher selectivity and adaptability for high acidity leaching liquor with a high impurity concentration. D2EHPA/TBP is the most popular extraction agent in V extraction from acid solution. It can effectively separate Fe and V when Fe is reduced into Fe(II).23,24 However, even with the use of an extraction agent with a high separation coefficient for V and Fe such as D2EHPA/TBP, Fe will still be co-extracted with V from the leaching liquor to some extent, thus affecting the quality of V-bearing products.23,25 Ye et al. developed another method for the separation of V and Fe, which primarily includes V co-precipitation with Fe in the liquor, V extraction by alkaline leaching from the precipitate, and V pentoxide preparation from the alkaline leaching liquor.13 High purity V-bearing product can be obtained, but it is a relatively long process with considerable V loss.
Based on the present research, it is clear that the separation efficiency of V and Fe is affected by the amount of Fe leached into the V leaching liquor. A lower amount of Fe in the V leaching liquor is clearly better for separating and purifying the V leaching liquor. Therefore, in this paper, a method detailing a two-stage selective leaching process for the separation of V and Fe was developed. This method realized source control of the Fe impurity during V extraction from stone coal.
2 Experimental section
2.1 Materials and thermodynamic analysis
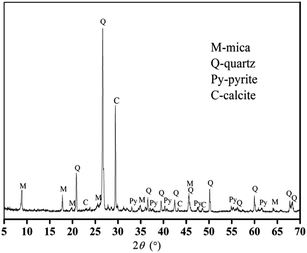
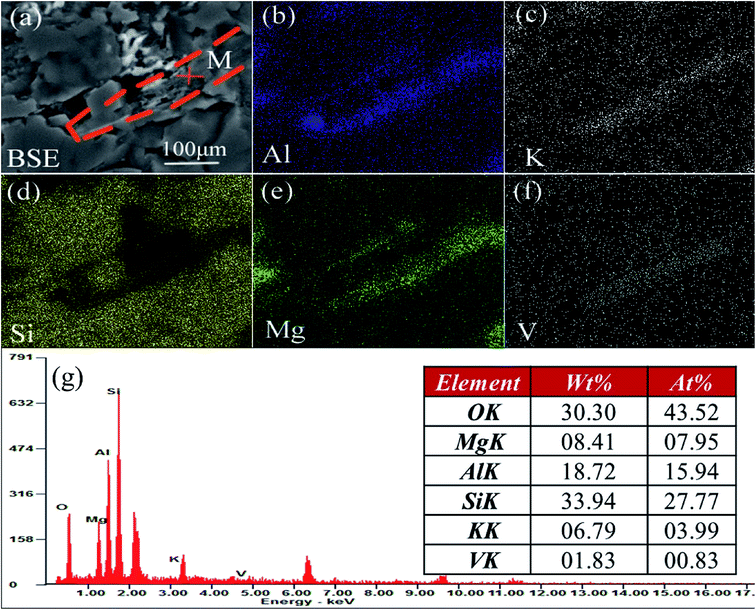
The V-bearing stone coal used in this study was obtained from Tongshan, Hubei province, China. The raw sample was crushed to 0–3 mm size using a jaw crusher (XPC-60 × 100) and a double-roll crusher (HLXPS-φ 250 × 150). To avoid the interference caused by sintering of fine particles, 1 to 3 mm stone coal particles were screened as the raw sample. The chemical composition analysis performed with ICP-AES showed that there was 0.37% V, 3.15% Fe and 3.40% S. Fig. 1 shows the XRD analysis of the raw sample conducted using a D/MAX-RB X-ray diffractometer. The main S-bearing mineral was pyrite, and the Fe in pyrite accounted for more than 95% in raw sample, as calculated from the S content.The electron probe analysis (EPMA) of the raw sample was performed with a JXA-8230 electron probe micro-analyzer, and the results are shown in Table 1. Most of the V in the raw sample was in mica group minerals.
| SiO2 | V2O5 | Al2O3 | FeO | MgO | CaO | Na2O | K2O | Minerals |
|---|---|---|---|---|---|---|---|---|
| 0.062 | 0.000 | 0.000 | 59.122 | 0.000 | 0.000 | 0.000 | 0.000 | Pyrite |
| 0.000 | 0.000 | 0.000 | 0.000 | 1.101 | 65.939 | 0.000 | 0.000 | Calcite |
| 98.349 | 0.000 | 0.000 | 0.000 | 0.000 | 0.000 | 0.000 | 0.000 | Quartz |
| 51.075 | 3.475 | 27.224 | 0.225 | 4.531 | 0.017 | 0.065 | 9.521 | Muscovite |
| 39.948 | 4.135 | 23.250 | 0.138 | 2.020 | 0.148 | 0.080 | 8.550 | Illite |
| 40.781 | 1.313 | 17.632 | 1.358 | 21.91 | 0.017 | 0.018 | 8.477 | Biotite |
As analyzed above, most of the Fe in the raw sample was from pyrite and most of the V was in mica group minerals. Hence, the main reactions of pyrite and mica group minerals during the roasting process and the acid leaching process should be considered. When pyrite is roasted in an oxidizing atmosphere and in an inert atmosphere, it transforms into Fe2O3 (eqn (1)) and Fe monosulfide (FeS) (eqn (2)), respectively.
| 4FeS2 + 11O2 → 2Fe2O3 + 8SO2↑ | (1) |
| 2FeS2 → 2FeS + S2 | (2) |
During the acid leaching process, the main reactions of acid with Fe-bearing minerals (Fe2O3 or FeS) and mica (in the form of muscovite, KAl2(AlSi3O10)(OH)2) could be expressed as eqn (3)–(5),26 respectively.
| Fe2O3 + 6H+ → 2Fe3+ + 3H2O | (3) |
| FeS + 2H+ → Fe2+ + H2S↑ | (4) |
| KAl2(AlSi3O10)(OH)2 + 10H+ → K+ + 3Al3+ + 3H4SiO4 | (5) |
Eqn (3)–(5) can be expressed as the following general formula:27
| aA + nH+ = bB + cH2O | (6) |
The Gibbs free energy at a particular T (in kelvin) (ΔGT) of eqn (6) could be expressed as eqn (7):
ΔGT = ΔGθT + RT![[thin space (1/6-em)]](https://www.rsc.org/images/entities/char_2009.gif) ln[αAb/αBa] + 2.303nRTpHT ln[αAb/αBa] + 2.303nRTpHT
| (7) |
When the reaction reaches equilibrium, ΔGT = 0:
 | (8) |
Assuming αA = αB = 1, then pHT can be defined as pHθT (the pH value of the reaction system when the reaction reaches equilibrium under standard condition), which can be expressed as eqn (9):
 | (9) |
pHθT represents the pH value of the reaction system when the reaction reaches equilibrium. Hence, it can be used to determine the solubility of the reactant; when the reaction has a higher pHθT value, the reactant is easier to dissolve in an acid solution.28,29 Based on the thermodynamic data,30 the relation of pHθT versus T of these equations is shown in Table 2, and the plot is displayed in Fig. 2. According to the pHθT value, the solubility order of Fe2O3, FeS and KAl2(AlSi3O10)(OH)2 in acid is FeS > KAl2(AlSi3O10)(OH)2 > Fe2O3. Theoretically, both FeS and Fe2O3 can undergo stepwise dissociation with muscovite by dilute acid and concentrated acid. However, it is well known that muscovite dissolves quite slowly in dilute acidic solution which results in harsh leaching condition for V leaching from stone coal.31,32 In highly concentrated acid (with leaching extract ratio), Fe2O3 and muscovite can dissolve resulting in massive Fe impurity in the V leaching solution.8,9 Contrarily, due to the excellent solubility of FeS in acidic solutions, a dilute acid solution is always used to clean the FeS scale on machinery in the oil industry.33,34 Therefore, because of the quite different solubilities in acid, FeS and muscovite might be efficiently separated using a dilute acidic solution in theory.
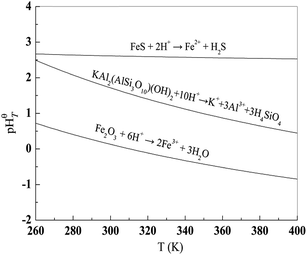 | ||
| Fig. 2 Plots of pHθT versus T of eqn (3)–(5). | ||
2.2 Procedure
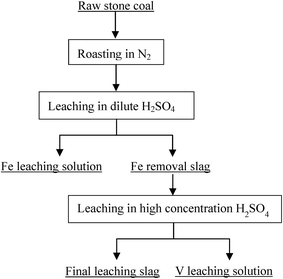
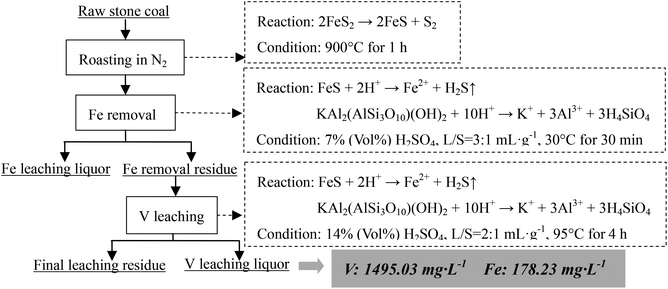
Based on the thermodynamic analysis of the raw sample, the procedure of the two-stage selective leaching for separation of vanadium and Fe in stone coal is shown in Fig. 3. First, 200 g of raw stone coal was roasted with an SGL-1700 pipe furnace equipped with an HQZ-IV gas distribution system in N2. The roasted products were ground in a vibration mill (HLXZM-100) until at least 75% of the particles were −0.074 mm. Then, 20 g roasted product was leached in a dilute sulfuric acid solution to remove the Fe in the roasted product with an SZCL-2A type magnetic and controlling temperature stirrer. The leaching pulp was solid–liquid separated, and the Fe removal residue was then leached in high concentration sulfuric acid solution to leach V.2.3 Testing method
SEM and SEM-EDS analyses of roasted product were conducted with a PHILIPS XL30 TMP Scanning Electron Microscope equipped with an EDAX PHOENIX energy spectrum analyzer.XRD analysis of the samples was performed with a D/MAX-RB X-ray diffractometer.
The Fe content in the Fe leaching liquor was determined by a phenanthroline spectrophotometric method,35 and the Fe removal efficiency of the roasted product was calculated using eqn (10):
 | (10) |
The V content in the Fe leaching liquor was determined by ammonium ferrous sulfate method,36 and the V loss efficiency was calculated using eqn (11):
 | (11) |
The V leaching efficiency was calculated using eqn (12):
 | (12) |
3 Results and discussion
3.1 Roasting experiment
![[thin space (1/6-em)]](https://www.rsc.org/images/entities/char_2009.gif) :
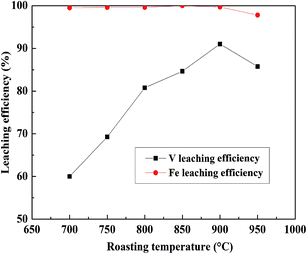
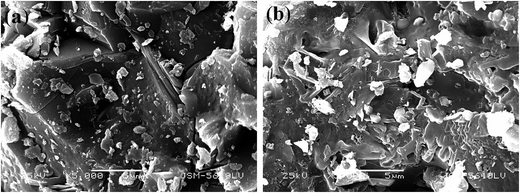
:![[thin space (1/6-em)]](https://www.rsc.org/images/entities/char_2009.gif) 1 mL g−1, 95 °C, 4 h, and the results are shown in Fig. 4. V leaching efficiencies of the roasted products increased with an increase in the roasting temperature, and above 900 °C, the decrease in the V leaching efficiency resulted from a sintering phenomenon.9,37 The SEM pictures of the roasted samples at 900 °C and 950 °C were showed in Fig. 5. It is obviously that the roasted product at 900 °C still had clear contour but it begin to melting at 950 °C. As for Fe, it had quite high efficiencies when the temperature form 700 °C to 900 °C, there was a slight decline after 900 °C which may also resulted by the sintering phenomenon. Hence, as the V and Fe efficiencies were considered, 900 °C was selected as a suitable roasting temperature.
1 mL g−1, 95 °C, 4 h, and the results are shown in Fig. 4. V leaching efficiencies of the roasted products increased with an increase in the roasting temperature, and above 900 °C, the decrease in the V leaching efficiency resulted from a sintering phenomenon.9,37 The SEM pictures of the roasted samples at 900 °C and 950 °C were showed in Fig. 5. It is obviously that the roasted product at 900 °C still had clear contour but it begin to melting at 950 °C. As for Fe, it had quite high efficiencies when the temperature form 700 °C to 900 °C, there was a slight decline after 900 °C which may also resulted by the sintering phenomenon. Hence, as the V and Fe efficiencies were considered, 900 °C was selected as a suitable roasting temperature.
![[thin space (1/6-em)]](https://www.rsc.org/images/entities/char_2009.gif) :
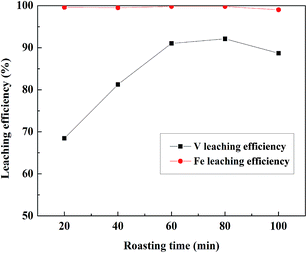
:![[thin space (1/6-em)]](https://www.rsc.org/images/entities/char_2009.gif) 1 mL g−1, 95 °C, 4 h; the results were shown in Fig. 6. Before 60 min, the V leaching efficiency increased with the increase in roasting time. When the roasting time exceeded 60 min, the V leaching efficiency no longer increased, and it decreased after 80 min. There were high Fe leaching efficiencies when the roasting time was form 20 to 80 min and there was a slight decline when the roasting time was 100 min. Therefore, 60 min was a suitable time for roasting based on the V and Fe leaching efficiencies.
1 mL g−1, 95 °C, 4 h; the results were shown in Fig. 6. Before 60 min, the V leaching efficiency increased with the increase in roasting time. When the roasting time exceeded 60 min, the V leaching efficiency no longer increased, and it decreased after 80 min. There were high Fe leaching efficiencies when the roasting time was form 20 to 80 min and there was a slight decline when the roasting time was 100 min. Therefore, 60 min was a suitable time for roasting based on the V and Fe leaching efficiencies.
3.2 Fe removal of the roasted product
![[thin space (1/6-em)]](https://www.rsc.org/images/entities/char_2009.gif) :
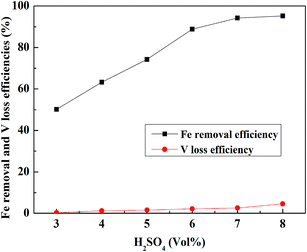
:![[thin space (1/6-em)]](https://www.rsc.org/images/entities/char_2009.gif) 1 mL g−1, a leaching temperature of 30 °C, and a leaching time of 30 min, and the result is shown in Fig. 9. The Fe removal efficiency and V loss efficiency increased with the increase in the H2SO4 concentration until 7% (vol%). After 7% (vol%), the Fe removal efficiency tended to be stable, but the V loss efficiency showed an obvious increase. Therefore, 7% (vol%) was selected as the suitable H2SO4 concentration.
1 mL g−1, a leaching temperature of 30 °C, and a leaching time of 30 min, and the result is shown in Fig. 9. The Fe removal efficiency and V loss efficiency increased with the increase in the H2SO4 concentration until 7% (vol%). After 7% (vol%), the Fe removal efficiency tended to be stable, but the V loss efficiency showed an obvious increase. Therefore, 7% (vol%) was selected as the suitable H2SO4 concentration.
![[thin space (1/6-em)]](https://www.rsc.org/images/entities/char_2009.gif) :
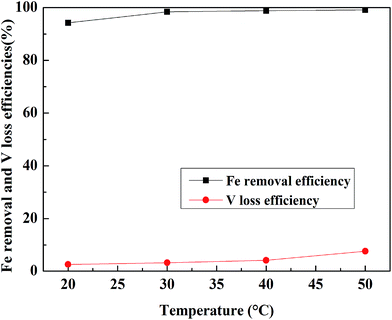
:![[thin space (1/6-em)]](https://www.rsc.org/images/entities/char_2009.gif) 1 mL g−1, and the leaching time was 30 min and the result is shown in Fig. 10. The Fe removal efficiency increased with an increase in temperature until 30 °C. When the temperature exceeded 30 °C, the Fe removal efficiency was more than 98% and was stable, but the V leaching efficiency increased faster. Hence, 30 °C was selected as the appropriate leaching temperature.
1 mL g−1, and the leaching time was 30 min and the result is shown in Fig. 10. The Fe removal efficiency increased with an increase in temperature until 30 °C. When the temperature exceeded 30 °C, the Fe removal efficiency was more than 98% and was stable, but the V leaching efficiency increased faster. Hence, 30 °C was selected as the appropriate leaching temperature.
![[thin space (1/6-em)]](https://www.rsc.org/images/entities/char_2009.gif) :
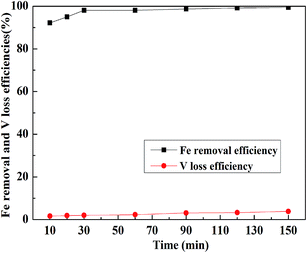
:![[thin space (1/6-em)]](https://www.rsc.org/images/entities/char_2009.gif) 1 mL g−1, and the temperature was 30 °C; the results are displayed in Fig. 11. When the leaching time was less than 30 min, the Fe removal efficiency quickly increased with the increase in time. After 30 min, it was more than 98% and remained stable and would hardly increase. However, the loss efficiency of vanadium showed a steady growth with the increase in leaching time. Therefore, the suitable leaching time for Fe removal was selected as 30 min.
1 mL g−1, and the temperature was 30 °C; the results are displayed in Fig. 11. When the leaching time was less than 30 min, the Fe removal efficiency quickly increased with the increase in time. After 30 min, it was more than 98% and remained stable and would hardly increase. However, the loss efficiency of vanadium showed a steady growth with the increase in leaching time. Therefore, the suitable leaching time for Fe removal was selected as 30 min.
According to the results of the Fe removal experiment for the roasted product, when the conditions were 7% (vol%) H2SO4, temperature of 30 °C, time of 30 min and L/S = 3![[thin space (1/6-em)]](https://www.rsc.org/images/entities/char_2009.gif) :
:![[thin space (1/6-em)]](https://www.rsc.org/images/entities/char_2009.gif) 1 mL g−1, 98.1% Fe removal efficiency with only 2.0% V loss was achieved.
1 mL g−1, 98.1% Fe removal efficiency with only 2.0% V loss was achieved.
3.3 V leaching of Fe removal residue
![[thin space (1/6-em)]](https://www.rsc.org/images/entities/char_2009.gif) :
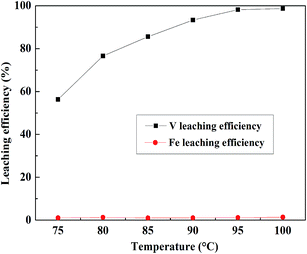
:![[thin space (1/6-em)]](https://www.rsc.org/images/entities/char_2009.gif) 1 mL g−1, and the leaching time was 4 h, and the result is presented in Fig. 12. The V leaching efficiency increased with an increase in temperature until 95 °C. When the leaching temperature continually increased from 95 °C to 100 °C, the V leaching efficiency increased from 97.8% to 98.6%, which was less than 1%. Because in Fe removal residue, most of the Fe had been removed, the Fe leaching efficiencies of the Fe removal slag were always low. Based on the V leaching efficiency, 95 °C was selected as the suitable leaching temperature.
1 mL g−1, and the leaching time was 4 h, and the result is presented in Fig. 12. The V leaching efficiency increased with an increase in temperature until 95 °C. When the leaching temperature continually increased from 95 °C to 100 °C, the V leaching efficiency increased from 97.8% to 98.6%, which was less than 1%. Because in Fe removal residue, most of the Fe had been removed, the Fe leaching efficiencies of the Fe removal slag were always low. Based on the V leaching efficiency, 95 °C was selected as the suitable leaching temperature.
![[thin space (1/6-em)]](https://www.rsc.org/images/entities/char_2009.gif) :
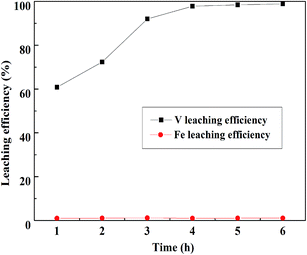
:![[thin space (1/6-em)]](https://www.rsc.org/images/entities/char_2009.gif) 1 mL g−1, and the temperature was 95 °C; the result is displayed in Fig. 13. The V leaching efficiency increased with the increase in leaching time until 4 h, there was no obvious improvement after 4 h. Therefore, 4 h was selected as the optimum leaching time of Fe removal residue.
1 mL g−1, and the temperature was 95 °C; the result is displayed in Fig. 13. The V leaching efficiency increased with the increase in leaching time until 4 h, there was no obvious improvement after 4 h. Therefore, 4 h was selected as the optimum leaching time of Fe removal residue.
![[thin space (1/6-em)]](https://www.rsc.org/images/entities/char_2009.gif) :
:![[thin space (1/6-em)]](https://www.rsc.org/images/entities/char_2009.gif) 1 mL g−1, leaching temperature of 95 °C and leaching time of 4 h; the result is shown in Fig. 14. Under the same leaching conditions, the V leaching efficiency of Fe removal residue was much higher than that of the roasted product. This means that after the first stage of leaching to remove Fe, a considerable amount of sulfuric acid could be saved during the V leaching stage of the Fe removal residue. Thus, 20% (vol%) H2SO4 was selected as the appropriate acid concentration to obtain 97.8% V leaching efficiency, and it was 10.4% higher than the leaching efficiency of the roasted product using one-stage leaching method.
1 mL g−1, leaching temperature of 95 °C and leaching time of 4 h; the result is shown in Fig. 14. Under the same leaching conditions, the V leaching efficiency of Fe removal residue was much higher than that of the roasted product. This means that after the first stage of leaching to remove Fe, a considerable amount of sulfuric acid could be saved during the V leaching stage of the Fe removal residue. Thus, 20% (vol%) H2SO4 was selected as the appropriate acid concentration to obtain 97.8% V leaching efficiency, and it was 10.4% higher than the leaching efficiency of the roasted product using one-stage leaching method.
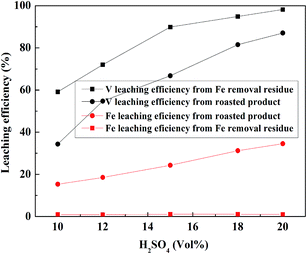 | ||
| Fig. 14 Effect of H2SO4 concentration on V leaching efficiency of Fe removal residue and roasted product. | ||
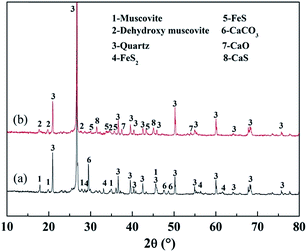
Fig. 15 shows the XRD analyses of the roasted product and the Fe removal residue. During the Fe leaching process, FeS and CaO in the roasted product, which are acid-consuming materials, had been mostly removed. Hence, more sulfuric acid could be used to dissolve the V-bearing mica group minerals, thus improving the V leaching efficiency. The SEM images shown in Fig. 16 indicated that there were more pores in the Fe removal residue than in the roasted product. These pores mainly resulted from dissolution of acid-consuming materials in the first stage of leaching, and they enhance the reactions of sulfuric acid with V-bearing minerals.
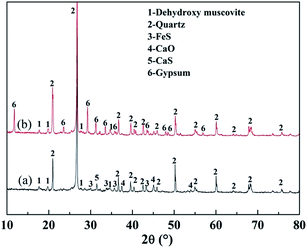 | ||
| Fig. 15 XRD analyses of roasted product and Fe removal residue ((a) roasted product; (b) Fe removal residue). | ||
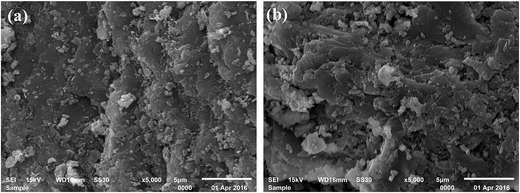 | ||
| Fig. 16 SEM pictures of Fe removal slag and roasted product ((a) roasted product; (b) Fe removal residue). | ||
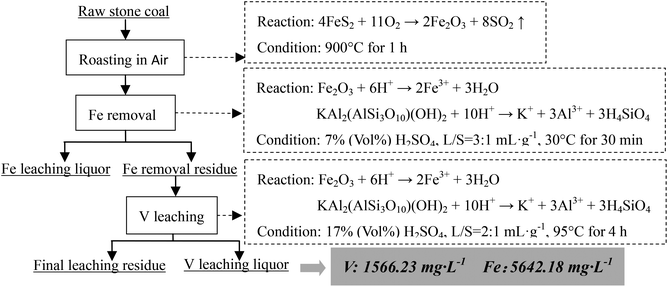
Based on the Fe removal efficiency and V leaching efficiency under this experimental condition, when the raw sample was roasted at 900 °C for 1 h and a similar V leaching efficiency was obtained (approximately 80%), the Fe and V contents of the final V leaching liquor from four different extraction methods could be compared as shown in Table 3 (the ratio of the final V leaching liquor volume to the solid sample mass was assumed to be 2![[thin space (1/6-em)]](https://www.rsc.org/images/entities/char_2009.gif) :
:![[thin space (1/6-em)]](https://www.rsc.org/images/entities/char_2009.gif) 1 mL g−1).
1 mL g−1).
Compared with one-stage leaching or two-stage leaching after roasting in air, two stages selective leaching after roasting in an inert atmosphere significantly decreased the Fe content in the final V leaching liquor. This method prevented Fe from entering the V leaching liquor which was the most obvious difference from the conventional methods. This method will greatly enhance the purification and enrichment of V leaching liquors.
4 Conclusions
As for the mica-type V-bearing stone coal in which most of the Fe was in the form of pyrite, 98.1% Fe removal efficiency, 2.0% vanadium loss efficiency and 97.8% V leaching efficiency could be achieved by a two-stage selective leaching. The appropriate procedure was that stone coal was roasted in an inert atmosphere at 900 °C for 1 h; the roasted product was leached in the first stage under conditions of 7% (vol%) H2SO4, L/S = 3![[thin space (1/6-em)]](https://www.rsc.org/images/entities/char_2009.gif) :
:![[thin space (1/6-em)]](https://www.rsc.org/images/entities/char_2009.gif) 1 mL g−1, 30 °C for 30 min; and then the residue was leached under conditions of 20% (vol%) H2SO4, L/S = 2
1 mL g−1, 30 °C for 30 min; and then the residue was leached under conditions of 20% (vol%) H2SO4, L/S = 2![[thin space (1/6-em)]](https://www.rsc.org/images/entities/char_2009.gif) :
:![[thin space (1/6-em)]](https://www.rsc.org/images/entities/char_2009.gif) 1 mL g−1, 95 °C for 4 h. In the first stage, Fe was efficiently removed from the roasted product with a minimal loss of vanadium. In the second stage, the V leaching efficiency of Fe removal residue was significantly enhanced due to the removal of acid-consuming materials in the previous residue. This method admirably prevented Fe from entering the V leaching liquor realizing source separation of V and Fe during V extraction from stone coal.
1 mL g−1, 95 °C for 4 h. In the first stage, Fe was efficiently removed from the roasted product with a minimal loss of vanadium. In the second stage, the V leaching efficiency of Fe removal residue was significantly enhanced due to the removal of acid-consuming materials in the previous residue. This method admirably prevented Fe from entering the V leaching liquor realizing source separation of V and Fe during V extraction from stone coal.
Acknowledgements
This study was supported a Project of the National Natural Science Foundation of China (No. 51474162 & No. 51404174).References
- Y. M. Zhang, S. X. Bao, T. Liu, T. J. Chen and J. Huang, Hydrometallurgy, 2011, 109, 116 CrossRef CAS.
- X. Y. Zhou, C. L. Li, J. Li, H. Z. Liu and S. Y. Wu, Hydrometallurgy, 2009, 99, 97 CrossRef CAS.
- M. T. Li, C. Wei, S. Qiu, X. J. Zhou, C. X. Li and Z. G. Deng, Hydrometallurgy, 2010, 104, 193 CrossRef CAS.
- G. H. Ye, S. Zhang, W. He, X. Tong and N. Wu, Chin. J. Rare Met., 2014, 39, 146 Search PubMed.
- Y. M. Zhang, X. B. Zhu, T. Liu, J. Huang and S. X. Bao, Hydrometallurgy, 2013, 138, 54 CrossRef CAS.
- Y. Z. Yuan, Y. M. Zhang, T. J. Chen, T. Liu, F. Wang and J. Liu, Chin. J. Rare Met., 2014, 38(3), 534 CAS.
- F. Wang, Y. M. Zhang, J. Huang, T. Liu, Y. Wang, X. Yang and J. Zhao, Rare Met., 2013, 32, 57 CrossRef CAS.
- F. Wang, Y. M. Zhang, T. Liu, J. Huang, J. Zhao, G. B. Zhang and J. Liu, Int. J. Miner. Process., 2014, 128, 40 CrossRef CAS.
- J. Zhao, Y. M. Zhang, J. Huang, T. Liu, F. Wang and J. Liu, Chin. J. Rare Met., 2013, 37, 446 CAS.
- Y. Z. Yuan, Y. M. Zhang, T. Liu and T. J. Chen, RSC Adv., 2017, 7, 1387 RSC.
- Y. Q. Ma, X. W. Wang, M. Y. Wang, C. J. Jiang, X. Y. Xiang and X. L. Zhang, Hydrometallurgy, 2015, 153, 38 CrossRef CAS.
- W. Li, Y. M. Zhang, T. Liu, J. Huang and Y. Wang, Hydrometallurgy, 2013, 131–132, 1 CrossRef CAS.
- P. H. Ye, X. W. Wang, M. Y. Wang, Y. Y. Fan and X. Y. Xiang, Hydrometallurgy, 2012, 117–118, 108 CrossRef CAS.
- J. X. Lv, Y. M. Zhang, T. Liu and J. Huang, Met. Mine., 2008, 382, 149 Search PubMed.
- L. Zeng, Q. G. Li and L. S. Xiao, Hydrometallurgy, 2009, 97, 194 CrossRef CAS.
- L. Zeng, Q. G. Li, L. S. Xiao and Q. X. Zhang, Hydrometallurgy, 2010, 105, 176 CrossRef CAS.
- W. Li, Y. M. Zhang, T. Liu, J. Huang and Y. Wang, Nonferrous Met., Extr. Metall., 2013, 5, 27 Search PubMed.
- X. W. Wang, M. Y. Wang, L. H. Shi, J. Hu and P. Qiao, Hydrometallurgy, 2010, 104, 317 CrossRef CAS.
- G. P. Hu, D. S. Chen, L. N. Wang, J. C. Liu, H. X. Zhao, Y. H. Liu, T. Qi, C. Q. Zhang and P. Yu, Sep. Purif. Technol., 2014, 125, 59 CrossRef CAS.
- J. Hu, X. W. Wang, L. S. Xiao, S. R. Song and B. Q. Zhang, Hydrometallurgy, 2009, 95, 203 CrossRef CAS.
- Q. G. Li, Z. Li, L. S. Xiao, Y. Y. Yang and Q. X. Zhang, Hydrometallurgy, 2009, 98, 287 CrossRef CAS.
- Q. G. Li, Q. X. Zhang, Z. Li, L. S. Xiao and Y. Y. Yang, Trans. Nonferrous Met. Soc. China, 2009, 19, 735 CrossRef CAS.
- X. B. Li, C. Wei, Z. G. Deng, M. T. Li, C. X. Li and G. Fan, Hydrometallurgy, 2011, 105, 359 CrossRef CAS.
- Y. H. Cao, Z. G. Gao, H. Z. Liu and Q. Li, Henan Chem. Ind., 2007, 24, 20 CAS.
- X. W. Liu, H. Y. Wu, Z. L. Dai and G. Y. Li, Min. Metall. Eng., 2006, 26, 65 CAS.
- J. Zhao, Y. M. Zhang, J. Huang, T. Liu, F. Wang and J. Liu, Nonferrous Met., Extr. Metall., 2013, 10, 27 Search PubMed.
- H. G. Li, Science of Hydrometallurgy, Central South University press, ChangSha, 2002, p. 48 Search PubMed.
- F. Huang, H. Wang, J. Q. Li and H. J. Yuan, Light Met., 2010, 5, 7 Search PubMed.
- J. Huang, Y. M. Zhang, J. Huang, T. Liu and N. N. Xue, Chin. J. Rare Met., 2016 Search PubMed , in press.
- X. W. Yang, Calculation Manual of Thermodynamic Data for High Temperature Aqueous Solution, Metallurgical industry press, Beijing, 1983, p. 143 Search PubMed.
- J. J. Zhong, C. Y. Wang and F. Yin, Int. J. Miner. Process., 2015, 138, 1 CrossRef.
- M. F. Jiang, Y. M. Zhang, S. X. Bao and X. Yang, Hydrometall. China, 2014, 33, 443 CAS.
- C. B. Liu, S. L. Zhao, P. Li, Z. H. Zhang and L. L. He, Clean. World, 2009, 25, 28 CAS.
- S. M. Li, J. X. Jiang, W. Fan and X. Peng, Pet. Refin. Eng., 2009, 39, 47 CAS.
- The Environmental Protection Industry Standard of The People's Republic of China, HJ/T-2007, Water-quality-Determination of Rion-phenanthroline spectrophotometry, 2007 Search PubMed.
- China Metallurgical Information and Standardization Institute, GB/T 8704.5-2007, Ferrovanadium-Determination of Vanadium Content-the Ammonium Ferrous Sulfate Titrimetric Method and the Potentiometric Titrimetric Method, 2007 Search PubMed.
- Y. Z. Yuan, Y. M. Zhang, T. Liu and T. J. Chen, Int. J. Miner., Metall. Mater., 2015, 22, 476 CrossRef CAS.
| This journal is © The Royal Society of Chemistry 2017 |

