 Open Access Article
Creative Commons Attribution 3.0 Unported Licence
Structure and performance of a V2O5–WO3/TiO2–SiO2 catalyst derived from blast furnace slag (BFS) for DeNOx†
Tuyet-Suong
Tran
ab,
Jian
Yu
*a,
Changming
Li
a,
Feng
Guo
a,
Yusheng
Zhang
a and
Guangwen
Xu
 *a
*a
aState Key Laboratory of Multi-phase Complex Systems, Institute of Process Engineering, Chinese Academy of Sciences, Beijing 100190, China. E-mail: yujian@ipe.ac.cn; gwxu@ipe.ac.cn; Tel: +86-10-82629912
bUniversity of Chinese Academy of Sciences, Beijing 100049, China
First published on 24th March 2017
Abstract
The titanium-bearing blast furnace slag (BFS), a solid waste with high TiO2 content (around 20%) and huge production (3.6 million tons per year), has caused serious environmental problems in China. The reuse of BFS in making DeNOx catalysts has been confirmed to be promising because of its low cost and high effectiveness for DeNOx. In this work, four V2O5–WO3/TiO2–SiO2 samples from BFS and commercial Ti/Si were made with different amounts of Al2O3/Fe2O3/SO42− dopants to reveal the unique structure effect of a slag-based catalyst on the catalytic behavior for DeNOx. Catalyst characterization clarified that the Al2O3/Fe2O3/SO42− dopants from BFS may facilitate the formation of Ti–O–Si linkages with abundant structure defects. The structure possibly played a key role in acquiring a high surface area, well-dispersed active VOx species, sufficient weak acid sites and a high amount of Oads and V4+ species for the slag-based catalyst. These advantages in structure were confirmed by catalytic tests showing superior DeNOx performances. Nonetheless, too many SO42− dopants caused agglomeration of TiO2–SiO2 particles, formation of strong acid sites and a high amount of Oads species to negatively impact the DeNOx activity, selectivity and catalyst lifetime.
1. Introduction
The vanadium-based catalysts, especially V2O5/TiO2 doped with WO3 or MoO3, have achieved great success in selective catalytic reduction (SCR) of NO with NH3 for their high activity and durability to SOx poisoning.1–14 Nevertheless, this kind of catalyst has a relatively high price, which restricts their wide use in combustion facilities of small to middle scale. On the other hand, the blast furnace slag (BFS), which contains about 20 wt% TiO2, is a massive solid waste from the iron-steel industry. In China, it amounts 3.6 million tons per year, and would cause serious environmental problems without efficient treatment and reuse.15,16 Considering the reuse of BFS as a Ti source, we have for the first time proposed the production of V–W–Ti catalysts for flue gas denitration (DeNOx) from the slag. The idea was confirmed to be effective to lower the cost of SCR catalysts and simultaneously provides a new pathway to fully utilize BFS.17Recent studies have shown that incorporation of some metal oxides such as Al2O3, SiO2, Fe2O3 and CeO2 into TiO2 support as mechanical promoters enhanced DeNOx catalytic performance of the resulting catalysts because the promoters likely improve the dispersion and thermal stability of catalytic components.3–7,18–23 Especially, TiO2–SiO2 has drawn particular attention because of its induced high DeNOx activity and low SO2 oxidation activity. The structural advantages from doping SiO2 are its enhanced dispersion and stabilization effects on anatase TiO2 and VOx species, together with the formation of more Brønsted acid sites needed for NO reduction.5–7,19 As a matter of fact, the TiO2–SiO2 support with different TiO2/SiO2 ratios can be easily prepared in one step from BFS as shown by our recent work.24 Besides providing low preparation cost as compared to methods based sol–gel or co-precipitation using pure chemicals, a distinguishing feature is its enabled high specific surface (427 m2 g−1) and better DeNOx performance in a wide temperature window of 250–400 °C for the prepared catalyst. However, the TiO2–SiO2 support made from BFS has to contain some unavoidable dopant oxides such as Al2O3 and Fe2O3 to challenge the understanding of relationship between structure and function of the BFS-derived DeNOx catalysts. It is thus necessary to deeply get insight into the structure of the BFS-derived catalysts for achieving their better applications.
The present work aims at revealing the structure effect of BFS-derived catalysts on their superior catalytic performance for DeNOx by SCR. Two catalysts on TiO2–SiO2 support but with different amounts of Al2O3/Fe2O3/SO42− dopants were prepared from BFS by controls of H2SO4 concentration and pH value in precipitation. The other two samples for comparison were prepared by traditional co-precipitation or sol–gel method using commercial inorganic or organic Ti/Si chemicals.25,26 The SiO2 content of all samples was nearly the same (about 0–10 wt%) as that in commercial SCR catalysts.5,27 The structure of catalysts was obtained through characterizations using XRD, TG, BET, XPS, TPR, SEM, TEM and FT-IR for both fresh and spent catalysts, and the relationship between structure and dopants was clarified through correlating catalytic performance for SCR of NO by NH3 and catalyst structure. This is further expected to deeply understand the mechanism of BFS-based DeNOx catalyts for their good performance of flue gas denitration.
2. Experimental section
2.1. Catalyst preparation
Raw materials used for TiO2–SiO2 preparation included blast furnace slag (BFS), titanium(IV) chloride (TiCl4) and colloidal silica (30 wt% SiO2 in water), or tetrabutyl titanate (Ti(OC4H9)4) and tetraethyl orthosilicate (Si(OC2H5)4). The BFS was water-quenched slag and from Panzhihua Iron & Steel Group Co., Ltd of China. Table 1 shows its composition obtained by XRF analysis. All other chemicals were all commercial products of reagent grade (Alfa Aesar). For comparison, a kind of commercial V–W–Ti SCR catalyst denoted as DKC ZERONOX® 993510537 was gotten from Chengdu Dongfang KWH Environmental Protection Catalyst Co., Ltd., China. This commercial monolithic honeycomb catalyst was crushed into powder and further evaluated to compare with the prepared catalysts.| TiO2 | SiO2 | MgO | CaO | Al2O3 | Fe2O3 | SO42− | Others | Particle size |
|---|---|---|---|---|---|---|---|---|
| 20.87 | 23.18 | 10.32 | 26.96 | 13.83 | 1.36 | 1.67 | 1.81 | <0.2 mm |
The TiO2–SiO2 supports used in making DeNOx catalysts were prepared from different precursors according to the technical routes shown in Fig. S1 (see ESI†). The first support denoted as S-BFS-1 was prepared from BFS by, in succession, digesting the slag in 70 wt% H2SO4 at 90 °C for 3 h; hydrolyzing the resulting solution containing TiOSO4/Si at pH = 1 and 110 °C for 5 h, washing the obtained H2TiO3 slurry using H2O, aqueous NH3 (10 wt%) and H2O again, and finally drying the filter cake to obtain the TiO2–SiO2 support. The second BFS-based support with different amounts of Al2O3/Fe2O3/SO42− dopants (S-BFS-2) was obtained via a similar procedure but its slag digestion used 60 wt% of H2SO4, hydrolysis did not have any pH adjustment and slurry washing to pH = 7 by using only distilled water. The detailed procedure for preparing the BFS-based supports can be found in our previous publications.17,24
Commercial Ti and Si precursors were also used to synthesize TiO2–SiO2 by co-precipitation and sol–gel methods. Following literature reports,28,29 TiCl4 and colloidal silica were used in co-precipitation, and the resulting precipitate was washed with distilled water and aqueous NH3 to get S-CP-TiCl4. Another TiO2–SiO2 support (S-SG-Organic) was made by sol–gel method from Ti(OC4H9)4 and Si(OC2H5)4 precursors.5,30 All samples had the similar SiO2 content and were calcined at 600 °C for 4 h in air to obtain catalyst supports.
With the preceding TiO2–SiO2 supports, all DeNOx catalysts were obtained by impregnating 5 wt% WO3 and 2 wt% V2O5. The impregnation slurry was continuously stirred at 60 °C until it became a paste. Then the paste was dried at 110 °C for 10 h and calcined at 600 °C for 4 h to get the V2O5–WO3/TiO2–SiO2 catalysts.24 Four catalysts were prepared and denoted as BFS-1, BFS-2, CP-TiCl4 and SG-Organic according to their different raw materials and synthesis methods used in preparing the TiO2–SiO2 supports.
2.2. Characterization and evaluation
Nitrogen adsorption/desorption isotherms were obtained using an ASAP 2020 (Micromeritics Instrument Corp.) working at 77 K. For all samples measured, they were degassed in vacuum at 150 °C for 6 h in prior to BET measurement. The Brunauer–Emmett–Teller (BET) equation was used to calculate the specific surface area (SBET) from the recorded isotherms. Pore size distribution was calculated from the adsorption curve using the Barrett–Joyner–Halenda (BJH) model. The nitrogen adsorption volume at a relative pressure (P/Po) of 0.994 was adopted in determining the pore volume and average pore size. The X-ray diffraction (XRD) pattern was performed in the 2θ angle from 10° to 90° on a D/Max-RB diffractometer (Rigaku Corp., Tokyo, Japan) having a Cu Kα radiation. FT-IR spectra were taken using a Tensor 27 (Bruker, Germany) in 400–4000 cm−1 with a resolution of 4 cm−1. For this, 1.0 mg dry powder was dispersed into 100 mg IR transmissive material (KBr), which was further pressed to obtain the transparent disks used for measurement.The bulk chemical composition of blast furnace slag and all the prepared supports were determined in an Axios X-ray fluorescence (XRF) spectrometer (PANalytical X'pert). The composition and oxidation state of elements presented on the surface of prepared catalysts were obtained using a X-ray photoelectron spectroscopy (XPS) working on an ESCALAB 250Xi electron spectrometer from Thermo Fisher Scientific Corporation (USA) using 100 W Al Kα radiation (hν = 1486.6 eV). A catalyst sample was put into its sample holder in advance and further degassed overnight at room temperature at a pressure of 10−9 mbar. Binding energies were corrected by referring to the binding energy 284.8 eV for C 1s. For all samples not containing carbon, such a C 1s signal in XPS spectra was from their adventitious carbon.
Surface morphology and cross-sectional structure of all prepared supports were characterized using a JSM-7001F scanning electron microscopy (SEM) of JEOL (Japan) working at an accelerating voltage of 10 kV, and further a JEM-2100 transmission electron microscopy (TEM) of JEOL working at 200 kV. All TEM samples were on a copper-supported carbon polymer grid, and a sample was formed by placing a few droplets (onto the grid) of a suspension made by dispersing ground sample into ethanol and in turn drying the droplets in room condition. The bulk and surface compositions of vanadium element in catalysts were determined using the Inductively Coupled Plasma-Optical Emission Spectrometry (ICP-OES, ICAP 6300, USA) and Energy Dispersive X-ray Spectroscopy (EDS) attached to a JSM-7001F SEM, respectively.
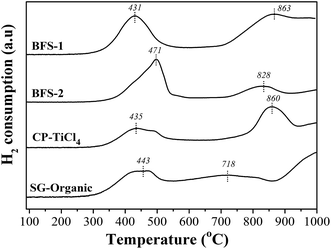
Thermogravimetry (TG) coupled with differential scanning calorimetry (DSC) was conducted on a Labsys Evo STA 1600 (Setaram Instrumentation) to characterize the weight change and endothermal–exothermal characteristics of TiO2-based supports and catalysts. The heating curves (TG/DSC) were recorded under inert atmosphere of argon at a heating rate of 10 °C min−1 in the range of 30–1000 °C. The presence of sulfate species in the sample was evaluated from the weight loss in the range in which the release of SO2 occurred. Both NH3-TPD and H2-TPR experiments were performed on an AutoChem II-2920s V5.02 equipment (Micromeritics Instrument Corp.) to obtain the surface acidity and redox properties of a sample. After loading 0.1 g sample into its quartz U-tube reactor and purged with He, the sample was heated from room temperature to 300 °C at 10 °C min−1 and maintained at this temperature for 60 min in He. Then, the sample was cooled to 80 °C, followed by NH3 adsorption for 1 h (10 vol% NH3 in He), and finally heated to 600 °C at 10 °C min to obtain NH3-TPD curve in 50 mL min−1 pure He. For H2-TPR analysis the sample was cooled to 90 °C and followed by heating it to 1000 °C at 20 °C min−1 in H2–He (10 vol% H2) gas at 50 mL min−1. The released NH3 or consumed H2 were continuously detected using a mass spectrometer (Proline MS, Ametek).
Catalytic activity for SCR of NO by NH3 was evaluated in an atmospheric quartz fixed bed reactor of 15 mm in internal diameter. The tested catalyst was powder of 0.15–0.2 mm in sizes, and the used simulated flue gas contained 0.06 vol% NO, 0.048 vol% NH3, 3 vol% O2, 5 vol% H2O, 0.06 vol% SO2, and balanced with N2. The tested model flue gases included NO–O2–N2, NO–O2–H2O–N2 and NO–O2–H2O–SO2–N2, and for each kind of gas its total flow rate through the reactor was kept at 400 mL min−1 (STP) to give a high Gas Hourly Space Velocity (GHSV) of 100![[thin space (1/6-em)]](https://www.rsc.org/images/entities/char_2009.gif) 000 h−1. The tested reaction temperature was in 150–500 °C and under each condition the test was last for 60 min. Molar concentrations for feeding and reacted gases were continually monitored in an ABB-AO2020 on-line flue gas analyzer (ABB). The realized NO conversion was calculated according to the measured inlet and outlet NO concentrations by
000 h−1. The tested reaction temperature was in 150–500 °C and under each condition the test was last for 60 min. Molar concentrations for feeding and reacted gases were continually monitored in an ABB-AO2020 on-line flue gas analyzer (ABB). The realized NO conversion was calculated according to the measured inlet and outlet NO concentrations by
3. Results and discussion
3.1. Characterization of TiO2–SiO2 supports
| Support | TiO2 | SiO2 | Fe2O3 | Al2O3 | SO42− | Others |
|---|---|---|---|---|---|---|
| S-BFS-1 | 87.72 | 9.17 | 1.38 | 0.59 | 0.39 | 0.75 |
| S-BFS-2 | 87.18 | 9.3 | 0.31 | — | 2.97 | 0.24 |
| S-CP-TiCl4 | 90.67 | 9.21 | — | — | 0.12 | — |
| S-SG-Organic | 90.72 | 9.28 | — | — | — | — |
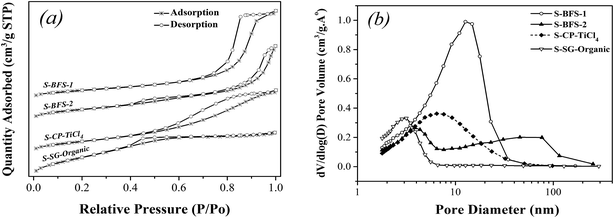 | ||
| Fig. 1 Nitrogen adsorption/desorption isotherms (a) and pore size distribution (b) of TiO2–SiO2 supports. | ||
| Sample | Textural properties of support | Elemental composition of catalyst | ||||||||
|---|---|---|---|---|---|---|---|---|---|---|
| Elemental bulk composition (ICP)b | Elemental surface composition (EDS)c | |||||||||
| BET (m2 g−1) | Pore size (nm) | Pore volume (cm3 g−1) | Crystallite sizea (nm) | V | Ti | V/Ti | V | Ti | V/Ti | |
| a Crystallite size of TiO2 was calculated from X-ray diffraction (XRD) data. b Actual bulk concentration was obtained by inductively coupled plasma (ICP). c Surface composition was obtained from energy dispersive X-ray spectroscopy (EDS) attached to SEM. | ||||||||||
| S-BFS-1 | 282.30 | 8.62 | 0.609 | 11.9 | 1.151 | 47.17 | 2.44 | 1.72 | 41.14 | 4.18 |
| S-BFS-2 | 137.91 | 8.50 | 0.293 | 16.6 | 1.147 | 45.68 | 2.51 | 0.93 | 45.2 | 2.06 |
| S-CP-TiCl4 | 164.07 | 6.95 | 0.285 | 13.48 | 1.125 | 46.18 | 2.44 | 1.65 | 57.36 | 2.88 |
| S-SG-Organic | 150.66 | 3.04 | 0.114 | 11.30 | 1.161 | 48.23 | 2.41 | 1.73 | 60.94 | 2.85 |
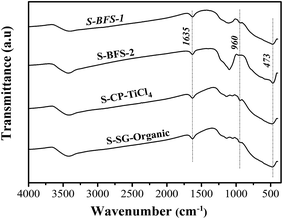
![[double bond, length as m-dash]](https://www.rsc.org/images/entities/char_e001.gif) O bonds, where the latter is associated with sulfate groups and anchored to TiO2–SiO2 surface.39,46
O bonds, where the latter is associated with sulfate groups and anchored to TiO2–SiO2 surface.39,46
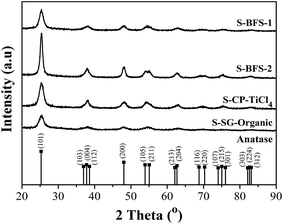
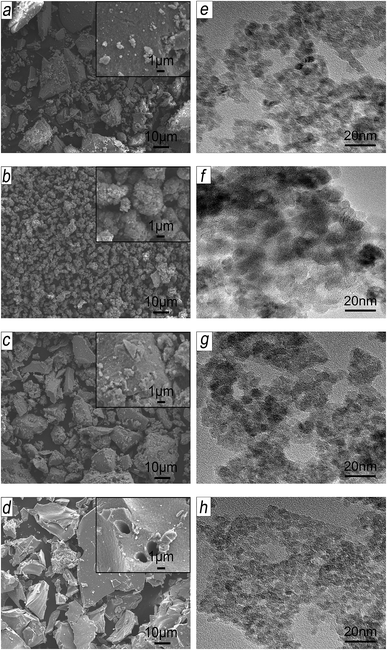
In summary, the supports made with the co-precipitation method, as compared to the sol–gel synthesis, displayed the similar morphological features and their rough porous surface provided the larger surface area. On the other hand, the dopants also greatly influenced the structure of synthesized TiO2–SiO2 such as size of crystallites, porous textures and particle agglomeration. The dopants Al2O3 and Fe2O3 (as in S-BFS-1) facilitated mesoporous structure, enlarged BET surface area as well as mesoporous size because they inhibited the growth of anatase TiO2 grain by their existence on TiO2 boundary. The presence of SO42− made the TiO2–SiO2 support easy to agglomerate to form meso–macro pores, having thus the obviously low surface area for S-BFS-2. These difference in porosity, surface area and crystallinity parameters of TiO2–SiO2 supports will greatly impact the catalysts made with them for SCR of NO with NH3 (flue gas DeNOx).
3.2. Evaluation of catalysts for DeNOx
Denitration catalysts were prepared by impregnated 2 wt% V2O5 and 5 wt% WO3 onto the preceding TiO2–SiO2 supports having different structures, properties and Fe2O3/Al2O3/SO42− dopants amounts. The SEM images and EDS spectra as well as mappings of Ti/V elements in Fig. S2–S5(b–e) shown in ESI† confirmed that all prepared V2O5–WO3/TiO2–SiO2 catalysts were composed of Ti, Si, Al, Fe, O, V, W elements, and the main active element V was highly dispersed into the lattice of entire TiO2 substrate.14 The ICP-OES and EDS results shown that all the catalysts had the similar bulk vanadium contents of about 1.1 wt% but different surface V concentrations (Table 3), showing essentially the varied interactions between V2O5 and support for different catalysts.13,14 In the following, DeNOx performance was evaluated to correlate the structure and dopants of supports with the catalytic performance for SCR of NO by NH3.
Fig. 6 shows the results of DeNOx performance over catalysts prepared using the preceding supports. At the same reaction conditions, all prepared catalysts except for BFS-2 enabled higher NO reduction than the reference DKC commercial catalyst did in the reaction temperature of 250–450 °C. The realized NO removal over DKC below 70% but it had a acceptably wide temperature window for DeNOx. The BFS-1 catalyst exhibited the best catalytic activity by having about 74% NO conversion in 300–450 °C under an NH3/NO ratio of 0.8 and GHSV of 100![[thin space (1/6-em)]](https://www.rsc.org/images/entities/char_2009.gif) 000 h−1. The manifested activity for CP-TiCl4 was between BFS-1 and SG-Organic catalysts. Although BFS-2 contained the highest sulfate, it showed the lowest activity among all prepared catalysts. Referring to the support compositions in Table 2, one can conclude that the proper amounts of Fe2O3 and Al2O3 dopants in catalytic support facilitated NH3-SCR reactions over V2O5–WO3/TiO2–SiO2 catalysts. Earlier studies have shown that the incorporation of Al2O3 (ref. 20, 21 and 47) of up to 10 wt% and Fe2O3 (ref. 4, 11 and 48) of up to 3 wt% into the TiO2 support are beneficial to NO reduction in NH3-SCR, and the catalyst has better thermal stability in comparison with conventional V2O5/TiO2 catalysts. Thus S-BFS-1 support should be a promising candidate for making inexpensive and highly active catalyst for flue gas DeNOx. Also, one can infer that the activity for DeNOx of TiO2–SiO2 supported catalysts was mainly subject to the dopants in support other than the precursors (materials) and preparation method. The presence of Fe2O3 (ref. 4 and 11) and Al2O3 (ref. 20 and 21) would positively work on DeNOx performance of the resulting catalyst, but too much SO42− (about 3 wt%) in support would lead to adverse impacts. Literature studies37,49,50 have reported that the presence of about 1 wt% sulfate in TiO2 and TiO2–SiO2 supports would promote NH3-SCR performance of the resulting catalyst because of its increase in catalyst acidity and facilitation in oxidation of NO into nitrate and transformation of monomeric vanadate into polymeric vanadate on catalyst surface.
000 h−1. The manifested activity for CP-TiCl4 was between BFS-1 and SG-Organic catalysts. Although BFS-2 contained the highest sulfate, it showed the lowest activity among all prepared catalysts. Referring to the support compositions in Table 2, one can conclude that the proper amounts of Fe2O3 and Al2O3 dopants in catalytic support facilitated NH3-SCR reactions over V2O5–WO3/TiO2–SiO2 catalysts. Earlier studies have shown that the incorporation of Al2O3 (ref. 20, 21 and 47) of up to 10 wt% and Fe2O3 (ref. 4, 11 and 48) of up to 3 wt% into the TiO2 support are beneficial to NO reduction in NH3-SCR, and the catalyst has better thermal stability in comparison with conventional V2O5/TiO2 catalysts. Thus S-BFS-1 support should be a promising candidate for making inexpensive and highly active catalyst for flue gas DeNOx. Also, one can infer that the activity for DeNOx of TiO2–SiO2 supported catalysts was mainly subject to the dopants in support other than the precursors (materials) and preparation method. The presence of Fe2O3 (ref. 4 and 11) and Al2O3 (ref. 20 and 21) would positively work on DeNOx performance of the resulting catalyst, but too much SO42− (about 3 wt%) in support would lead to adverse impacts. Literature studies37,49,50 have reported that the presence of about 1 wt% sulfate in TiO2 and TiO2–SiO2 supports would promote NH3-SCR performance of the resulting catalyst because of its increase in catalyst acidity and facilitation in oxidation of NO into nitrate and transformation of monomeric vanadate into polymeric vanadate on catalyst surface.
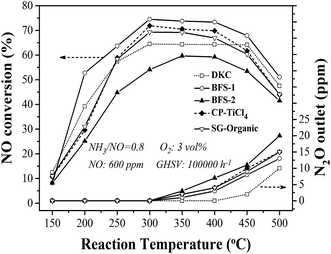 | ||
| Fig. 6 NO conversion and N2O formation varying with reaction temperature for prepared and commercial DKC catalysts. | ||
The generation of N2O during NH3-SCR was also tested. At temperatures above 350 °C, ammonia would be partially oxidized to N2O,3,7 but only negligible N2O (3 ppm) was formed at 450 °C over DKC (see Fig. 6). The formed N2O amount at 350–500 °C over all catalysts followed a sequence of BFS-2 > CP-TiCl4 ≈ SG-Organic > BFS-1 > DKC. In term of composition and structure features, the low emission of N2O at high temperatures over BFS-1 catalyst should be related to its presence of Al2O3 and Fe2O3 dopants. Hence, the type of dopants is critical to achieve the expected high N2 selectivity of catalyst for SCR of NO by NH3.
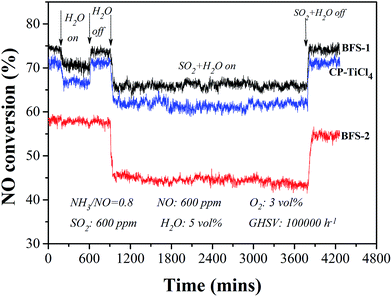
The tolerance to poisoning of SO2 and steam was tested by feeding 5 vol% steam and 600 ppm SO2 at 300 °C in a stable SCR reaction lasting for a few hours under GHSV of 100![[thin space (1/6-em)]](https://www.rsc.org/images/entities/char_2009.gif) 000 h−1. As shown in Fig. 7, the presence of both SO2 and H2O in the reactant (fed) gas caused obvious loss of DeNOx activity from the case with only H2O (steam) feed. Having only 5 vol% H2O in gas the absolute drop of NO conversion was 2.6%, 3.5% respectively over the BFS-1, CP-TiCl4 catalysts, meanwhile the deactivation nearly was not seen over sulfated TiO2–SiO2 supported catalyst (BFS-2). The interaction of sulfate species with adsorbed water can cause the formation of Brønsted acid sites to promote the NH3 adsorption, which may compensate the degree of the loss of its DeNOx efficiency.39,51 Stopping H2O feed, NO conversions were fully reversible for all catalysts, indicating that this inhibition is due to competitive adsorption of H2O and NH3 on active sites.1,46
000 h−1. As shown in Fig. 7, the presence of both SO2 and H2O in the reactant (fed) gas caused obvious loss of DeNOx activity from the case with only H2O (steam) feed. Having only 5 vol% H2O in gas the absolute drop of NO conversion was 2.6%, 3.5% respectively over the BFS-1, CP-TiCl4 catalysts, meanwhile the deactivation nearly was not seen over sulfated TiO2–SiO2 supported catalyst (BFS-2). The interaction of sulfate species with adsorbed water can cause the formation of Brønsted acid sites to promote the NH3 adsorption, which may compensate the degree of the loss of its DeNOx efficiency.39,51 Stopping H2O feed, NO conversions were fully reversible for all catalysts, indicating that this inhibition is due to competitive adsorption of H2O and NH3 on active sites.1,46
Feeding SO2 and steam simultaneously revealed that the realized NO conversion was stable but further dropped by 8%, 10% respectively for BFS-1 and CP-TiCl4 catalysts from the flue gas without presence of SO2 and steam, furthermore shutting off the feeding of both SO2 and steam, their DeNOx activity were recovered quickly to their initial high value. At the analogous reaction conditions, the activity over BFS-2 dropped by 12.7% and decreased gradually afterwards, besides its recovery of catalytic performance was gradual and the performance could not rebound to the original after cutting off SO2 and steam in fed gas. Thus, high sulfate content in catalyst is not good for tolerance to the poisoning of steam and SO2 because the formed Brønsted acid sites and long-term exposure to SO2 containing in flue gas can lead to the formation of ammonium sulfates (NH4HSO4 and (NH4)2SO4) on catalysts easily,1,2,30,46 which would cause similar deactivation for all catalysts. In summary, the impurities Al2O3/Fe2O3 (excluding SO42−) not only enhanced DeNOx activity and selectivity of the prepared catalyst but also positively affected the resistance of the catalyst to poisoning by water and SO2 in SCR of NO.20,52 Obviously, BFS-1 is the most active and robust catalyst for DeNOx application to actual flue gases.
Correlating with structure of catalyst supports found that the preceding catalytic activities for DeNOx increased with increasing the surface area of supports. Indeed, large pore volume and high surface area of a catalyst would improve its catalytic activity by facilitating spread of reactant molecules (NO) or reaction intermediates to active sites in catalyst's meso-structure framework.30,33,53 The catalyst BFS-1 showed high NO reduction capability (about 74% reduction) at 300–450 °C under high GHSV of 100![[thin space (1/6-em)]](https://www.rsc.org/images/entities/char_2009.gif) 000 h−1. Agglomeration observed on BFS-2 reduced its BET surface and also blocked some active sites, which caused thus the instability of the catalyst in gas containing both of steam and SO2.43 Thus, the texture and morphology of support importantly affect the catalytic performance of V2O5–WO3/TiO2–SiO2 for DeNOx by NH3. The BFS-1 catalyst with the relatively low crystallinity exhibited the best DeNOx activity, possibly owing to its special acid sites and large BET surface area to have highly dispersed vanadia on catalyst surface, as further justified below.
000 h−1. Agglomeration observed on BFS-2 reduced its BET surface and also blocked some active sites, which caused thus the instability of the catalyst in gas containing both of steam and SO2.43 Thus, the texture and morphology of support importantly affect the catalytic performance of V2O5–WO3/TiO2–SiO2 for DeNOx by NH3. The BFS-1 catalyst with the relatively low crystallinity exhibited the best DeNOx activity, possibly owing to its special acid sites and large BET surface area to have highly dispersed vanadia on catalyst surface, as further justified below.
3.3. Justification of catalytic activities
| Catalyst | Acidity: NH3 desorption (mmol g−1) | Redox properties: H2 consumption (mmol g−1) | ||||
|---|---|---|---|---|---|---|
| Weak acid | Strong acid | Total | VOx reduction | WOx reduction | Total | |
| BFS-1 | 0.317 | — | 0.317 | 0.316 | 0.126 | 0.442 |
| BFS-2 | 0.073 | 0.075 | 0.148 | 0.299 | 0.071 | 0.370 |
| CP-TiCl4 | 0.210 | — | 0.210 | 0.158 | 0.169 | 0.327 |
| SG-Organic | 0.139 | — | 0.139 | 0.122 | 0.067 | 0.189 |
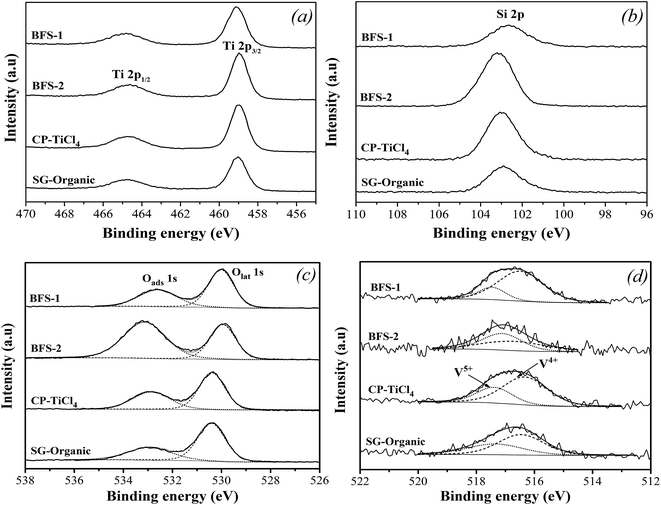
Fig. 10c shows interesting feature of O 1s XPS spectra. All catalysts are characterized by complex profiles to indicate the presence of different oxygen chemical bonds. The BE around 533 eV is attributed to the surface adsorbed oxygen (denoted as Oads), such as O22− or O− belonging to defect-oxide or hydroxyl-like group. Another peak located around 530 eV corresponds to the lattice oxygen atom O2− (denoted as Olat), indicating a mainly single chemical environment surrounding the photo emitting oxygen.25,26 Against the Olat for catalyst based on pure TiO2, the upward shifts in BE of O 1s peak for all other catalysts clarified a substitution of Ti atoms by other higher electronegativity elements like Si, Al, Fe, S.5,25,26 For BFS-2, the upward shift of O 1s peak was more pronounced, as recognized from the broad Oads peak, which reflects a more electronegative environment around oxygen atom due to the strong electron affinity by S6+ in SO42−.
Table 5 shows the surface Oads/O ratios of all samples. The slag-based catalysts had notably high Oads/O ratios. The more Oads on surface should result from the more defects created by the Al2O3, Fe2O3, SO42− dopants. The Oads is usually considered to be beneficial for NO oxidation into NO2 in SCR reactions, thereby facilitating “fast SCR” reaction and enhancing DeNOx efficiency at low temperatures.5,18 Thus, the more surface adsorbed oxygen Oads should be responsible for the better catalytic performance of BFS-1. However, a very high Oads/O ratio, such as for BFS-2, means an excessive oxidation ability, which is harmful to SCR reaction owing to its induced strong ammonia oxidation that forms nitrogen oxide byproducts to narrow the temperature window of SCR and to generate more N2O (Fig. 6).56
| Catalyst | Surface atomic concentration (at.%) | Surface atomic ratiosa, % | |||||
|---|---|---|---|---|---|---|---|
| Ti 2p | Si 2p | O 1s | V 2p | W 4f | Oads/O | V4+/V | |
| a Calculated from the ratio of peak area of XPS spectra. | |||||||
| BFS-1 | 22.28 | 9.86 | 64.78 | 0.82 | 2.26 | 48.24 | 80.37 |
| BFS-2 | 13.18 | 19.09 | 66.26 | 0.24 | 1.23 | 63.02 | 48.89 |
| CP-TiCl4 | 20.63 | 11.26 | 65.51 | 0.68 | 1.93 | 40.96 | 69.15 |
| SG-Organic | 19.46 | 12.17 | 65.19 | 0.65 | 2.53 | 34.83 | 60.66 |
The XPS spectra in Fig. 10d presents the chemical states of vanadium. In all prepared catalysts, two peaks representing V5+ and V4+ were detected in the range of 516.4–517.1 eV and 515.7–516.2 eV, respectively.5,7Table 5 listed surface atom concentrations and peak-fitting results of O 1s and V 2p spectra. We can see that BFS-1 had the highest surface V to indicate the best dispersion of vanadium species in the catalyst. Combining with the BET results in Fig. 1, the surface V signals are well related with the BET area of the four catalysts, meaning that high BET area is in favor of dispersion and exposure of vanadium species. Moreover, the non-stoichiometric V4+ species can improve the NO reduction ability of catalyst due to its high mobility and activation of electron transfer.5,7,21 Consequently, the realized DeNOx efficiency for all catalysts are proportionally correlated with the amount of V4+ ratio on their surfaces shown in Table 5. The BFS-1 catalyst had the highest BET area, best dispersion of surface vanadium species and largest V4+/V ratio, thus it was rich in active vanadium sites on its surface to ensure its good catalytic performance in SCR of NO. Furthermore, Table 3 shows that the surface V/Ti ratio of BFS-1, CP-TiCl4 and SG-Organic catalysts were higher than their bulk ratios, suggesting that V2O5 was mainly dispersed on their catalyst surface. The surface V/Ti ratio of BFS-2 was lower than its bulk ratio, implying that its vanadium mainly existed in the inside of catalysts.57 The BFS-2 catalyst had consequently poor DeNOx performance as was tested.
| Catalyst | Fresh catalysts | Spent catalysts | ||||
|---|---|---|---|---|---|---|
| Surface area (m2 g−1) | Pore volume (cm3 g−1) | Surface area (m2 g−1) | Pore volume (cm3 g−1) | TG loss in 250–550 °C (%) | TG loss for >550 °C (%) | |
| BFS-1 | 144.86 | 0.436 | 133.64 | 0.409 | — | 3.6 |
| BFS-2 | 115.63 | 0.290 | 90.22 | 0.218 | 4.0 | 7.5 |
| CP-TiCl4 | 136.42 | 0.270 | 121.43 | 0.232 | — | 3.8 |
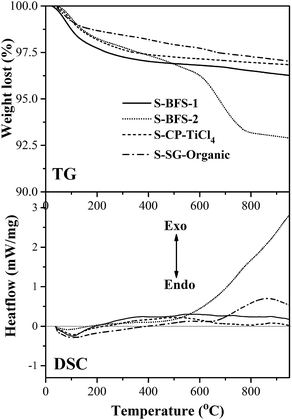
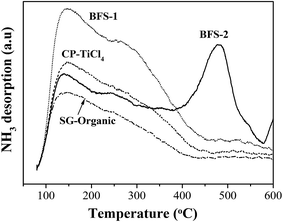
The most serious poisoning suffering for BFS-2 in Fig. 7 was further verified by the high amount of sulfate existing on its spent catalyst (see TG data in Table 6). The weight loss at 250–550 °C represents the decomposition of ammonium sulfate salts,22 which was observed only for spent BFS-2 catalyst. Considering its high SO42− content and abundant strong acid sites in 400–600 °C shown by NH3-TPD experiment, this catalyst is easier to accommodate irreversible ammonium salts during SCR of NO, which thus decreased catalyst lifetime and was hard to regenerate. The meso–macro PSDs of BFS-2 would also facilitate accommodation of ammonium salts during SCR.58 For mesoporous BFS-1 and CP-TiCl4 catalysts that had only weak acid sites, their ammonium salts in pores could be evaporated to greatly restore blocked pores and surfaces, thereby recovering their DeNOx activity after stopping the SO2 and steam feed into the tested flue gas. The mass loss occurred at 500–850 °C provided an evidence for the sulfate ions incorporated into TiO2 lattice (stable metal sulfates). This also decreased the pore volume of catalysts, especially for spent BFS-2, and suggested structure damage and irreversible deactivation of BFS-2 catalyst for SCR of NO.9
As a summary, we can see that all spent catalysts lost their surface area in comparison with their fresh catalysts due to the formation of sulfate salts, especially for BFS-2 catalyst. This is the primary reason for the irreversible deactivation of catalyst for SCR of NO. On the other hand, too much doped SO42− in catalyst such as BFS-2 and too many strong acid sites would cause serious generation of ammonium sulfate species to block active sites and collapse pore structure of catalyst. With suitable content of SO42− dopant (below 1 wt%) in BFS-1, it increased NH3 adsorption capacity and surface Oads/O ratio to improve the DeNOx performance.
4. Conclusions
Four V2O5–WO3/TiO2–SiO2 samples with different amounts of Al2O3/Fe2O3/SO42− dopants prepared from blast furnace slag (BFS) containing Ti/Si and also commercial Ti/Si sources were characterized to reveal the relationship among performance, structure and preparation method of catalyst. Results shown that the BFS-based catalysts with proper amounts of Al2O3/Fe2O3/SO42− dopants exhibited excellent catalytic activity, selectivity and stability to ensure the high NO reduction capability (about 74% reduction) at temperatures of 300–450 °C and NH3/NO ratio of 0.8. The performance is much better than that realized by the catalyst made by co-precipitation or sol–gel methods using commercial Ti/Si sources. Characterization demonstrated that the Al2O3/Fe2O3 dopants acquired from using BFS prevented agglomeration of Ti–Si composite oxides and facilitated the formation of abundant Ti–O–Si linkages that led to good interspersion of Ti–Si components and high surface area of the resulting TiO2–SiO2 support. Reflecting on catalyst, the high surface area of TiO2–SiO2 support facilitated dispersion of active surface vanadium species, lowered reduction temperature of vanadium oxides and provided sufficient weak acid sites to create enough active surface V sites for high NH3 adsorption capacity and active catalytic activity in SCR of NO over the catalyst. On the other hand, the proper amount of Al2O3/Fe2O3/SO42− dopants in a catalyst can also create more defects in its TiO2–SiO2 support to generate adsorptive O (Oads species) on the catalyst surface which is required for fast SCR reaction and high DeNOx efficiency. A small amount of SO42− in catalyst would increase the weak acid sites and form proper Oads species on the surface, whereas too high content of SO42− caused agglomeration of TiO2–SiO2 particles to form many strong acid sites and too many Oads species. The latter actually led to severe oxidation of NH3 and obvious formation of stable sulfate salts to decrease consequently the DeNOx activity, selectivity and lifetime of the corresponding catalyst. Overall, the article demonstrated excellent DeNOx performances for a catalyst made using BFS because of its presence of proper amounts of Al2O3/Fe2O3/SO42− as the catalyst dopants or impurities from processing Ti-bearing BFS in making the catalyst. In fact, such dopants indeed obviously modified the support properties and chemical variability of active vanadium species, as was shown by the preceding results.Acknowledgements
The authors are grateful to the financial support of Science and Technology Service Network Initiative of China (KFJ-SW-STS-149), International Science and Technology Cooperation Program of China (2016YFE0128300) and postdoctoral fellowship of Japan Society for the Promotion of Science (JSPS by P15758).References
- W. Shan and H. Song, Catal. Sci. Technol., 2015, 5, 4280–4288 CAS.
- Y. Zheng, A. D. Jensen and J. E. Johnsson, Appl. Catal., B, 2005, 60, 253–264 CrossRef CAS.
- C. Wang, S. Yang, H. Chang, Y. Peng and J. Li, Chem. Eng. J., 2013, 225, 520–527 CrossRef CAS.
- R. Gao, D. Zhang, X. Liu, L. Shi, P. Maitarad, H. Li, J. Zhang and W. Cao, Catal. Sci. Technol., 2013, 3, 191–199 CAS.
- Y. Pan, W. Zhao, Q. Zhong, W. Cai and H. Li, J. Environ. Sci., 2013, 25, 1703–1711 CrossRef CAS.
- M. Kobayashi, R. Kuma and A. Morita, Catal. Lett., 2006, 112, 37–44 CrossRef CAS.
- M. Kobayashi, R. Kuma, S. Masaki and N. Sugishima, Appl. Catal., B, 2005, 60, 173–179 CrossRef CAS.
- W. Cha, S.-T. Yun and J. Jurng, Phys. Chem. Chem. Phys., 2014, 16, 17900–17907 RSC.
- Z. Ma, X. Wu, Y. Feng, Z. Si, D. Weng and L. Shi, Prog. Nat. Sci., 2015, 25, 342–352 CrossRef CAS.
- L. Chen, J. Li and M. Ge, J. Phys. Chem. C, 2009, 113, 21177–21184 CAS.
- S. Yang, C. Wang, L. Ma, Y. Peng, Z. Qu, N. Yan, J. Chen, H. Chang and J. Li, Catal. Sci. Technol., 2013, 3, 161–168 CAS.
- S. S. R. Putluru, L. Schill, A. Godiksen, R. Poreddy, S. Mossin, A. D. Jensen and R. Fehrmann, Appl. Catal., B, 2016, 183, 282–290 CrossRef CAS.
- K. Cheng, J. Liu, Z. Zhao, Y. Wei, G. Jiang and A. Duan, RSC Adv., 2015, 5, 45172–45183 RSC.
- W. Cha, S. Chin, E. Park, S.-T. Yun and J. Jurng, Appl. Catal., B, 2013, 140–141, 708–715 CrossRef CAS.
- D.-s. Chen, L.-s. Zhao, T. Qi, G.-p. Hu, H.-x. Zhao, J. Li and L.-n. Wang, Trans. Nonferrous Met. Soc. China, 2013, 23, 3076–3082 CrossRef CAS.
- L. Zhang, L. N. Zhang, M. Y. Wang, G. Q. Li and Z. T. Sui, Miner. Eng., 2007, 20, 684–693 CrossRef CAS.
- J. Yang, S. Lei, J. Yu and G. W. Xu, J. Environ. Chem. Eng., 2014, 2, 1007–1010 CrossRef CAS.
- K. Cheng, J. Liu, T. Zhang, J. Li, Z. Zhao, Y. Wei, G. Jiang and A. Duan, J. Environ. Sci., 2014, 26, 2106–2113 CrossRef PubMed.
- Y. Peng, C. Liu, X. Zhang and J. Li, Appl. Catal., B, 2013, 140–141, 276–282 CrossRef CAS.
- W. Zhao, Y. Tang, Y. Wan, L. Li, S. Yao, X. Li, J. Gu, Y. Li and J. Shi, J. Hazard. Mater., 2014, 278, 350–359 CrossRef CAS PubMed.
- H. K. Matralis, M. Ciardelli, M. Ruwet and P. Grange, J. Catal., 1995, 157, 368–379 CrossRef CAS.
- X. Zhao, L. Huang, S. Namuangruk, H. Hu, X. Hu, L. Shi and D. Zhang, Catal. Sci. Technol., 2016, 6, 5543–5553 CAS.
- L. Yan, Y. Liu, H. Hu, H. Li, L. Shi and D. Zhang, ChemCatChem, 2016, 8, 2267–2278 CrossRef CAS.
- T. Tran, J. Yu, L. Gan, F. Guo, D. Phan and G. Xu, Catalysts, 2016, 6, 56 CrossRef.
- X. Gao and I. E. Wachs, Catal. Today, 1999, 51, 233–254 CrossRef CAS.
- H. S. Kibombo, R. Peng, S. Rasalingam and R. T. Koodali, Catal. Sci. Technol., 2012, 2, 1737–1766 CAS.
- M. Casanova, K. Schermanz, J. Llorca and A. Trovarelli, Catal. Today, 2012, 184, 227–236 CrossRef CAS.
- O. Ruzimuradov, S. Nurmanov, Y. Kodani, R. Takahashi and I. Yamada, J. Sol-Gel Sci. Technol., 2012, 64, 684–693 CrossRef CAS.
- W. Li and T. Zeng, PLoS One, 2011, 6, e21082 CAS.
- W. Zhao, Q. Zhong, T. Zhang and Y. Pan, RSC Adv., 2012, 2, 7906–7914 RSC.
- Z. Li, Z. Wang and G. Li, Powder Technol., 2016, 287, 256–263 CrossRef CAS.
- F. Valighazvini, F. Rashchi and R. K. Nekouei, Ind. Eng. Chem. Res., 2013, 52, 1723–1730 CrossRef CAS.
- T. J. Pinnavaia, T. R. Pauly and S. S. Kim, in Supported Catalysts and Their Applications, ed. D. C. Sherrington and A. P. Kybett, The Royal Society of Chemistry, 2001, pp. 19–26, 10.1039/9781847551962-00019.
- K. Sing, D. Everett, R. Haul, L. Moscou, R. Pierotti, J. Rouquerol and T. Siemieniewska, Pure Appl. Chem., 1985, 57, 603–619 CrossRef CAS.
- R. Jin, Z. Wu, Y. Liu, B. Jiang and H. Wang, J. Hazard. Mater., 2009, 161, 42–48 CrossRef CAS PubMed.
- A. Sorrentino, S. Rega, D. Sannino, A. Magliano, P. Ciambelli and E. Santacesaria, Appl. Catal., A, 2001, 209, 45–57 CrossRef CAS.
- M. Kobayashi and M. Hagi, Appl. Catal., B, 2006, 63, 104–113 CrossRef CAS.
- S. Liu, E. Guo and L. Yin, J. Mater. Chem., 2012, 22, 5031–5041 RSC.
- J. P. Chen and R. T. Yang, J. Catal., 1993, 139, 277–288 CrossRef CAS.
- J. Y. Cho, W. H. Nam, Y. S. Lim, W.-S. Seo, H.-H. Park and J. Y. Lee, RSC Adv., 2012, 2, 2449–2453 RSC.
- C. Marinescu, A. Sofronia, C. Rusti, R. Piticescu, V. Badilita, E. Vasile, R. Baies and S. Tanasescu, J. Therm. Anal. Calorim., 2011, 103, 49–57 CrossRef CAS.
- D. A. H. Hanaor and C. C. Sorrell, J. Mater. Sci., 2011, 46, 855–874 CrossRef CAS.
- R. Rejeb, L. Khalfallah Boudali, G. Delahay and C. Petitto, Top. Catal., 2016, 1–8 Search PubMed.
- A. Rajaeiyan and M. M. Bagheri-Mohagheghi, Adv. Manuf., 2013, 1, 176–182 CrossRef CAS.
- C. Ren, W. Qiu and Y. Chen, Sep. Purif. Technol., 2013, 107, 264–272 CrossRef CAS.
- C. Orsenigo, L. Lietti, E. Tronconi, P. Forzatti and F. Bregani, Ind. Eng. Chem. Res., 1998, 37, 2350–2359 CrossRef CAS.
- R. Camposeco, S. Castillo and I. Mejía-Centeno, Catal. Commun., 2015, 60, 114–119 CrossRef CAS.
- L. Ma, J. Li, R. Ke and L. Fu, J. Phys. Chem. C, 2011, 115, 7603–7612 CAS.
- S. T. Choo, Y. G. Lee, I.-S. Nam, S.-W. Ham and J.-B. Lee, Appl. Catal., A, 2000, 200, 177–188 CrossRef CAS.
- S. M. Jung and P. Grange, Appl. Catal., B, 2001, 32, 123–131 CrossRef CAS.
- J. P. Chen and R. T. Yang, J. Catal., 1990, 125, 411–420 CrossRef CAS.
- F. Liu, Y. Yu and H. He, Chem. Commun., 2014, 50, 8445–8463 RSC.
- L. Zhang, L. Shi, L. Huang, J. Zhang, R. Gao and D. Zhang, ACS Catal., 2014, 4, 1753–1763 CrossRef CAS.
- T. Mishra and K. M. Parida, J. Colloid Interface Sci., 2006, 301, 554–559 CrossRef CAS PubMed.
- M. Casanova, L. Nodari, A. Sagar, K. Schermanz and A. Trovarelli, Appl. Catal., B, 2015, 176–177, 699–708 CrossRef CAS.
- H. Hu, S. Cai, H. Li, L. Huang, L. Shi and D. Zhang, ACS Catal., 2015, 5, 6069–6077 CrossRef CAS.
- Z. Fan, H. Guo, K. Fang and Y. Sun, RSC Adv., 2015, 5, 24795–24802 RSC.
- S. Matsuda, T. Kamo, A. Kato, F. Nakajima, T. Kumura and H. Kuroda, Ind. Eng. Chem. Prod. Res. Dev., 1982, 21, 48–52 CrossRef CAS.
Footnote |
| † Electronic supplementary information (ESI) available. See DOI: 10.1039/c7ra01252g |
| This journal is © The Royal Society of Chemistry 2017 |


