 Open Access Article
Creative Commons Attribution 3.0 Unported Licence
Theoretical investigation of high-efficiency organic electroluminescent material: HLCT state and hot exciton process†
Yuyu Pan *a,
Jing Huanga,
Weijun Lic,
Yu Gaob,
Zhiming Wanga,
Dawei Yua,
Bing Yang*b and
Yuguang Ma
 d
d
aSchool of Petrochemical Engineering, Shenyang University of Technology, 30 Guanghua Street, Liaoyang, 111003, P. R. China. E-mail: pyy39518768@163.com; Fax: +86 419 5319409; Tel: +86 419 5319409
bState Key Laboratory of Supramolecular Structure and Materials, Jilin University, Changchun, 130012, P. R. China. E-mail: yangbing@jlu.edu.cn; Fax: +86-431-85168502; Tel: +86-431-85193421
cCollege of Chemical Engineering, Zhejiang University of Technology, Hangzhou, 310014, P. R. China
dState Key Laboratory of Luminescent Materials and Devices, Institute of Polymer Optoelectronic Materials and Devices, South China University of Technology, Guangzhou, 510640, P. R. China
First published on 3rd April 2017
Abstract
It has been proved that hybridized local and charge transfer (HLCT) excited state fluorescence emitters show great potential for next generation OLED materials with both high photoluminescence (PL) efficiency and a large fraction of singlet exciton generation in electroluminescence (EL). In order to reveal the relationship between molecular structure and photoelectric properties more deeply, we use density functional theory (DFT) and time-dependent density functional theory (TD-DFT) methods to calculate these novel functional materials. As examples, 4-(phenanthren-9-yl)-N,N-diphenylaniline (TPA-PA), 4-(anthracen-9-yl)-N,N-diphenylaniline (TPA-AN) and 4-(acridin-9-yl)-N,N-diphenylaniline (TPA-AC) are investigated in regards to geometries of ground-state and excited-state, HOMOs, LUMOs, as well as some excited-state character, absorption and emission spectra, and excited state energy surface scans. The results suggest that the twist angle of the D–A segment plays an important role in governing the CT components in the HLCT state of the studied complexes and based on the analysis of the excited state energy levels, a different electroluminescence mechanism was discussed.
Introduction
Recently, our group reported a series of experimental works on twisting D–A molecules which achieves a significantly enhanced electroluminescence (EL) quantum yield.1–8 At the same time, we have proved that some of the D–A type molecules with low-lying excited state (S1) produced hybridized local and charge-transfer (HLCT) character. HLCT state is an important excited state to design next generation OLED materials with both an extremely high radiation efficiency and a large fraction of singlet exciton utilization.7 The state mixing principle indicates9 state mixing can be described as a linear combination of two states of ψ(CT) and ψ(LE). When LE and CT lie very close to each other, a state mixing may occur between energy from close-lying LE and CT states, and thus it can be expected that the states hybridized between the local and charge-transfer state. A typical example, triphenylamine-thiadiazole molecule TPA-NZP exhibited an ultra-high exciton utilization efficiency of ∼93% in the EL device, among a series of our twisted donor–acceptor molecules.2,7 However, relatively low exciton utilization efficiency was also assessed in some HLCT state molecules. Perhaps other factors in the HLCT state exist which greatly affect the molecular optical properties.Therefore, in the following, we undertake a computational approach, based on density functional theory (DFT), to explore a series of twisting D–A molecules with the same donor (triphenylamine TPA) and varied acceptor units, 4-(phenanthren-9-yl)-N,N-diphenylaniline (TPA-PA), 4-(anthracen-9-yl)-N,N-diphenylaniline (TPA-AN) and 4-(acridin-9-yl)-N,N-diphenylaniline (TPA-AC), with molecular structures as shown in Fig. 1. By tuning the electron-withdrawing ability of acceptor groups and controlling the steric-hindrance between D and A, different PL efficiencies and distinct excited state characteristics were obtained. In this study, the electronic structures and photophysical properties of these twisting D–A molecules were investigated. In addition, to evaluate the exciton utilization efficiency (ηs) of these twisting D–A molecules, the excitation energies of the singlets (ES) and triplets (ET), the exchange energies (ΔEST), the emission spectra and the absorption spectra are also discussed in detail. The main purpose of this paper is to reveal the relationship between the structure and properties of the HLCT state electroluminescent molecules from a theoretical point of view, so as to provide new ideas for the design and synthesis of new generation OLED materials with high efficiency and low cost.
Methodology and computational details
As we know, an accurate description of excited states is still a challenging issue by means of various quantum chemistry computation methods. There are some commonly used methods for describing the electronic structures of the excited states using CIS (configuration interaction with single substitute),10 EOM-CCSD (equation of motion coupled cluster with single and double excitations),11 and TD-DFT12–18 (time-dependent density functional theory). The CIS method is a semi-empirical method which is less expensive but with a lower accuracy, while the EOM-CCSD method, while taking into account both single and double substitutions, can give relatively accurate results but the calculation cost is too high, whereas DFT is a more cost-effective method for calculating the excited-state. In the previous work, we have taken the TPA-AC as an example to investigate the methods for calculating electronic structure of ground and excited-states.12 We used 2 local functionals (SVWN19 and PBE20), 7 hybrid functionals (BLYP,21 B3LYP,22 PBE0,23 BMK,24 BHHLYP,25 M06-2X,26 M06HF27), and one long-range-corrected functional ωB97X28 to calculate the molecular geometry and excited state properties, using diffuse-containing basis sets and the Polarizable Continuum Model (PCM),29–31 respectively. Among these methods, the ωB97X method provided the results which are the closest to data from experimental values after taking into account solvent effects.Considering the computational accuracy and cost, the ωB97X method was finally chosen to describe the ground and excited state properties of the TPA-PA, TPA-AN and TPA-AC. In this paper, as shown in Fig. 2, for the ωB97X functional, ω = 0.13a0−1 for TPA-PA, ω = 0.17a0−1 for TPA-AN and ω = 0.16a0−1 for TPA-AC have been optimized by employing the procedure by Stein using the standard 6-31+G(d, p) basis set. All calculations have been performed using the Gaussian 09.D.01 version.32
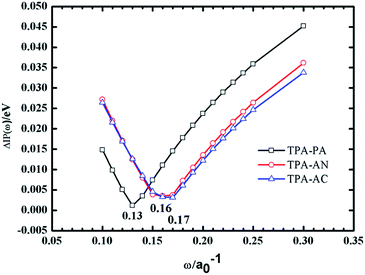 | ||
| Fig. 2 Tuning ω for TPA-PA, TPA-AN and TPA-AC under vacuum (the optimal ω values are 0.13, 0.17 and 0.16 for which ΔIP(ω) is at the minimum). | ||
Results and discussions
Optimized geometries of ground-state and excited-state
The molecular structures of our investigated D–A systems are shown in the Fig. 1. TPA is adopted as the donor and various highly efficient chromophores are chosen as the acceptors. In these twisting D–A molecules, the direct single bond linkage between D and A moieties is designed to form a twisting molecular configuration, which will benefit the proper interstate coupling between LE and CT states. The optimized ground (S0) and first singlet excited (S1) state structures of these compounds are shown in Fig. 3, and the xyz coordinates have been supplemented in the ESI† in the form of a zip file. Vibrational frequencies are computed to verify if these structures are stationary points on their potential energy surfaces by checking whether or not imaginary frequency exist with lower energy structures. The frequency calculations of the ground and excited states of all the above HLCT molecules exhibit that there are no imaginary frequencies in the results. The vibration spectra of TPA-PA, TPA-AN and TPA-AC in the S0 and S1 states are shown in Fig. S1.†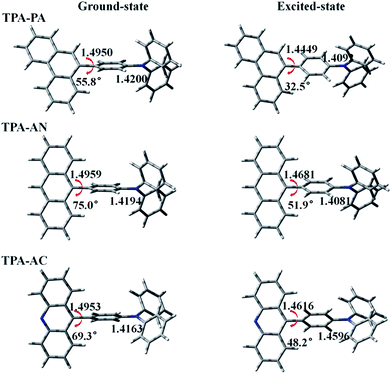 | ||
| Fig. 3 Some bond lengths and twist angles of TPA-PA, TPA-AN and TPA-AC in ground-state and excited-state geometries. | ||
Selected important bond lengths and dihedral angles between the donor and acceptor planes of these complexes, in both the S0 and S1 states, are illustrated in Fig. 2, separately.
In the S0 state of all above molecules, the bond lengths of C2–C3 between D and A are ranging from 1.4950 to 1.4959 Å, slightly shorter than conventional C–C single-bonds (1.53 Å) and in the S1 states, the C2–C3 bonds are shortened while the C–N bonds (C6–N7) are lengthened, indicating singlet excitons are mainly located on the C2–C3 bonds and C6–N7 bonds. That may have an important influence on emission spectra in the excited state. This point will be confirmed by the Frontier Molecular Orbital (FMO) and Excited State Property analyses in the following section. In the meantime, the introduced large rigid phenanthrene (PA), anthracene (AN) and acridine (AC) fragments also result in twisted angles between D and A. As shown in Fig. 3, the twisted angles of TPA-PA, TPA-AN and TPA-AC were 55.8°, 75.0° and 69.3°, respectively, in the optimized S0 state geometries, while the twisted angles were 32.5°, 51.9° and 48.2°, respectively, obtained in the optimized S1 state geometries by density functional theory (DFT). This indicates the excited state geometry is more planar than that of the ground state. From previous experience, the twist angle will have a great impact on the transition properties of the excited state, TPA-PA with the smallest twist angle should enhance the state mixing between the LE and CT states. However, the twist angle of TPA-AN is too large thus state mixing is difficult.
Frontier molecular orbitals (FMOs)
The calculations of the FMOs (HOMO and LUMO) are the basis for analyzing the properties of the excited state. Cyclic voltammetry is often used to determine these values from an empirical formula proposed by Brédas et al. in experiment. In this work, we use the DFT method to calculate the energy and the electronic density contours of the FMOs. However, in a practical solid-state system, the twist angle between the D and A can be easily changed due to molecular packing, which is not considered in the calculation of a single molecule. Therefore, the calculation result will deviate from the actual measurement value. Although the calculated values of the HOMO and LUMO energy levels are not very accurate, the similarity of the trends makes it possible to make comparative judgments on structurally similar molecules. We have plotted the electronic density contours and the energy of the FMOs of the TPA-PA, TPA-AN and TPA-AC by ωB97X/6-31+G(d,p), shown in Fig. 4. In general, the HOMO possesses an anti-bonding character and the LUMO shows a bonding character between the subunits. As shown in Fig. 4, for the TPA-PA, TPA-AN and TPA-AC, the electronic cloud distribution of the HOMO exhibits different proportional mixing of LE and CT. The electron-donating group (triphenylamine TPA) in these three molecules have larger contributions to the HOMO than those of the electron-withdrawing groups (PA, AN and AC), therefore leading to almost the same HOMO energy levels. On the contrary, TPA has a negligible contribution to the LUMO, the electronic cloud distribution is almost located on the acceptors, indicating that the PA, AN and AC groups have a strong electron-accepting ability and the LUMO values are effectively decreased. It can be deduced that the different acceptors showed greater influence on the LUMOs than the HOMOs. The stronger the electron-withdrawing strength is, the lower the LUMO energies are, and the narrower the energy gap is. As can be seen in the previous part, the twist angles from the ground state to the excited state show the same trend, TPA-AN > TPA-AC > TPA-PA, but the electron cloud distribution of the FMOs is not consistent with our expectations, for example, the state mixing proportion of TPA-AN is bigger than TPA-AC. The most easily observed transitions in the experiment are through absorption or emission spectroscopy, which are the lowest excitation energies S0 → S1 and S1 → S0. In fact, the exciton transitions only from the S0 to the S1 in the process, the electron transition process also happens from the HOMO to the LUMO, and the HOMO–LUMO gap can be used to describe the optical band gap as a quantity. Therefore the electronic cloud distribution of the frontier molecular orbitals is not enough to describe the transition process; we need to further verify through the natural transition orbitals (NTOs)33 in the next part.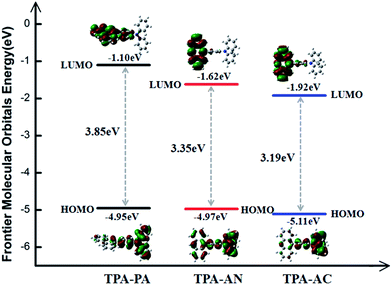 | ||
| Fig. 4 The electronic density contours and the energy of the frontier orbitals of TPA-PA, TPA-AC and TPA-AN by ωB97X/6-31+G(d,p). | ||
In addition, owing to the overlap between the HOMO and LUMO determining the energy gap (ΔEST) between the S1 and the first triplet excited state T1 value (assuming a major transition configuration HOMO → LUMO for single electron excitation), it can be concluded that the ΔEST values for TPA-PA, TPA-AC and TPA-AN were much larger for the relatively small wavefunction overlap (see the Fig. 4).
Excited state property of the HLCT
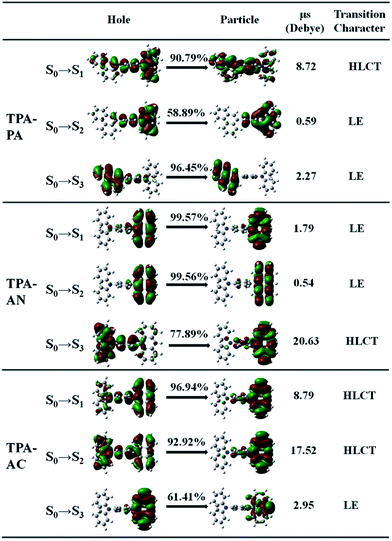
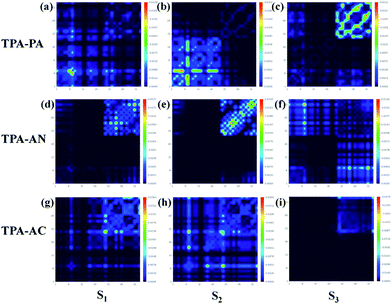
In theory, the transition properties of the excited states are usually determined by the magnitude of the transition dipole moment, the distribution of the electron cloud of NTOs and the transition density matrix.34,35 Firstly, we illustrated the transition dipole moment and the dominant “hole”–“particle” contributions of the NTOs of the first three excited states in TPA-PA, TPA-AN and TPA-AC in Fig. 5. We further used the Multiwfn software 3.3.9 version to calculate the S1, S2 and S3 states’ wave function of electron–hole pairs from the transition density matrix, and plot them in a two-dimension (2D) color-filled map, as shown in the Fig. 6. The transition density matrix could quantify the composition of the excited state and from this map we can understand which atoms are mainly affected by the electron transition and which atom pairs are strongly coherent when electron transits. The stronger that the effect is during the transition, the brighter the value is in the map. The diagonal part represents the LE component, while the off-diagonal region denotes the CT component.Shown in Fig. 5, TPA-PA and TPA-AC exhibit similar transition character from “hole” to “particle” in the S1 state which determines the luminescence properties: a HLCT transition between donor and acceptor, than TPA-PA with more fully state mixing than TPA-AC. The transition density matrix shows the same trend that the values are distributed in both the diagonal and off-diagonal directions in Fig. 6(a) and (g), but in Fig. 6(g) the upper right corner which represents the AC is the strongest. This means that the S1 state transitions that exist in both CT and LE properties, but mainly in the LE component localized on the AC group. The values in Fig. 6(a) are more evenly distributed throughout the map, indicating a more balanced ratio of LE to CT in the transition of the S1 state of TPA-PA, which means that the degree of hybridization is greater. Differently, the initial S1 excited states of TPA-AN exhibit the main local exciton (LE or Frenkel exciton) transition state character. The transition density matrix of the S1 state is localized on the AN region in the diagonal direction mainly, as shown in Fig. 6(d), this means that the transition of the S1 state in TPA-AN is the LE and localized on the AN group. These calculated results of the first three excited states basically show the consistent tendency with the qualitative description of NTOs. The transition properties of the S1 states indicate that the decreasing twist angles should enhance the state mixing between LE and CT states. For example the hybridization of the S1 state is in the order of TPA-PA (55.8°) > TPA-AC (69.3°) > TPA-AN (75.0°) which is inversely proportional to the twist angle between the D and A.
In addition, the NTOs of the first ten singlet and triplet excited states are illustrated in Fig. S2–S4 in the ESI (SI-2†). As shown in Fig. S2,† no HLCT or CT transition properties exist in the entire singlet and triplet excited states except the S1 state in TPA-PA. The TPA-AC displays the main CT transition in the S2 and T2 states, and TPA-AN exhibits stronger CT transition character in the S3 and T8 states. On the other hand, the transition dipole moments (μe) of the S1 states are greatly increased relative to the dipole moment (μg) of the S0 state for TPA-PA and TPA-AC as shown in Fig. 5, further verifying a CT process substantially occurring upon electron excitation. In the case of TPA-AN, only the S3 state shows significant CT character (μe = 20.6 D) among the first ten singlet excited states.
The transition properties of the excited states were verified by solvatochromic experiments.7 The large PL red shifts are exhibited from low-polarity n-hexane to high-polarity acetonitrile in all of the three molecules and the Lippert–Mataga relation displays the S1 state with HLCT character in TPA-AC and the S1 state of TPA-AN forms with LE dominating character.7 These fitted results are in good agreement with the prediction from the transition properties of the excited states calculation.
Discussion of electroluminescent mechanism
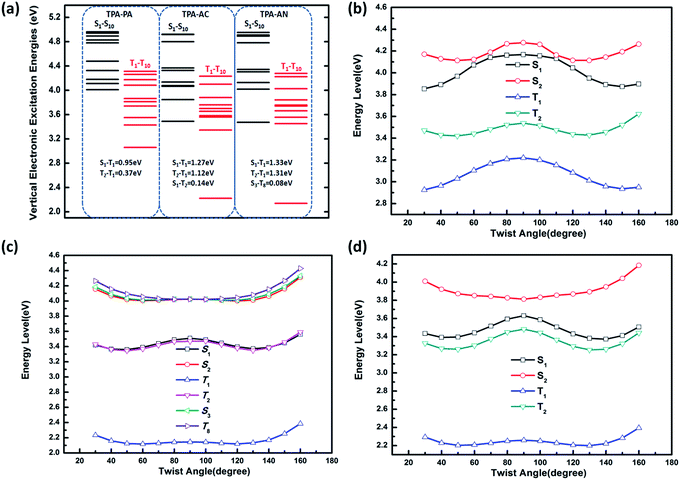
From the above discussion we can see that the twist angle between the D and A has a great impact on the excited state transition properties, and the device results also show that there is a big difference in luminous efficiency due to the exciton utilization of different molecules. Therefore in this part we will discuss the differences in luminescence mechanisms for molecules with similar structures. In our previous works we have discussed a new mechanism responsible for the high exciton utilization efficiency, we called this mechanism the “hot exciton model”.6 This model occurs in the HLCT molecule TPA-NZP, which harvested a 93% yield of singlet excitons in the EL device, in which triplet exciton reverse intersystem crossing (RISC) occurred along the CT channel (T2 → S2), and with increasing twist angle the potential energy curves of the T2 and S2 became closer, meaning that the CT channel becomes unobstructed and the excitons are more conveniently able to return to the singlet state, thus increasing exciton utilization; the potential energy curve of TPA-NZP is shown in Fig. S5.† The experimental results show that the exciton utilization in the OLED of the three molecules, TPA-PA, TPA-AC and TPA-AN, are 14%, 30% and 46%, respectively, assuming full electron–hole recombination. Two of these molecules have relatively high exciton utilization and broke through 25% of the spin statistics limit. However, relatively low exciton utilization efficiency was also assessed in the HLCT molecule TPA-PA. In order to understand the difference in exciton utilization efficiency, firstly, we investigated the excited state energy landscape and the potential energy curve (the twist angles are taken as a variable) of excited-states for the TPA-PA, TPA-AN and TPA-AC molecules using the TD-ωB97X/6-31+G(d, p) method, as shown in Fig. 7. In order to further determine the effect of the twist angle on the properties of the excited state transition, we artificially adjusted them to observe the change of the excited state transition property at different twist angles. The NTOs of the S1 state with twist angles of 30°, 50°, 70°, 80°, 90°are listed in Fig. 8 and the NTOs of the S2, T1 and T2 states of TPA-PA, TPA-AN and TPA-AC are listed in Fig. S6–S8 of SI-4.†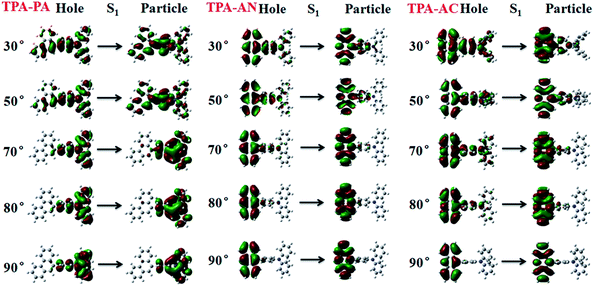 | ||
| Fig. 8 The NTOs of the S1 state with twist angles of 30°, 50°, 70°, 80° and 90°for TPA-PA, TPA-AN and TPA-AC. | ||
It can be seen from Fig. 8 and S6,† starting twist angle increases from 30°, the transition properties of the S1, S2, T1 and T2 states of the TPA-PA molecule move from the mixed HLCT state gradually into a complete LE state. From the excited-state potential energy surface scan it can also be seen, with the twist angle increasing, that the energy gaps between different energy levels are not much changed, so for such as the TPA-PA molecules, under any conditions (crystalline and amorphous type) (R)ISC between the singlet and the triplet state cannot happen, and the exciton utilization is under the 25%. Likewise in the TPA-AN molecule, the S1 and T1 states also show the same trend as for TPA-PA, and the complete LE state is formed as the angle increases. However, the change in the S3 and T8 states are from typical HLCT states into a complete CT state, this shows that it is harder for the larger twist angle to completely form the HLCT state, on the other hand, from the excited-state potential energy surface scan of the TPA-AN molecule, as the change of the transition character occurs, the change in the gaps between the S1 and T1 states is not big, but the gaps between the S3 and T8 states are gradually narrowed, which is conducive to build the channel of excitons; this may be the main reason leading to the high exciton utilization of the TPA-AN molecule. The S1 and T1 states of the TPA-AC molecule are keep the same trend as the first two molecules, but the S2 state is the same as the S3 state of TPA-AN, which changed from the HLCT state to the CT state, while the T2 states maintain the degree of the hybridization of LE and CT with the increasing twist angle, until close to 90° when it becomes a complete LE transition. This proves that from 30° to 90°, with the changes in the character of the transition, the potential energy surfaces of S1, S2 and T2 are possibly closer and it is advantageous to the formation of exciton channel, which can improve the exciton utilization.
Combining the above analysis, we speculated the electroluminescence mechanism of the three kinds of molecule. The first ten singlet and triplet state energy landscapes of TPA-PA, TPA-AC and TPA-AN were calculated, as shown in Fig. 6(a). Firstly, the excitons could smoothly relax to the lowest excited state, because the evenly distributed energy levels of excited states, and the energy gap (0.75 eV) between the T1 and S1 state were still too large to afford thermally-activated RISC (T1 → S1). Moreover, as the higher excited states (from S2/T2 to S10/T10) are without energy degenerate CT states, the “hot exciton” CT channel is also unworkable. Thus, the ηs of TPA-PA was rationalized not to break through the spin statistic limit of 25%, even the S1 was a HLCT state. In addition, as shown in Fig. 5(b), the potential energy curves of singlet (S1 and S2) and triplet (T1 and T2) excited-states do not cross and the energy gap between the singlets and triplets are too large for (R)ISC, this means that the excitons of singlets and triplets could not mix at all events. The mechanism is shown in Fig. 9(a). Secondly, from the energy landscape of TPA-AC, there is a large energy gap between the T2 and T1 states (≈1.12 eV), this gap may prevent the triplet excitons relaxing to the T1 state by internal conversion and the S1, S2 and T2 states all exhibit the HLCT character shown in the NTOs. Therefore, it is possible to construct an exciton channel between the S1 or S2 states and T2 state in order to transfer the triplet excitons into the singlet excitons. The excited-state potential energy curve of the TPA-AC could prove that the small energy gaps between the T2 and S1 states are almost constant during the change of the twist angle. Consequentially, the final singlet exciton ratio should exceed 25% of spin statistics in the TPA-AC OLED, as shown in Fig. 9(b).
Another mechanism was inferred in Fig. 9(c) by analyzing the excited state energy diagrams, potential energy curve and NTOs of TPA-AN. Same as TPA-AC, a large energy gap between T2 and T1 can decrease the KIC from T2 to T1, but from the NTOs analysis, the S3 state and the T8 state display distinct CT character. The hot exciton channel T8 → S3 may occur and could be attributed to the very small singlet–triplet energy splitting (ΔES3T8) and large overlap between these two potential energy curves. However, the higher triplet excited states (from T2 to T10) demonstrate a closely-spaced arrangement of energy levels in TPA-AN, the KIC from Tn to T2 is very fast, thus the triplet exciton could be “split-flow” into two parts: one part through the “hot exciton” channel T8 → S3 mingles into the singlet exciton and the other is wasted as a non-radiative decay to the singlet ground state. Thus, the ηs of TPA-AN was rationalized to break through the spin statistic limit of 25%, but only reached 30% lower than TPA-AC.
Conclusion
In summary, we employed the DFT method to theoretically investigate the optoelectronic properties of a series of twisting D–A molecules TPA-PA, TPA-AN and TPA-AC, which are composed of the same donor (triphenylamine TPA) and varied acceptor units phenanthrene (PA), anthracene (AN) and acridine (AC). On the basis of the geometries and the electronic structures of the ground state and excited state, the electrical and optical properties were well estimated computationally. We found that the twist angle along D–A had a significant effect on the CT component in their HLCT excited state. Further, to understand the basic principle and process responsible for the high exciton utilization efficiency, the NTOs and energy levels of the first ten singlets and triplets were discussed in detail. Three mechanisms were inferred through analyzing the experimental and DFT results. This will provide new ideas for the future design of high efficiency electroluminescent materials.Acknowledgements
We are grateful for financial support from National Science Foundation of China (grant number 51603127, 91233113, 51273078, 51473063, 51203091) and National Basic Research Program of China (973 Program grant number 2013CB834705, 2013CB834801, 2015CB655003).References
- W. J. Li, D. D. Liu, F. Z. Shen, D. G. Ma, Z. M. Wang, Y. Xu, B. Yang, Y. G. Ma and T. Feng, Adv. Funct. Mater., 2012, 22, 2797 CrossRef CAS.
- W. J. Li, Y. Y. Pan, R. Xiao, Q. M. Peng, S. T. Zhang, D. G. Ma, F. Li, F. Z. Shen, Y. H. Wang, B. Yang and Y. G. Ma, Adv. Funct. Mater., 2014, 24, 1609 CrossRef CAS.
- S. Tang, W. J. Li, F. Z. Shen, D. D. Liu, B. Yang and Y. G. Ma, J. Mater. Chem., 2012, 22, 4401 RSC.
- S. T. Zhang, W. J. Li, L. Yao, Y. Y. Pan, B. Yang, Y. G. Ma, F. Shen and R. Xiao, Chem. Commun., 2013, 49, 11302 RSC.
- L. Yao, S. T. Zhang, R. Wang, W. J. Li, F. Z. Shen, B. Yang and Y. G. Ma, Angew. Chem., 2014, 126, 2151 CrossRef.
- Y. Y. Pan, W. J. Li, S. T. Zhang, L. Yao, C. Gu, H. Xu, B. Yang and Y. G. Ma, Adv. Opt. Mater., 2014, 2, 510 CrossRef CAS.
- W. J. Li, Y. Y. Pan, L. Yao, H. C. Liu, S. T. Zhang, C. Wang, F. Z. Shen, B. Yang, Y. G. Ma and P. Lu, Adv. Opt. Mater., 2014, 2, 892–901 CrossRef CAS.
- S. T. Zhang, Y. X. Dai, S. Y. Luo, Y. Gao, N. Gao, K. Wang, B. Zou, B. Yang and Y. G. Ma, Adv. Funct. Mater., 2017, 27, 01602276 CrossRef.
- L. Dabrowski, Il Nuovo Cimento B, 1991, 106, 963 CrossRef.
- J. B. Foresman and Æ. Frisch, Exploring Chemistry with Electronic Structure Methods, Gaussian, Inc., Pittsburgh, PA, 2nd edn, 1996 Search PubMed.
- G. E. Scuseria and H. F. Schaefer III, J. Chem. Phys., 1989, 90, 3700 CrossRef CAS.
- Y. Y. Pan, J. Huang, S. T. Zhang, D. W. Yu, B. Yang and Y. G. Ma, RSC Adv., 2016, 6, 108404 RSC.
- M. E. Casida, C. Jamorski, K. C. Casida and D. R. Salahub, J. Chem. Phys., 1998, 108, 4439 CrossRef CAS.
- R. E. Stratmann, G. E. Scuseria and M. J. Frisch, J. Chem. Phys., 1998, 109, 8218 CrossRef CAS.
- C. Van Caillie and R. D. Amos, Chem. Phys. Lett., 1999, 308, 249 CrossRef CAS.
- C. Van Caillie and R. D. Amos, Chem. Phys. Lett., 2000, 317, 159 CrossRef CAS.
- F. Furche and R. Ahlrichs, J. Chem. Phys., 2002, 117, 7433 CrossRef CAS.
- G. Scalmani, M. J. Frisch, B. Mennucci, J. Tomasi, R. Cammi and V. Barone, J. Chem. Phys., 2006, 124, 094107 CrossRef PubMed.
- S. H. Vosko, L. Wilk and M. Nusair, Can. J. Phys., 1980, 58, 1200 CrossRef CAS.
- J. P. Perdew, K. Burke and M. Ernzerhof, Phys. Rev. Lett., 1997, 78, 1396 CrossRef CAS.
- B. Miehlich, A. Savin, H. Stoll and H. Preuss, Chem. Phys. Lett., 1989, 157, 200–206 CrossRef CAS.
- A. D. Becke, J. Chem. Phys., 1993, 98, 5648 CrossRef CAS.
- C. Adamo and V. Barone, J. Chem. Phys., 1999, 110, 6158 CrossRef CAS.
- A. D. Boese and J. M. L. Martin, J. Chem. Phys., 2004, 121, 3405 CrossRef CAS PubMed.
- A. D. Becke, J. Chem. Phys., 1993, 98, 1372 CrossRef CAS.
- Y. Zhao and D. G. Truhlar, Theor. Chem. Acc., 2008, 120, 215 CrossRef CAS.
- Y. Zhao and D. G. Truhlar, J. Phys. Chem. A, 2006, 110, 13126 CrossRef CAS PubMed.
- J.-D. Chai and M. Head-Gordon, J. Chem. Phys., 2008, 128, 084106 CrossRef PubMed.
- J. Tomasi, B. Mennucci and R. Cammi, Chem. Rev., 2005, 105, 2999 CrossRef CAS PubMed.
- M. Cossi, G. Scalmani, N. Rega and V. Barone, J. Chem. Phys., 2002, 117, 43 CrossRef CAS.
- M. Cossi and V. Barone, J. Chem. Phys., 2000, 112, 2427 CrossRef CAS.
- M. J. Frisch, G. W. Trucks, H. B. Schlegel, G. E. Scuseria, M. A. Robb, J. R. Cheeseman, G. Scalmani, V. Barone, B. Mennucci, G. A. Petersson, H. Nakatsuji, M. Caricato, X. Li, H. P. Hratchian, A. F. Izmaylov, J. Bloino, G. Zheng, J. L. Sonnenberg, M. Hada, M. Ehara, K. Toyota, R. Fukuda, J. Hasegawa, M. Ishida, T. Nakajima, Y. Honda, O. Kitao, H. Nakai, T. Vreven, J. A. Montgomery Jr, J. E. Peralta, F. Ogliaro, M. Bearpark, J. J. Heyd, E. Brothers, K. N. Kudin, V. N. Staroverov, R. Kobayashi, J. Normand, K. Raghavachari, A. Rendell, J. C. Burant, S. S. Iyengar, J. Tomasi, M. Cossi, N. Rega, J. M. Millam, M. Klene, J. E. Knox, J. B. Cross, V. Bakken, C. Adamo, J. Jaramillo, R. Gomperts, R. E. Stratmann, O. Yazyev, A. J. Austin, R. Cammi, C. Pomelli, J. W. Ochterski, R. L. Martin, K. Morokuma, V. G. Zakrzewski, G. A. Voth, P. Salvador, J. J. Dannenberg, S. Dapprich, A. D. Daniels, Ö. Farkas, J. B. Foresman, J. V. Ortiz, J. Cioslowski, and D. J. Fox, Gaussian 09, Version D.1, Gaussian, Inc., Wallingford CT, 2009 Search PubMed.
- R. L. Martin, J. Chem. Phys., 2003, 118, 477 Search PubMed.
- S. A. Mewes, F. Plasser and A. Dreuw, J. Chem. Phys., 2015, 143, 171101 CrossRef PubMed.
- F. Plasser and H. Lischka, J. Chem. Theory Comput., 2012, 8, 2777 CrossRef CAS PubMed.
Footnote |
| † Electronic supplementary information (ESI) available: NTOs of singlet states S1–S10 and triplet states T1–T10 for TPA-PA, TPA-AN and TPA-AC; potential energy curve of the TPA-NZP; the NTOs of TPA-PA, TPA-AC and TPA-AN with different twist angles. See DOI: 10.1039/c7ra01270e |
| This journal is © The Royal Society of Chemistry 2017 |


