DOI:
10.1039/C7RA01766A
(Paper)
RSC Adv., 2017,
7, 19584-19592
Single-phase white-emitting phosphors Ba3Ce(1−x−y)(PO4)3:xTb3+,yMn2+ and Ba3Ce(1−x−z)(PO4)3:xTb3+,zSm3+: structure, luminescence, energy transfer and thermal stability
Received
12th February 2017
, Accepted 13th March 2017
First published on 31st March 2017
Abstract
A series of Ba3Ce(1−x−y)(PO4)3:xTb3+,yMn2+ and Ba3Ce(1−x−z)(PO4)3:xTb3+,zSm3+ phosphors were synthesized by a high temperature solid-state reaction. X-ray diffraction, luminescence and decay curves were used to characterize the phosphors. All the synthesized phosphors crystallized in the cubic unit cell with I![[4 with combining macron]](https://www.rsc.org/images/entities/char_0034_0304.gif) 3d space group. Energy can be transferred from Ce3+ to Tb3+/Mn2+/Sm3+ in Ba3Ce(1−x)(PO4)3:xTb3+, Ba3Ce(1−y)(PO4)3:yMn2+, and Ba3Ce(1−z)(PO4)3:zSm3+ phosphors. Furthermore, the color of these phosphors can turn from cyan to green, blue to red, and cyan to pale pink. When Ba3Ce(PO4)3 was co-doped with Tb3+ and Mn2+/Sm3+, Tb3+ could also transfer part of its energy to Mn2+/Sm3+, and more importantly, a white emission can be achieved based on this energy transfer. The phosphors exhibited a good thermal stability, with correlated color temperatures of up to 3301 K, and a quantum efficiency as high as 51.2%. These results revealed that we managed to obtain good white emitting phosphors by co-doping Ba3Ce(PO4)3 with Tb3+ and Mn2+/Sm3+.
3d space group. Energy can be transferred from Ce3+ to Tb3+/Mn2+/Sm3+ in Ba3Ce(1−x)(PO4)3:xTb3+, Ba3Ce(1−y)(PO4)3:yMn2+, and Ba3Ce(1−z)(PO4)3:zSm3+ phosphors. Furthermore, the color of these phosphors can turn from cyan to green, blue to red, and cyan to pale pink. When Ba3Ce(PO4)3 was co-doped with Tb3+ and Mn2+/Sm3+, Tb3+ could also transfer part of its energy to Mn2+/Sm3+, and more importantly, a white emission can be achieved based on this energy transfer. The phosphors exhibited a good thermal stability, with correlated color temperatures of up to 3301 K, and a quantum efficiency as high as 51.2%. These results revealed that we managed to obtain good white emitting phosphors by co-doping Ba3Ce(PO4)3 with Tb3+ and Mn2+/Sm3+.
1 Introduction
The extensive application of white light-emitting diodes (LEDs) has attracted significant attention because of their long lifetime, environmental friendliness, high luminescence efficiency and material stability.1–3 Traditional white YAG:Ce3+ LEDs were fabricated with a blue-chip, which exhibit high correlated color temperature (CCT ∼ 7750 K) and poor color rendering index (CRI70 ∼ 80).4 Therefore, to obtain high-performance white LEDs, other methods have been introduced. One of the methods for achieving white emission is co-doping different ions in a single-phase compound.5–7 This can not only overcome the shortcomings of high correlated color temperature and low color rendering index, but also avoid reabsorption in the host.8–11 Generally, energy transfer plays an important role in the optical properties of co-doped luminescent materials, from which we can obtain a tunable color or white emission.12 Among ions, Ce3+ can not only emit blue emission, but can also transfer part of its energy to other ions because of its 5d → 4f transition.13–17 Moreover, Tb3+ ions are widely used as important green activators due to their 5D4 → 7FJ transitions (J = 6, 5, 4 and 3).18,19 Furthermore, Mn2+/Sm3+ can be acceptors and can produce the red emission components in the host. Thus, it is possible to obtain a white emission via tri-doping Ce3+, Tb3+ and Mn2+/Sm3+ in a single-phase compound.
Among many host compounds, eulytite-type orthophosphates of the M3IMII(PO4)3 (MI = Ba, Sr, Ca, and Pb, MII = La, Sc, Y, Bi, and In) type have attracted significant interest for their good optical properties and thermal stability.20–24 Ba3Ce(PO4)3 (BCP) is a eulytite-type phosphate, with the advantage of having Ce3+ as one of the matrix cations. Thus, the doping concentration of Ce3+ is up to 100%, such that Ce3+ can transfer a large amount of energy to the co-doping ions in the host.25,26 Therefore, in our study, a series of white-emitting Ba3Ce(PO4)3:Tb3+/Mn2+/Sm3+ phosphors were investigated, along with the energy transfer from Ce3+ to other activators. Importantly, the white emitting phosphors Ba3Ce(PO4)3:Tb3+,Mn2+ and Ba3Ce(PO4)3:Tb3+,Sm3+ exhibited a good thermal stability and correlated color temperatures.
2 Experimental
2.1 Materials and synthesis
A series of Ba3Ce(1−x−y)(PO4)3:xTb3+,yMn2+ and Ba3Ce(1−x−z)(PO4)3:xTb3+,zSm3+ phosphors were prepared by a high-temperature solid-state reaction process. The raw materials BaCO3 (analytical reagents, A.R.), NH4H2PO4 (A.R.), CeO2 (99.99%), Tb4O7 (99.99%), Sm2O3 (99.99%) and MnCO3 (A.R.) were weighed using an electronic scale with a 0.0001 g accuracy. The stoichiometric amounts of raw materials were thoroughly mixed and ground using an agate mortar and pestle for more than 30 min until they became uniformly distributed. Then, the obtained material was transferred into an alumina crucible and sintered at 1150 °C for 4 h in a reductive atmosphere (20% H2 + 80% N2). After sintering, samples were cooled down to room temperature and then ground again into a powder for subsequent use.
2.2 Material characterization
X-ray diffraction (XRD) patterns of the as-synthesized samples were obtained to determine the crystal structure, using a D/max-rA with Cu Kα radiation at 40 kV and 40 mA. XRD patterns, which were analyzed by Rietveld refinement, were acquired at the step size of 0.05° with a counting time of 2 s per step. Findit software and Crystalmaker software were used for identifying the structure. Spectral properties were analyzed via a F-4600 spectrofluorometer equipped with a 450 W Xe lamp. Temperature-dependent luminescence properties were measured via the same spectrophotometer, which was assembled with a TAP-02 high-temperature fluorescence controller. The Commission International de I'Eclairage (CIE) chromaticity coordinates of the samples were measured by a PMS-80 UV-VIS-NEAR IR spectra analysis system. Decay curves of Tb3+/Sm3+/Mn2+ were obtained using a 450 W Xe lamp as the excitation source (HORIBA, FL-1057). Decay curves of Ce3+ were obtained using a nona LED (370 nm) as the excitation source. Furthermore, particle morphology was investigated by scanning electron microscopy (SEM), and images were obtained using Nova NanoSEM 650 at the accelerating voltage of 10 kV.
3 Results and discussion
3.1 Phase formation
The phase purity of our phosphors was evaluated by X-ray diffraction. Fig. 1 exhibits the XRD patterns of representative phosphors as well as the standard card of Ba3La(PO4)3 for comparison. It can be found that all the diffraction peaks of the samples can be exactly assigned to the pure cubic phase Ba3La(PO4)3 (JCPDS 85-2448). No other phase or impurity were detected, indicating that the doped ions cannot induce significant changes in the crystal structure. In other words, our samples were obtained without any heterogeneous phase. The SEM images of BCP, BCP:0.07Tb3+, BCP:0.07Tb3+,0.07Mn2+ and BCP:0.07Tb3+,0.07Sm3+ are shown in the lower part of Fig. 1. It was found that the samples consisted of aggregated particles with a sphere-like morphology of an average size of 5–10 μm. A micrometer-size of the phosphor particles is essential for high luminescence, and the synthesized phosphors exhibit a particle size in the micrometer range, and hence, they can exhibit a good luminescence.
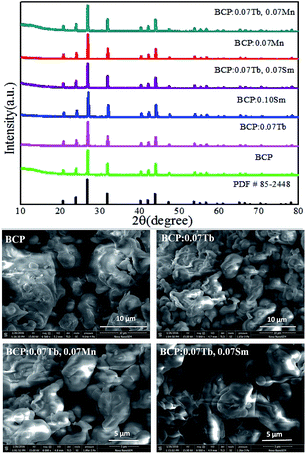 |
| | Fig. 1 X-ray diffraction patterns of BCP; BCP:0.07Tb; BCP:0.10Sm; BCP:0.07Tb,0.07Sm; BCP:0.07Mn; BCP:0.07Tb,0.07Mn and JCPDS card no. 85-2448, corresponding to Ba3La(PO4)3. Below are the SEM images of the samples. | |
For the purpose of further elucidating the crystal structure of the samples, we analyzed the XRD patterns by Rietveld refinements, as represented in Fig. 2(a–e). The multiplication sign denotes the XRD pattern of the samples, the red lines represent the corresponding Rietveld refinement, and the blue line represents the residuals. The refinement results, as presented in Table 1, further demonstrate that the phosphors are single-phase without any impurity or secondary phases. As shown in Fig. 2(f), (I) is the crystal structure of Ba3La(PO4)3 in a cubic system with space group I![[4 with combining macron]](https://www.rsc.org/images/entities/char_0034_0304.gif) 3d of the unit cell, and (II) and (III) are the coordination environments of the P5+ and Ba2+/La3+/Ce3+ sites. In the structure, each P5+ is surrounded by 8 O2− anions to form an octahedron with four long P–O distances of 1.501 Å and four short P–O distances of 1.488 Å. Each Ba2+ is coordinated with 18 non-equidistant oxygens at the distance ranging from 2.704 Å to 2.973 Å.
3d of the unit cell, and (II) and (III) are the coordination environments of the P5+ and Ba2+/La3+/Ce3+ sites. In the structure, each P5+ is surrounded by 8 O2− anions to form an octahedron with four long P–O distances of 1.501 Å and four short P–O distances of 1.488 Å. Each Ba2+ is coordinated with 18 non-equidistant oxygens at the distance ranging from 2.704 Å to 2.973 Å.
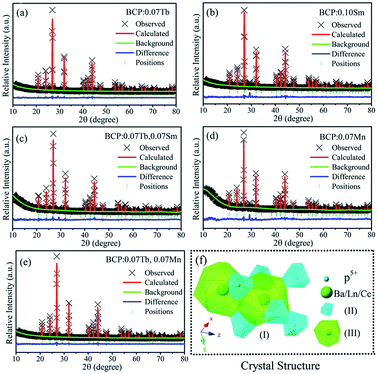 |
| | Fig. 2 (a)–(e) Rietveld refinements of BCP:0.07Tb; BCP:0.10Sm; BCP:0.07Tb,0.07Sm; BCP:0.07Mn and BCP:0.07Tb,0.07Mn; (f) crystal structure of Ba3La(PO4)3. | |
Table 1 XRD refinement results of the samples
| |
BCP:0.07Tb |
BCP:0.07Mn |
BCP:0.10Sm |
BCP: 0.07Tb,0.07Mn |
BCP: 0.07Tb,0.07Sm |
| χ2 |
2.850 |
1.704 |
2.058 |
1.983 |
1.587 |
| Rp |
8.49% |
7.48% |
8.44% |
8.04% |
7.30% |
| Rwp |
12.67% |
7.84% |
10.18% |
11.16% |
7.15% |
| a = b = c |
10.500 |
10.512 |
10.520 |
10.501 |
10.514 |
| Cell volume/A3 |
1157.158 |
1161.657 |
1164.305 |
1158.073 |
1162.349 |
| α = β = γ |
90° |
90° |
90° |
90° |
90° |
| Z |
4 |
4 |
4 |
4 |
4 |
| Space group |
I![[4 with combining macron]](https://www.rsc.org/images/entities/char_0034_0304.gif) 3d 3d |
I![[4 with combining macron]](https://www.rsc.org/images/entities/char_0034_0304.gif) 3d 3d |
I![[4 with combining macron]](https://www.rsc.org/images/entities/char_0034_0304.gif) 3d 3d |
I![[4 with combining macron]](https://www.rsc.org/images/entities/char_0034_0304.gif) 3d 3d |
I![[4 with combining macron]](https://www.rsc.org/images/entities/char_0034_0304.gif) 3d 3d |
3.2 Luminescence properties
The inset of Fig. 3 shows the emission and excitation spectra of BCP. Under excitation at 325 nm, BCP shows a broad-band blue emission ranging from 350 to 550 nm, centered at 387 nm. This emission is attributed to the transition of Ce3+ from the 5d excited state to the 4f ground state. The corresponding excitation spectrum (monitored at 387 nm) covering the range of 200–350 nm is attributed to the 4f → 5d transition of Ce3+. Fig. 3 shows the decay curve of BCP, and the luminescence decay time can be calculated by the following formula:27| |
 | (1) |
where I(t) represents the luminescence intensity at a time t, t is the time, and τ is the lifetime. The calculated decay time is shown in Fig. 3. Moreover, the measured quantum efficiency of the host was 55.3%.
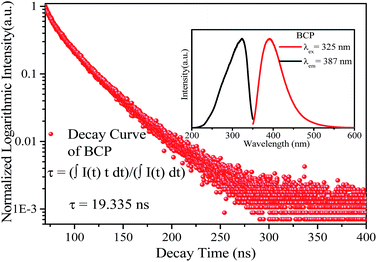 |
| | Fig. 3 Decay curve of BCP, the inset shows the emission and excitation spectra of BCP. | |
To study whether there is energy transfer from Ce to Tb, we studied the emission and excitation spectra of BCP and BTP (Ba3Tb(PO4)3), as shown in Fig. 4. For BTP, the excitation spectrum monitored at 551 nm contains two broad bands and many other bands, which are attributed to f → d and f → f transitions in Tb3+. The emission spectrum at 377 nm excitation consists of several bands from 480 to 650 nm, attributed to 5D4 → 7FJ (J = 6, 5, 4, 3) transitions in Tb3+. Moreover, the results show that there is an overlap between the emission spectrum of BCP and the excitation spectrum of BTP. Therefore, we hypothesized that Ce3+ might transfer its energy to Tb3+ in eulytite-type phosphates. Fig. 4(c) and (d) depict the emission and excitation spectra of BCP:0.03Tb3+ and BTP:0.03Ce3+, respectively. It can be clearly seen that the excitation spectra monitored at 551 nm for BCP:0.03Tb3+is similar to the excitation spectrum monitored at 387 nm for BCP. Moreover, both emission spectra (λex = 325 nm) of the doped BCP and BTP display the characteristic peaks of Ce3+ and Tb3+. Thus, we synthesized BCP:xTb3+ to further explore whether energy transfer occurs. As depicted in Fig. 4(e), the emission spectra (λex = 325 nm) of all samples contain both Ce3+ and Tb3+ emission bands. In addition, as shown in Fig. 4(f), the emission intensity of Ce3+ monotonously decreases as the Tb3+ concentration increases, which evidences the occurrence of energy transfer from Ce3+ to Tb3+. Importantly, the emission color shifts from cyan to green as Tb3+ concentration increases in BCP:xTb3+.
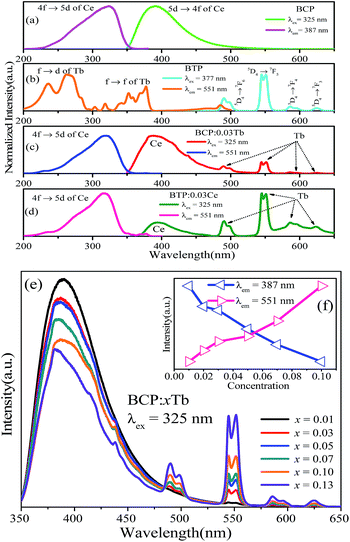 |
| | Fig. 4 (a)–(d) Emission and excitation spectra of BCP, BTP, BCP:0.03Tb, and BTP:0.03Ce. (e) Emission spectra of BCP:xTb (λex = 325 nm) (x = 0.01–0.13). (f) Ce3+ and Tb3+ intensity versus Tb3+ concentration in BCP:xTb. | |
To obtain white emission, there should be a red component in the emission spectrum of the phosphor. Thus, we first synthesized a series of Ce3+/Mn2+ and Ce3+/Sm3+ co-doped phosphors. To investigate the luminescence characteristics, the emission and excitation spectra were obtained and are shown in Fig. 5(a). The excitation spectra of BCP:0.10Sm monitored at 606 nm and 387 nm are similar in the range from 200 to 370 nm. The differences from 370 to 550 nm is due to the transitions of Sm3+. Furthermore, the excitation spectrum monitored at 606 nm has a broad overlap with the emission spectrum excited at 325 nm of BCP. Thus, energy transfer from Ce3+ to Sm3+ ions in BCP:0.10Sm3+ may take place. Moreover, we synthesized a series of BCP:zSm, and their spectra at 325 nm excitation contain both Ce3+ and Sm3+ emission bands, as shown in Fig. 5(b). The inset is the enlarged spectra from 560 to 680 nm centered at 565, 606 and 650 nm, which are assigned to the 4G5/2 → 6H5/2, 6H7/2 and 6H9/2 transitions of Sm3+, respectively. As depicted in Fig. 5(c), the emission intensity of Ce3+ decreases as the Sm3+ concentration increases. Moreover, the emission intensity of Sm3+ steeply increases until it reaches a maximum at z = 0.10. Then, due to concentration quenching, the emission intensity gradually decreases, which further evidences the energy transfer from Ce3+ to Sm3+ ions. As a result of the energy transfer, in the co-doped BCP:zSm3+, the color can turn from cyan to pale pink.
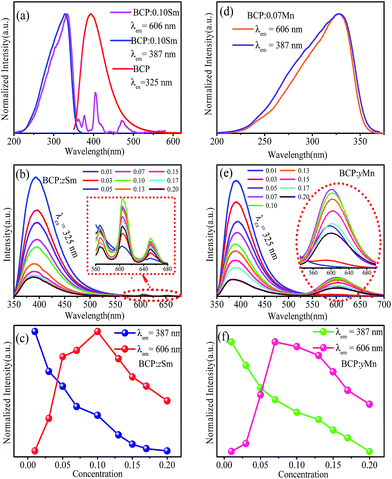 |
| | Fig. 5 (a) Emission spectra of BCP:0.10Sm and excitation spectrum of BCP. (b) Emission spectra of BCP:zSm. (c) Variation in the emission intensity with different z. (d) Emission spectra of BCP:0.07Mn. (e) Emission spectra of BCP:yMn. (f) Variation in the emission intensity with different y. | |
In addition, as shown in Fig. 5(d), the excitation spectra of Mn2+ ion monitored at 606 nm is exactly the same to that of Ce3+ ion monitored at 387 nm in BCP:0.07Mn2+. This implies that energy transfer from Ce3+ to Mn2+ ions should also occur. To further prove this hypothesis, the emission spectra of BCP:yMn2+ at 325 nm excitation were obtained and are shown in Fig. 5(e). There are two broad emission bands, the one from 350 to 500 nm is attributed to the 5d to 4f transition in Ce3+, and the other band, from 550 nm to 700 nm is attributed to the 4T1(4G) → 6A1(6S) spin-forbidden transition of Mn2+.28,29 The variation in emission intensity with different Mn2+ contents, depicted in Fig. 5(f), shows that the intensity of Ce3+ gradually decreases, whereas the intensity of Mn2+ first increases, and then decreases as the concentration of Mn2+ increases due to concentration quenching. Thus, these results evidence the occurrence of energy transfer from Ce3+ to Mn2+ ions. As a result of the energy transfer, in the co-doped BCP:yMn2+, the color can change from blue to red.
For the purpose of further demonstrating the energy transfer in BCP:xTb3+, BCP:yMn2+ and BCP:zSm3+, Fig. 6 presents the decay curves of the abovementioned samples. Fig. 6(a–c) show the decay curves of Ce3+ in BCP:xTb3+, BCP:yMn2+, and BCP:zSm3+ monitored at 387 nm upon 325 nm excitation. Moreover, Fig. 6(d–f) show the corresponding decay curves of Tb3+ (λem = 551 nm, λex = 377 nm), Mn2+ (λem = 606 nm, λex = 387 nm), and Sm3+ (λem = 606 nm, λex = 387 nm) in BCP:xTb3+, BCP:yMn2+, and BCP:zSm3+, respectively. The decay time values of Ce, Tb, Mn, and Sm in the corresponding samples, as shown in Table 2, were calculated according to formula (1).
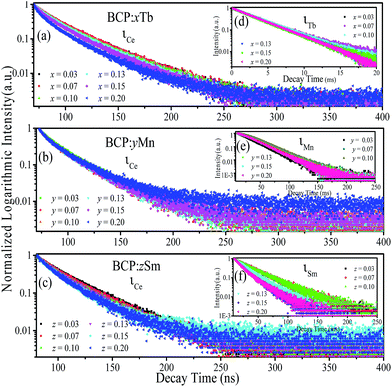 |
| | Fig. 6 (a–c) Decay curves of Ce3+ in BCP:xTb, BCP:yMn, and BCP:zSm. (d–f) Decay curves of Tb3+ in BCP:xTb, Mn2+ in BCP:yMn, and Sm3+ in BCP:zSm. | |
Table 2 Decay time values of Ce/Tb/Mn/Sm in the phosphors and efficiency of the energy transfer from Ce to the doping ions
| |
τCe (ns) |
τTb/τMn/τSm (ms) |
η |
| BCP:xTb |
x = 0.03 |
10.311 |
3.494 |
0.534 |
| x = 0.07 |
10.300 |
3.587 |
0.532 |
| x = 0.10 |
8.809 |
3.499 |
0.456 |
| x = 0.13 |
8.296 |
3.398 |
0.429 |
| x = 0.15 |
7.546 |
3.296 |
0.390 |
| x = 0.20 |
5.020 |
3.180 |
0.260 |
| BCP:yMn |
y = 0.03 |
8.393 |
26.451 |
0.434 |
| y = 0.07 |
6.883 |
30.551 |
0.356 |
| y = 0.10 |
6.383 |
29.044 |
0.330 |
| y = 0.13 |
6.316 |
25.772 |
0.327 |
| y = 0.15 |
6.287 |
25.089 |
0.325 |
| y = 0.20 |
6.176 |
22.010 |
0.319 |
| BCP:zSm |
z = 0.03 |
15.610 |
28.762 |
0.807 |
| z = 0.07 |
12.051 |
28.909 |
0.623 |
| z = 0.10 |
11.827 |
28.958 |
0.612 |
| z = 0.13 |
9.921 |
22.058 |
0.513 |
| z = 0.15 |
9.496 |
16.233 |
0.491 |
| z = 0.20 |
9.197 |
15.650 |
0.476 |
From Table 2, it can be observed that the decay time values of Ce3+ in doped BCP are all lower than the decay time of Ce3+ in BCP, which is shown in Fig. 3. Moreover, the decay time decreases as the amount of doping Tb3+/Mn2+/Sm3+ in BCP increases. For Tb3+ in BCP:xTb3+, Mn2+ in BCP:yMn2+ and Sm3+ in BCP:zSm3+, the decay time increases first and then rapidly decreases as the amount of doping ions increases, which is attributed to the energy transfer and concentration quenching effect, respectively. In other words, when the ion content is higher, the distance between ions becomes smaller and energy can transfer from Ce to Tb/Mn/Sm. Thus, the increase in decay time is a result of two aspects: one is the increasing ions concentration and the other is the energy transfer from Ce to the doping ions. However, when the concentration of doping ions is high enough, concentration quenching occur. Thus, the results once again confirm the energy transfer from Ce3+ to Tb3+/Mn2+/Sm3+ in BCP:xTb3+, BCP:yMn2+ and BCP:zSm3+.
The energy transfer efficiency between the ions was also calculated from the decay lifetimes by the following equation:
where
τ and
τ0 are the lifetimes of sensitizer ions with and without the presence of an activator, respectively. The energy transfer efficiencies are also shown in
Table 2.
For investigating the energy transfer mechanism from Ce3+ to Tb3+/Mn2+/Sm3+ in BCP:xTb3+, BCP:yMn2+ and BCP:zSm3+, the critical distance (Rc) between sensitizer and activator needs to be calculated. According to the Dexter's theory,30 there are two types of interactions between sensitizer and activator: exchange interaction and multipolar interaction. The distance between sensitizer and activator becomes increasingly shorter as the concentration of activator increases. Thus, the probability of energy transfer will increase, which will cause the concentration quenching to occur and the energy migration should be hindered. The critical distance for energy transfer between sensitizer and activator in the phosphors can be calculated by equation:31
where
V is the volume of the unit cell,
Z is the number of host cations per unit cell, and
X is the total concentration of sensitizer and activator at which the emission intensity of Ce
3+ is half the emission intensity of the sample in the absence of Tb
3+/Mn
2+/Sm
3+. For BCP,
V is 1163.33 Å
3,
Z is 4. Moreover,
X are 0.10, 0.07, and 0.03 for BCP:
xTb
3+, BCP:
yMn
2+ and BCP:
zSm
3+, respectively. Thus, the corresponding critical distances (
Rc) were estimated to be about 17.7 Å, 19.8 Å, and 26.46 Å for BCP:
xTb
3+, BCP:
yMn
2+ and BCP:
zSm
3+, respectively. These results indicate that exchange interaction is almost impossible as exchange interaction is predominant only for about 5 Å. Therefore, the energy transfer mechanism should occur through electric multipolar interaction. According to the Dexter's multipolar interaction formula and the Reisfeld's approximation, the following relationship can be applied:
32,33where
ηs0 and
ηs are the luminescence quantum efficiency of Ce
3+ ions without and with Tb
3+/Mn
2+/Sm
3+ ions, respectively.
C is the total concentration of Ce
3+ and Tb
3+/Mn
2+/Sm
3+ ions. The value of
α can be 6, 8, and 10, corresponding to dipole–dipole, dipole–quadrupole, and quadrupole–quadrupole interactions, respectively. In addition, the ratio of quantum efficiencies can be calculated from the ratio of emission intensity by the following expression:
34,35where
Is0 and
Is are the emission intensity of Ce
3+ ions without and with Tb
3+/Mn
2+/Sm
3+. The relationship between
Is0/
Is and
Cα/3 is illustrated in
Fig. 7. The results show that the energy transfer from Ce
3+ to Tb
3+ occurs through quadrupole–quadrupole interactions, whereas the energy transfer from Ce
3+ to Mn
2+/Sm
3+ occurs through dipole–dipole interactions.
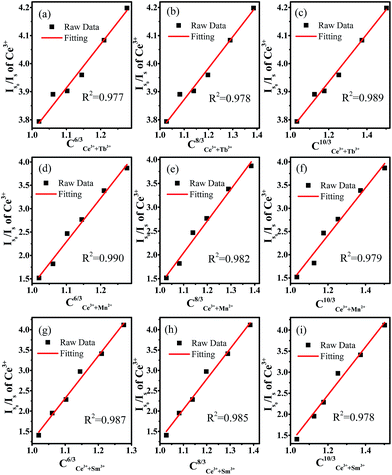 |
| | Fig. 7 (Is0/Is) dependence on Ce3+ for (a–c) CCe3++Tb3+(6,8,10)/3, (d–f) CCe3++Mn2+(6,8,10)/3, (g–i) CCe3++Sm3+(6,8,10)/3. | |
Based on the abovementioned discussion, BCP can produce blue emission, the color of BCP:xTb3+ can turn from cyan to green, the color of BCP:yMn can shift from blue to red, and that of BCP:zSm can change from cyan to pale pink. Accordingly, co-doping Tb3+ and Mn2+/Sm3+ ions in BCP may render white light. Fig. 8(A) shows the emission spectra of BCP:0.07Tb3+,yMn2+. It can be seen that the characteristic peaks of Ce3+, Tb3+, and Mn2+ all appear in the spectra. Moreover, the intensity of the peaks vary with the concentration of Mn2+. The inset shows the variation trend for the intensity. As the concentration of Mn2+ increases, the emission intensity of Ce3+ and Tb3+ all steadily decrease, whereas the emission intensity of Mn2+ increases at the beginning and then decreases. The decrease in the emission of Ce3+ is due to the energy transfer from Ce3+ to Tb3+ and Mn2+, and the variation in Mn2+ emission is a result of concentration quenching. Moreover, the concentration quenching point for Mn2+ is 0.05, which is lower than that in BCP:yMn. Thus, we considered that there may be an additional energy transfer to Mn2+, as well as from Ce3+. Moreover, the emission intensity of Tb3+ gradually decreases although there is energy transfer from Ce3+ to Tb3+. All these results indicate that energy transfer may also occur from Tb3+ to Mn2+ in BCP:0.07Tb3+,yMn2+ phosphors. Moreover, as shown in Fig. 8(B), BCP:0.07Tb3+,zSm3+ shows a similar result to that of BCP:0.07Tb3+,yMn2+. There are also emission peaks of Ce3+, Tb3+ and Sm3+, and the variation trend in the inset shows that energy can be transferred from Ce3+ to Tb3+ and Sm3+. Similarly, the comparison of Sm3+ concentration quenching point between BCP:0.07Tb3+,zSm3+ and BCP:zSm3+, and the decreased emission of Tb3+ indicate energy transfer from Tb3+ to Sm3+ in BCP:0.07Tb3+,zSm3+.
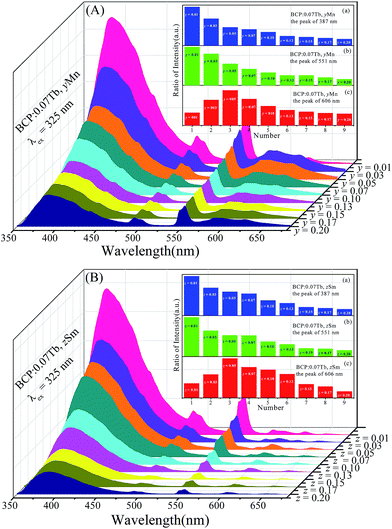 |
| | Fig. 8 ((A) and (B)) Emission spectra of BCP:0.07Tb,yMn and BCP:0.07Tb,zSm; the insets of (A) and (B) are the corresponding ratios of peak intensities at 387 nm, 551 nm, and 606 nm. | |
To further investigate the energy transfer from Tb3+ to Mn2+/Sm3+ in BCP:0.07Tb3+,yMn2+ and BCP:0.07Tb3+,zSm3+, the decay curves of Tb3+ (λem = 551 nm, λex = 377 nm), Mn2+ (λem = 606 nm, λex = 387 nm), and Sm3+ (λem = 606 nm, λex = 387 nm) were obtained and are plotted in Fig. 9. The corresponding decay time values, calculated by formula (1), are listed in Table 3. Upon comparing the decay time values in Table 3 with the values in Table 2, we found significant differences. First, the decay time of Tb3+ in BCP:0.07Tb3+ is 3.587 ms. On the other hand, the decay time of Tb3+ in both BCP:0.07Tb3+,yMn2+ and BCP:0.07Tb3+,zSm3+ decreases as the concentration of doping ion increases. Moreover, we found that the decay time values of Mn2+ in BCP:0.07Tb,yMn2+ are also greater than those in BCP:yMn2+ at the same concentration of Mn2+, which is also the same for the decay time values of Sm3+. Based on these results, we can confirm that there is energy transfer from Tb3+ to Mn2+/Sm3+. Moreover, the decay time of Mn2+/Sm3+ all increase at the beginning, reach a maximum at the concentration of 0.07, and thereafter decrease, which is consistent with the variation in emission intensity in Fig. 8. The change in the Mn2+/Sm3+ decay time is a combination of energy transfer from Ce3+/Tb3+ to the doping ions and concentration quenching. Moreover, we also calculated the decay time values of Ce3+ (λem = 325 nm, λex = 387 nm) in BCP:0.07Tb3+,yMn2+ and BCP:0.07Tb3+,zSm3+, and found that the values are all smaller than in BCP:xTb3+, BCP:yMn3+, or BCP:zSm3+ at the same concentration of doping ions, further verifying the energy transfer from Ce3+ to Tb3+/Mn2+/Sm3+. Fig. 10 shows the energy transfer relationship among the ions in BCP:0.07Tb3+,yMn2+ and BCP:0.07Tb3+,zSm3+.
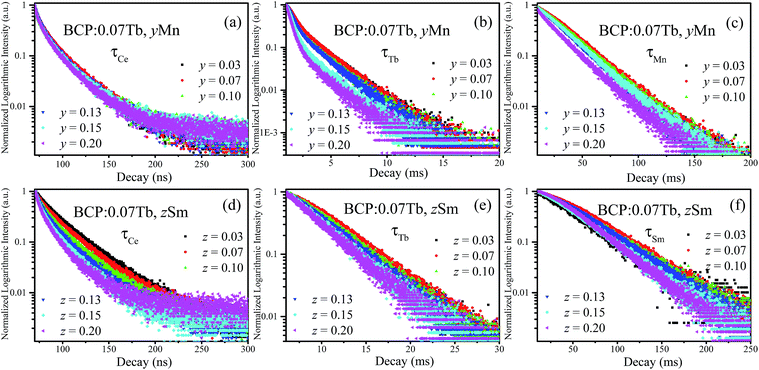 |
| | Fig. 9 (a–c) Decay curves of Ce3+, Tb3+, and Mn2+ in BCP:0.07Tb,yMn; (d–f) decay curves of Ce3+, Tb3+, and Sm3+ in BCP:0.07Tb,zSm. | |
Table 3 Decay time values of Ce/Tb/Mn/Sm in the phosphors
| |
τCe (ns) |
τTb (ms) |
τMn/τSm (ms) |
| BCP:0.07Tb,yMn |
y = 0.03 |
4.505 |
1.455 |
34.666 |
| y = 0.07 |
4.330 |
1.334 |
36.495 |
| y = 0.10 |
4.155 |
1.153 |
35.344 |
| y = 0.13 |
3.757 |
1.126 |
33.073 |
| y = 0.15 |
3.509 |
0.777 |
32.372 |
| y = 0.20 |
3.406 |
0.576 |
25.810 |
| BCP:0.07Tb,zSm |
z = 0.03 |
8.615 |
2.656 |
48.238 |
| z = 0.07 |
6.800 |
2.173 |
54.133 |
| z = 0.10 |
6.028 |
2.139 |
46.310 |
| z = 0.13 |
5.523 |
2.043 |
41.372 |
| z = 0.15 |
4.481 |
2.001 |
40.535 |
| z = 0.20 |
3.878 |
1.912 |
40.337 |
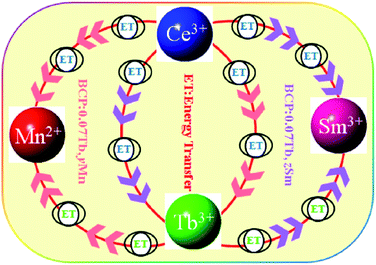 |
| | Fig. 10 Schematic of the energy transfer relationship among the ions in the phosphors. | |
3.3 CIE coordinates
The CIE chromaticity coordinates and the corresponding images of BCP:0.07Tb3+,yMn2+ and BCP:0.07Tb3+,zSm3+ are shown in Fig. 11, along with the images of BCP:xTb3+, BCP:yMn2+ and BCP:zSm3+. The emitting colour can turn from blue to red by adjusting the concentration of Mn2+ in BCP:yMn2+. Moreover, the colour of BCP:zSm3+ can change from cyan to pale pink, and the colour can vary from cyan to green in BCP:xTb3+. In other words, we obtained a series of different emission colours while co-doping the host with ions at different concentrations. More importantly, the CIE chromaticity coordinates (x, y) for BCP:0.07Tb3+,yMn2+ excited at 365 nm vary from (0.2200, 0.3010) to (0.5143, 0.3163), with white emission of BCP:0.07Tb3+,0.07Mn2+. Moreover, the CIE chromaticity coordinates (x, y) for BCP:0.07Tb,zSm3+ vary from (0.1995, 0.2893) to (0.4187, 0.2302), with white emission of BCP:0.07Tb3+,0.05/0.07Sm3+. Therefore, we obtained white emission via co-doping Tb3+ and Mn2+/Sm3+ in BCP. Additionally, the correlated colour temperatures of BCP:0.07Tb3+,0.07Mn2+, and BCP:0.07Tb3+,0.05/0.07Sm3+ were determined to be 3812, 3196, and 3301 K, respectively, with a quantum efficiency of up to 47.9%, 48.6%, and 51.2%, respectively.
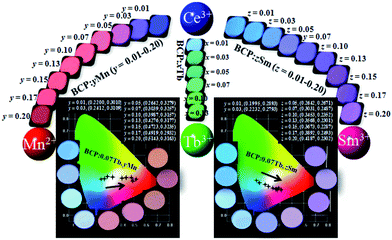 |
| | Fig. 11 CIE chromaticity coordinates and the corresponding images of the BCP:0.07Tb3+,yMn2+ and BCP:0.07Tb3+,zSm3+ phosphors. The images of BCP:yMn can be found at the left, at the right are the images of BCP:zSm, and the images of BCP:xTb are in the middle. | |
3.4 Thermal quenching properties
Thermal stability is an important parameter for phosphors as it can affect the color rendering and emission intensity. To investigate the effect of temperature on luminescence properties, the temperature-dependent emission spectra of BCP:0.07Tb,0.07Mn and BCP:0.07Tb,0.07Sm were obtained and are shown in Fig. 12(a) and (b), where the insets show that the emission intensity depends on the temperature. It is obvious that the emission of Ce3+ in BCP:0.07Tb3+,0.07Mn2+ and BCP:0.07Tb3+,0.07Sm3+ decreases as the temperature increases. By contrast, the emission intensity of Tb3+ and Mn2+/Sm3+ in the phosphors first increases up to a maximum and then decreases. Generally, the emission intensity decreases as temperature increases due to the increase in thermal activation through the crossing point between the ground state and the excited state.36,37 In our study, the increase in Tb3+ and Mn2+/Sm3+ emission intensity may be the result of energy transfer from Ce3+ to the other ions. In other words, the energy transfer efficiency from Ce3+ to the doping ions increases with temperature.38 Fig. 12(e) shows the temperature-dependent emission spectra of BCP, where the emission intensity also decreases with temperature. Moreover, we compared the emission intensity of Ce3+ in BCP, BCP:0.07Tb,0.07Mn and BCP:0.07Tb,0.07Sm at various temperatures, as shown in Fig. 12(f). We can see that the emission intensity of Ce3+ in BCP is higher than that in the co-doped samples at all temperatures, which is due to energy transfer from Ce3+ to the doping ions. The results suggest that Ce3+ may transfer more energy to the ions in the host at higher temperatures. The activation energy for thermal quenching was calculated by the Arrhenius equation:39,40| |
ln(I0/I) = ln![[thin space (1/6-em)]](https://www.rsc.org/images/entities/char_2009.gif) A − Ea/KT A − Ea/KT
| (6) |
where I0 and I are the emission intensity of the phosphors at room temperature and at the experimental temperature, respectively; K is the Boltzmann constant (8.626 × 10⁵ eV); A is a constant; and Ea is the activation energy for thermal quenching. Based on the abovementioned equation, the fitting curve of ln[(I0/I) − 1] versus 1/KT was drawn and illustrated in Fig. 12(c) and (d). The calculated values of Ea were determined to be 0.2595 eV and 0.2346 eV for BCP:0.07Tb3+,0.07Mn2+ and BCP:0.07Tb3+,0.07Sm3+, respectively, which are higher than those for YAG:Ce3+ (Ea = 0.136 eV).41
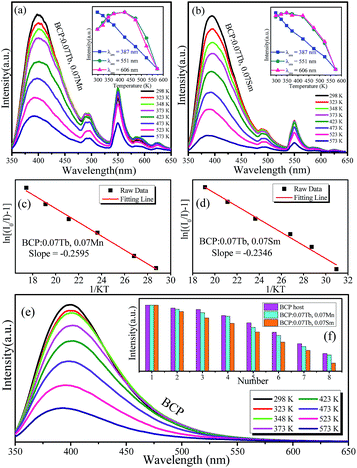 |
| | Fig. 12 (a) and (b) Temperature-dependent emission spectra of BCP:0.07Tb,0.07Mn and BCP:0.07Tb,0.07Sm; insets show the changes in emission intensity with temperature of the corresponding ions. (c) and (d) Activation energies of the phosphors. (e) Temperature-dependent emission spectra of BCP; the inset shows a comparison of the emission intensity of BCP, BCP:0.07Tb,0.07Mn and BCP:0.07Tb,0.07Sm at every temperature. | |
4 Conclusions
In summary, we synthesized a series of BCP:xTb3+, BCP:yMn2+, and BCP:zSm3+ phosphors and investigated their luminescence properties. The energy transfer from Ce3+ to Tb3+/Mn2+/Sm3+ occurs in BCP:xTb3+, BCP:yMn2+, and BCP:zSm3+ via quadrupole–quadrupole, dipole–dipole, and dipole–dipole interactions, respectively, with a tunable color. More importantly, when co-doped Tb3+ and Mn2+/Sm3+ in BCP, the energy of Ce3+ can not only transfer to Tb, but also to Mn/Sm3+. Moreover, Tb3+ can also transfer part of its energy to Mn2+/Sm3+ in the phosphors. Above all, we obtained a white emission based on the energy transfer among the ions, and the correlated color temperatures can reach up to about 3200 K, and the quantum efficiency can be as high as 52%. In summary, the results show that we managed to obtain white phosphors by co-doping a Ba3Ce(PO4)3 host with Tb3+ and Mn2+/Sm3+.
Acknowledgements
This work was supported by the National Natural Science Foundation of China (No. 50902042; 51672066), the Funds for Distinguished Young Scientists of the Hebei Province, China (No. A2015201129), the Natural Science Foundation of the Hebei Province, China (No. A2014201035, E2014201037), the Education Office Research Foundation of the Hebei Province, China (No. ZD2014036, QN2014085), the China Postdoctoral Science Foundation funded project (No. 2015M581311), the personnel training project of the Hebei Province, China (No. A2016002013), and the Post-graduate's Innovation Fund Project of the Hebei University (No. X2016064, X2016063).
Notes and references
- P. F. Smet, A. B. Parmentier and D. Poelman, J. Electrochem. Soc., 2011, 158, R37–R54 CrossRef CAS.
- C. C. Lin and R. S. Liu, J. Phys. Chem. Solids, Lett. Sect., 2011, 2(11), 1268–1277 CrossRef CAS PubMed.
- L. Chen, C. C. Lin, C. W. Yeh and R. S. Liu, Materials, 2010, 3(3), 2172–2195 CrossRef CAS.
- N. C. George, K. A. Denault and R. Seshadri, Annu. Rev. Mater. Res., 2013, 43, 481–501 CrossRef CAS.
- Z. G. Xia and R. S. Liu, J. Phys. Chem. C, 2012, 116, 15604–15609 CAS.
- G. Y. Lee, J. Y. Han, W. B. Im, S. H. Cheong and D. Y. Jeon, Inorg. Chem., 2012, 51(20), 10688–10694 CrossRef CAS PubMed.
- H. S. Roh, S. Hur, H. J. Song, I. J. Park, D. K. Yim, D. W. Kim and K. S. Hong, Mater. Lett., 2012, 70(3), 37–39 CrossRef CAS.
- V. Bachmann, C. Ronda and A. Meijerink, Chem. Mater., 2009, 21, 2077–2084 CrossRef CAS.
- S. Ye, F. Xiao, Y. X. Pan, Y. Y. Ma and Q. Y. Zhang, Mater. Sci. Eng., R, 2010, 71(1), 1–34 CrossRef.
- W. R. Liu, C. H. Huang, C. W. Yeh, J. C. Tsai, Y. C. Chiu, Y. T. Yeh and R. S. Liu, Inorg. Chem., 2012, 51, 9636–9641 CrossRef CAS PubMed.
- R. Yu, H. M. Noh, B. K. Moon, C. C. Byung, H. J. Jung, J. Kiwan, S. Y. Soung and K. J. Jun., J. Alloys Compd., 2013, 576(29), 236–241 CrossRef CAS.
- C. C. Zhao, X. Yin, Y. M. Wang, F. Q. Huang and Y. Hang, J. Lumin., 2012, 132(3), 617–621 CrossRef CAS.
- W. Zhou, D. Hou, F. Pan, B. Zhang, P. Dorenbos, Y. Huang, Y. Tao and H. Liang, J. Mater. Chem. C, 2015, 3, 9161–9169 RSC.
- J. He, R. Shi, M. G. Brik, P. Dorenbos, Y. Huang, Y. Tao and H. Liang, J. Lumin., 2015, 161, 257–263 CrossRef CAS.
- D. Hou, C. Liu, X. Kuang and H. Liang, Opt. Express, 2012, 20(27), 28969–28980 CrossRef CAS PubMed.
- L. Zhou, H. Liang, P. A. Tanner, S. Zhang, D. Hou, C. Liu and L. Li, J. Mater. Chem. C, 2013, 1(43), 7155–7165 RSC.
- T. Sheng, Z. Fu, X. Wang, S. Zhou, S. Zhang and Z. Dai, J. Phys. Chem. C, 2012, 116(36), 19597–19603 CAS.
- C. H. Huang, L. Y. Luo and T. M. Chen, J. Electrochem. Soc., 2011, 158, J341–J344 CrossRef CAS.
- C. H. Hsu and C. H. Lu, J. Mater. Chem., 2011, 21(9), 2932–2939 RSC.
- T. Li, P. L. Li, Z. J. Wang, S. C. Xu, Q. Y. Bai and Z. P. Yang, RSC Adv., 2015, 5, 71735–71742 RSC.
- N. Guo, Y. Jia, W. Lu, W. Lv, Q. Zhao, M. Jiao, B. Shao and H. You, Dalton Trans., 2013, 42, 5649–5654 RSC.
- Z. Wang, S. Lou and P. Li, J. Lumin., 2014, 156, 87–90 CrossRef CAS.
- N. Guo, Y. Huang, Y. Jia, W. Lv, Q. Zhao, W. Lü, Z. Xia and H. You, Dalton Trans., 2013, 42(4), 941–947 RSC.
- H. P. Ji, Z. H. Huang, Z. G. Xia, M. S. Molokeev, X. X. Jiang, Z. S. Lin and V. V. Atuchin, Dalton Trans., 2015, 44, 7679–7686 RSC.
- T. Li, P. L. Li, Z. J. Wang, S. C. Xu, Q. Y. Bai and Z. P. Yang, Inorg. Chem., 2016, 55, 8758–8769 CrossRef CAS PubMed.
- C. Wang, P. L. Li, Z. J. Wang, Y. S. Sun, J. G. Cheng, Z. L. Li, M. M. Tian and Z. P. Yang, Phys. Chem. Chem. Phys., 2016, 18, 28661–28673 RSC.
- Y. Jia, H. Qiao, Y. Zheng, N. Guo and H. You, Phys. Chem. Chem. Phys., 2012, 41, 3537–3542 RSC.
- N. Guo, H. P. You, Y. H. Song, M. Yang, K. Liu, Y. H. Zheng, Y. J. Huang and H. J. Zhang, J. Mater. Chem., 2010, 20, 9061–9067 RSC.
- F. Xiao, E. H. Song and Q. Y. Zhang, Spectrochim. Acta, Part A, 2014, 122, 343–347 CrossRef CAS PubMed.
- D. L. Dexter and J. H. Schulman, J. Chem. Phys., 1954, 22(6), 1063–1070 CrossRef CAS.
- D. L. Dexter, J. Chem. Phys., 1953, 21(5), 836–850 CrossRef CAS.
- R. Reisfeld, E. Greenberg, R. Velapoldi and B. Barnett, J. Chem. Phys., 1972, 56(4), 1698–1705 CrossRef CAS.
- C. H. Huang, T. W. Kuo and T. M. Chen, ACS Appl. Mater. Interfaces, 2010, 2(5), 1395–1399 CAS.
- K. H. Kwon, W. B. Im, H. S. Jang, H. S. Yoo and D. Y. Jeon, Inorg. Chem., 2009, 48(11), 11525–11532 CrossRef CAS PubMed.
- P. Paulose, G. Jose, V. Thomas, N. Unnikrishnan and M. Warrier, J. Phys. Chem. Solids, 2003, 64(5), 841–846 CrossRef CAS.
- K. Li, M. J. Xu, J. Fan, M. M. Shang, H. Z. Lian and J. Lin, J. Mater. Chem. C, 2015, 3, 11618–11628 RSC.
- Y. P. Varshini, Physica, 1967, 34(1), 149–154 CrossRef.
- C. Wang, P. L. Li, Z. J. Wang, Y. S. Sun, J. G. Cheng, Z. L. Li, M. M. Tian and Z. P. Yang, Phys. Chem. Chem. Phys., 2016, 18, 28661–28673 RSC.
- W. Lv, Y. Jia, Q. Zhao, M. Jiao, B. Shao, W. Lü and H. You, Adv. Opt. Mater., 2013, 2(2), 183–188 CrossRef.
- Y. H. Chen, B. Liu, C. S. Shi, G. H. Ren and G. Zimmerer, Nucl. Instrum. Methods Phys. Res., 2005, 537(1–2), 31–35 CrossRef CAS.
- Y. F. Zhang, L. Li, X. S. Zhang and Q. Xi, J. Rare Earths, 2008, 26, 446–449 CrossRef.
|
| This journal is © The Royal Society of Chemistry 2017 |
Click here to see how this site uses Cookies. View our privacy policy here.  Open Access Article
 *,
Panlai Li
 *,
Ting Li,
Qiongyu Bai,
Jiang Sun and
Zhiping Yang
![[4 with combining macron]](https://www.rsc.org/images/entities/char_0034_0304.gif) 3d space group. Energy can be transferred from Ce3+ to Tb3+/Mn2+/Sm3+ in Ba3Ce(1−x)(PO4)3:xTb3+, Ba3Ce(1−y)(PO4)3:yMn2+, and Ba3Ce(1−z)(PO4)3:zSm3+ phosphors. Furthermore, the color of these phosphors can turn from cyan to green, blue to red, and cyan to pale pink. When Ba3Ce(PO4)3 was co-doped with Tb3+ and Mn2+/Sm3+, Tb3+ could also transfer part of its energy to Mn2+/Sm3+, and more importantly, a white emission can be achieved based on this energy transfer. The phosphors exhibited a good thermal stability, with correlated color temperatures of up to 3301 K, and a quantum efficiency as high as 51.2%. These results revealed that we managed to obtain good white emitting phosphors by co-doping Ba3Ce(PO4)3 with Tb3+ and Mn2+/Sm3+.
3d space group. Energy can be transferred from Ce3+ to Tb3+/Mn2+/Sm3+ in Ba3Ce(1−x)(PO4)3:xTb3+, Ba3Ce(1−y)(PO4)3:yMn2+, and Ba3Ce(1−z)(PO4)3:zSm3+ phosphors. Furthermore, the color of these phosphors can turn from cyan to green, blue to red, and cyan to pale pink. When Ba3Ce(PO4)3 was co-doped with Tb3+ and Mn2+/Sm3+, Tb3+ could also transfer part of its energy to Mn2+/Sm3+, and more importantly, a white emission can be achieved based on this energy transfer. The phosphors exhibited a good thermal stability, with correlated color temperatures of up to 3301 K, and a quantum efficiency as high as 51.2%. These results revealed that we managed to obtain good white emitting phosphors by co-doping Ba3Ce(PO4)3 with Tb3+ and Mn2+/Sm3+.![[4 with combining macron]](https://www.rsc.org/images/entities/char_0034_0304.gif) 3d of the unit cell, and (II) and (III) are the coordination environments of the P5+ and Ba2+/La3+/Ce3+ sites. In the structure, each P5+ is surrounded by 8 O2− anions to form an octahedron with four long P–O distances of 1.501 Å and four short P–O distances of 1.488 Å. Each Ba2+ is coordinated with 18 non-equidistant oxygens at the distance ranging from 2.704 Å to 2.973 Å.
3d of the unit cell, and (II) and (III) are the coordination environments of the P5+ and Ba2+/La3+/Ce3+ sites. In the structure, each P5+ is surrounded by 8 O2− anions to form an octahedron with four long P–O distances of 1.501 Å and four short P–O distances of 1.488 Å. Each Ba2+ is coordinated with 18 non-equidistant oxygens at the distance ranging from 2.704 Å to 2.973 Å.
![[4 with combining macron]](https://www.rsc.org/images/entities/char_0034_0304.gif) 3d
3d![[4 with combining macron]](https://www.rsc.org/images/entities/char_0034_0304.gif) 3d
3d![[4 with combining macron]](https://www.rsc.org/images/entities/char_0034_0304.gif) 3d
3d![[4 with combining macron]](https://www.rsc.org/images/entities/char_0034_0304.gif) 3d
3d![[4 with combining macron]](https://www.rsc.org/images/entities/char_0034_0304.gif) 3d
3d


![[thin space (1/6-em)]](https://www.rsc.org/images/entities/char_2009.gif) A − Ea/KT
A − Ea/KT


