 Open Access Article
Creative Commons Attribution 3.0 Unported Licence
One-step preparation and application of magnetic sludge-derived biochar on acid orange 7 removal via both adsorption and persulfate based oxidation
Jia Wangab,
Zhuwei Liaob,
Jerosha Ifthikara,
Lerong Shib,
Zhuqi Chen *ac and
Zhulei Chen*b
aKey Laboratory of Material Chemistry for Energy Conversion and Storage, Ministry of Education, Hubei Key Laboratory of Material Chemistry and Service Failure, School of Chemistry and Chemical Engineering, Huazhong University of Science and Technology, Wuhan 430074, P. R. China. E-mail: wangjia910906@163.com; jerosha.ifthikar@gmail.com; zqchen@hust.edu.cn
bDepartment of Environmental Engineering, School of Environmental Science and Engineering, Huazhong University of Science and Technology, Wuhan 430074, P. R. China. E-mail: liaozhuwei@hust.edu.cn; shilerong@yahoo.com; chenzhulei@263.net
cShenzhen Huazhong University of Science and Technology Research Institute, Shenzhen, P. R. China
First published on 28th March 2017
Abstract
Magnetic sludge-derived biochar (MSDBC) was synthetized via a one-step co-precipitation method and conducted as a novel heterogeneous catalyst of persulfate (PS) activation for the oxidative removal of acid orange 7 (AO7). The porous structure and large surface area benefits the enrichment of the pollutant, while abundant Fe3O4 species and oxygen-containing functional groups promoted the generation of oxidative radicals, thus leading to the remarkable performance of AO7 removal. MSDBC also exhibited good stability with low iron leaching and consistent efficiency in reusability experiments. Radical scavenger experiments and electron paramagnetic resonance studies identified SO4˙− and OH˙ as the dominant oxidative radicals. The magnetic properties and feasible preparation method of MSDBC guaranteed the stability, which was evidenced in detail by the satisfactory reusability performance and low iron leaching during the degradation process. Distinguished from other PS based advanced oxidation processes, acidic conditions favored AO7 removal, while two halide irons Cl− and Br− could promote AO7 removal by MSDBC/PS system. The current outcomes demonstrated our approach of converting solid waste into stable, cheap and multifunctional biochar as a feasible resource utilization method, and was highly suggestive to the treatment of both wastewater and sewage sludge.
1 Introduction
Over the past two decades, persulfate (PS, E0 = 2.01 V) based advanced oxidation processes (AOPs) have been studied intensely for organic pollutant removal in soils and water.1,2 PS alone showed low efficiency on organic pollutant removal under ambient conditions.3,4 Appropriate activation methods should be used to produce more activated sulfate radicals (SO4˙−, E0 = 2.5–3.1 V)2 and hydroxyl radicals (OH˙, E0 = 1.9–2.7 V).5 Methods such as thermal-,6 ultraviolet (UV) light-7 and microwave-8activation needed high energy consumption, and base-activated systems only showed high efficiency under alkaline conditions.9 To overcome the aforementioned drawbacks, novel catalysts have been extensively designed and studied for PS activation. Persulfate can be activated through a one-electron transfer using transition metals such as iron, copper and cobalt etc., among which iron has received considerable attention as a high efficiency, non-toxic, environmentally friendly and cost favored catalyst.10 The most famous route of iron-based catalysts is to decompose persulfate by a one-electron transfer from homogeneous Fe2+ (eqn (1))11 and/or heterogeneous Fe(II) (eqn (2))12 to persulfate.| Fe2+ + S2O82− → Fe3+ + SO42− + SO4˙− | (1) |
![[triple bond, length as m-dash]](https://www.rsc.org/images/entities/char_e002.gif) Fe(II) + S2O82− → Fe(II) + S2O82− → ![[triple bond, length as m-dash]](https://www.rsc.org/images/entities/char_e002.gif) Fe(III) + SO42− + SO4˙− Fe(III) + SO42− + SO4˙−
| (2) |
Comparing homogeneous Fe2+,13 heterogeneous catalysts such as zero valent iron (ZVI),11 iron oxides14 and bimetallic or tri-metallic iron based catalysts15 are more attracted due to vast advantages of heterogeneous reaction process. For instance, for bimetallic or tri-metallic iron based catalysts, on one hand, radicals reactions usually happen on the heterogeneous activated sites of the catalysts which will avoid drawbacks such as iron precipitation under alkaline condition. One the other hand, deposition of additional metal(s) on the surface of iron particles favors slow and sustaining iron corrosion from the catalysts, maintains SO4˙− concentration at an appropriate level, thus avoids self-quenching of superfluous SO4˙−.15
Fe3O4 showed relatively high efficiency on persulfate activation for degradation of some organic pollutants.12,14,16 In addition, the magnetic properties of Fe3O4 can facilitate phase separation. However, Fe3O4 particles tend to aggregate because of the strong magnetic interaction, thereby partly diminishing their potency for persulfate activation.17 To avoid aggregating of Fe3O4 particles, appropriate materials were chosen as support.17–20 Thus, the chemical and physical property of the support itself become the key issue to manipulate the performance of heterogeneous catalyst in PS based AOPs, and low-cost support with large surface area and stability are eagerly desired.
Biochar is considered as one of the most ideal adsorbents in remediation of aqueous pollutants due to its porous structure and low-price.19 Thus, loading magnetic Fe3O4 onto biochar for heterogeneous activation of PS should possess following advantages. Firstly, biochar is cheaper than most of the heterogeneous catalyst support such as another carbon-base material activated carbon (AC).21 Secondly, Fe3O4 will be distributed on the surface of biochar thus aggregating will be avoided. Thirdly, the powdered biochar can be easily separated from aqueous phase by external magnet. Last but not least, high adsorption capacity of the support was reported to concentrate pollutants onto the surface22 or into the interior cavity23 of the synthetic catalysts, and then promote radical oxidation processes because of high instantaneous concentration of reactants. Biochar will show high capacity on pollutant enrichment and then improve efficiency of radical oxidation process.
Herein, we conducted municipal sewage sludge as the feedstock for biochar. On one hand, sludge-derived biochar (SDBC) has been proved as an efficient adsorbent for organic pollutants,21,24 heavy metals25–27 and ammonia nitrogen28 due to its porous surface and abundant surface oxygen-containing functional groups.29 On the other hand, tremendous yield of sewage sludge has become one of the most serious concerns fronting society today, thus transferring sewage sludge into functional materials is a promising strategy of waste resource utilization to meet with the requirement from both ecology and economy.30 Based on above consideration, magnetic sludge-derived biochar (MSDBC) catalyst was prepared by one-step co-precipitation method, and was further employed as adsorbent and persulfate activator to remove organic pollutants. Acid orange 7 (AO7) was chosen as the representative azo dye, which showed certain resistance to biodegradation in conventional aerobic treatment processes.31 Characterizations of MSDBC as well as mechanism study revealed the pathway of oxidative degradation process. Influences of pH and common anions in real wastewater32 were also conducted, in which the removal of AO7 remained consistent. Together with limited iron leaching and remarkable performance in reuse experiments, MSDBC was proved to be a promising catalyst of PS activation for auspicious applications in industries.
2 Methods and materials
2.1 Materials
Dewatered sewage sludge was collected from Tangxun Lake Municipal Wastewater Plant in Wuhan, China. To control iron loading rate, dried sludge was employed as precursor to prepare MSDBC. The aforementioned sludge was dried at 60 °C for 24 hours in an oven. AC was purchased from Tianjin Bashi Chemical Industry Co., Ltd. China. It was ground and passed through a 200 mesh sieve (0.074 mm), stored in a glass jar for further experiments and labeled granular activated carbon (GAC). Deionized water (18.0 mΩ cm) was obtained from a Millipore Milli-Q system (USA) and used in all of the experiments. All chemicals used were at least analytical reagent grade and used as received without further purification. AO7, sodium persulfate, ferric chloride, ferrous chloride, concentrated sulfuric acid (>98.0%), hydrochloric acid, hydrofluoric acid, nitric acid, perchloric acid, sodium hydroxide, sodium carbonate, sodium bicarbonate, sodium sulfate, sodium nitrate, sodium dihydrogen phosphate, sodium chloride, sodium bromide, methanol (MeOH) and tert butyl alcohol (TBA) were purchased from local Sinopharm Chemical Reagent Co. Ltd. For electron paramagnetic resonance (EPR) analysis, 5,5-dimethyl-1-pyrolene N-oxide (DMPO) (98%, Adamas Reagent Co. Ltd.) was used.2.2 Preparation and characterization of MSDBC
To prepare MSDBC, 200 g dried sludge was added into the aqueous solution (2400 mL) of FeCl2 (166.7 mM) and FeCl3 (333.3 mM), shaken for 30 min. Then, NaOH solution (5 M) was added dropwise into the mixture under vigorous mechanical shaking, until the pH of the suspension increased to 10.0. The shaking was then maintained for 30 min. The solid phase was separated by centrifugation at 3000 rpm, vacuum dried at 60 °C, and pyrolyzed at 400 °C for 2 hours in a tubal furnace, with a temperature increasing rate of 10 °C min−1 and 1 L min−1 N2 sweeping as inert shielding gas. The resulting biochar (labeled MSDBC, vide infra in Section 3.1) was ground and passed through a 200 mesh sieve (0.074 mm) without further activation. SDBC was prepared by pyrolyzing with aforementioned conditions without co-precipitation of iron salts.The ash content (weight ratio, wt%) was measured by combustion of SDBC/MSDBC at 760 °C for 6 hours in a muffle furnace and calculated by the residue weight ratio of the material.33 The elemental composition (C, H, N and S, wt%) of SDBC and MSDBC were detected by an elemental analyzer (Vario MICRO cube Elementar, German). The content of Fe in the bulk was measured by atomic absorption spectroscopy (AAS) analysis with AAnalyst300 Perkin Elmer, USA after a series of digestion procedures as follows. Firstly, 0.5 g MSDBC was added into 10 mL HNO3 solution (8 M) in a Politef beaker, heated at 50 °C for 30 min. Secondly, 5 mL HF solution (23 M) was added and the suspension was boiled for 10 min. Then, 7 mL HClO4 (12.4 M) was added and the suspension was boiled until it became nearly dried. Lastly, 25 mL HNO3 solution (0.2 M) was added and the suspension was boiled until the residue completely dissolved, followed by diluting with deionized water to 50 mL. The resultant clear liquid was used for AAS measurement and the iron content was calculated according to the dilution ratio.
The porosity of MSDBC was characterized by N2 adsorption–desorption curves collected by a JW-BK low temperature N2 adsorption instrument from JWGB Sci. & Tech, China at −196.15 °C. The specific surface area (SBET) was calculated by Brunauer–Emmett–Teller (BET) equation. Prior to the N2 adsorption–desorption measurement, MSDBC was firstly dried and degassed at 120 °C under vacuum for 24 hours. Fourier transform infrared (FTIR) spectroscopy analysis was conducted using the KBr pellet technique, and over a wavelength range from 400 to 4000 cm−1 under a 4 cm−1 resolution (Vertex 70 Bruker, German). X-ray photoelectron spectroscopy (XPS) analysis equipped with Al/Mg Kα X-ray source with 30 eV pass energy in 0.5 eV step over an area of 650 μm × 650 μm to the samples was carried out for O 1s (SDBC and MSDBC) and Fe 2p (fresh and used MSDBC) regions (AXIS-ULTRA DLD-600W Shimadzu/Kratos, Japan) at vacuum of 10−9 Torr, and the results were corrected by a reference of the C 1s peak from adventitious carbon at 284.8 eV and fitted with Shirley method of background subtraction on XPSpeak4.1 Software.34 Scanning electron microscope (SEM) was conducted (Sirion 200 FEI, Netherlands) combined with an electron dispersive X-ray (EDX) analyzer. X-ray diffraction (XRD) analysis was conducted (X'Pert PRO, Netherlands) with Cu Kα radiation (λ = 0.1542 nm) over a 2θ collection range of 5–90° with a scanning rate of 6° min−1. Magnetic property of the MSDBC was determined by magnetization curve using EM4-HVA ELECTROMAGNETIC magnetometer (Lake Shore, USA). The zeta potentials were measured at different pH (2.03–9.11) by Zetasizer Nano series (Nano-ZS90, Malvern, UK) at 25 °C. Firstly, 150 mg of MSDBC was added into a plastic conical flask containing 65 mL deionized water. Then, the flask was mechanical shaken for 24 hours. Lastly, the resultant suspension was collected for zeta potentials determination in 0.01 mM NaCl solution. The pH was adjusted with 0.01 mM NaOH and HCl. The point of zero charge (pHPZC) was calculated by the zeta potentials under different pHs (2.03–9.11).
2.3 AO7 removal experiments
20 mL samples (aqueous solution of 0.06 mM AO7) were added to 25 mL vials together with appropriate amounts of sodium persulfate and MSDBC. The vials were closed and shaken in a mechanical shaker for 100 min. Periodically one sample of 1 mL was taken out at a time interval of 20 min and analyzed AO7 concentration immediately. For the recycle tests, used MSDBC was collected by centrifugation, washed with deionized water and dried at 60 °C for 24 hours in a drying oven. Other reaction conditions remained the same for the subsequent runs. The initial pH was 5.22 without adjusting and all experiments were carried at 25 °C. All experiments were run in triplicate, and average values were reported.2.4 Identification of oxidative radicals
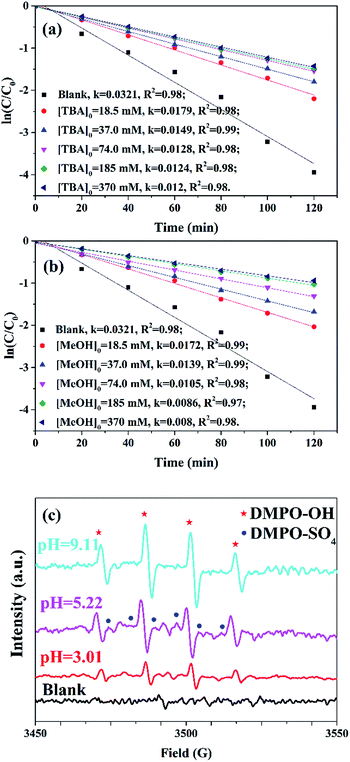
Oxidative radicals responsible for the degradation process were identified by quenching studies using two different scavengers, that is, MeOH and TBA. EPR studies coupled with DMPO as a spin-trapping agent were conducted to further identify the main reactive oxygen species. A solution containing 20 mM DMPO, 1.85 mM PS was prepared at pH value of 3.01, 5.22 and 9.11, and then MSDBC was added to initiate the reaction. After 5 min of reaction, samples were taken out and analyzed on a spectrometer at room temperature (JEOL FA200, Japan). EPR measurements were conducted using a radiation of 9.147 GHz (X band) with a modulation frequency of 100 kHz, modulation width of 0.1 mT, sweep width of 20 mT, center field of 326.0 mT, scan time of 60 s, time constant of 0.03 s, and microwave power of 5 mW. All experiments were carried out at 25 °C.2.5 Analytic methods
Quantitative analysis of AO7 was performed using a visible-light spectrophotometer (HACH DR 2500, USA) at the characteristic wavelength of 486 nm.11 The total iron leaching was detected by AAS analysis with AAnalyst300 Perkin Elmer, USA.3 Results and discussion
3.1 Characterization
The elemental content of SDBC and MSDBC was firstly investigated and listed in Table 1. Large amount of ashes, which were defined as the solid residuals after combustion experiments, could be found in both SDBC and MSDBC. Most of these ashes were proposed as metal oxides such as SiOx, Al2O3, iron oxide, etc. and inorganic salts of alkali metals or alkaline earth metals. The content of ashes in MSDBC (65.37%) further increased 20.23% comparing with that of SDBC (45.15%), which was mainly attributed to the introducing of magnetic iron component. Also, this difference was highly consistent with the AAS measurements, in which the content of iron was 21.96% in weight. On the other hand, nitrogen and sulfur was found rich in both SDBC and MSDBC, which was in agreement with the facts that sewage sludge was consist of organic compounds, macro- and micronutrients, trace elements, micro-organisms and micro pollutants.Fig. 1a represented the XRD patterns of MSDBC in which the presence of quartz (PDF: 46-1045) and calcite (PDF: 47-1743) could be found.35 Meanwhile, Fe3O4 (PDF: 65-3107)3 was also found as the main crystalline phase on the surface of MSDBC. The room-temperature magnetization hysteresis curve was measured via vibrating sample magnetometer (VSM) to exhibit the appropriateness of ferromagnetic materials. This was attained from plots of magnetization (M) against the magnetic field (Oe) as presented S-like curve in Fig. 1b. The saturation magnetization (Ms) of the MSDBC was calculated as 8.49 emu g−1, which was ample to be separated from aqueous solution by a permanent magnet.36 These results confirmed the magnetic properties of MSDBC. Fig. 1c showed the results of zeta potential measurement. The pHPZC was calculated to be 5.3.
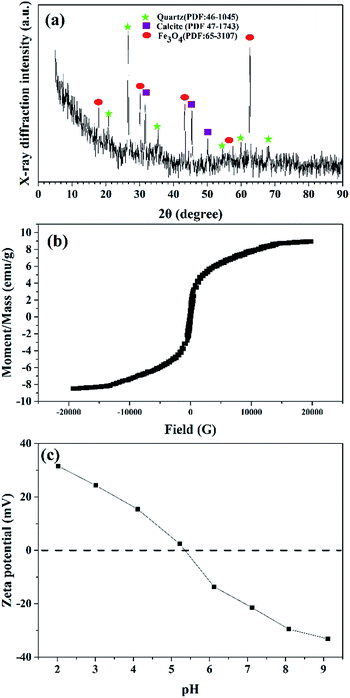 | ||
| Fig. 1 (a) XRD patterns of MSDBC, (b) magnetization curves measured at room temperature for MSDBC and (c) zeta potentials result of MSDBC. | ||
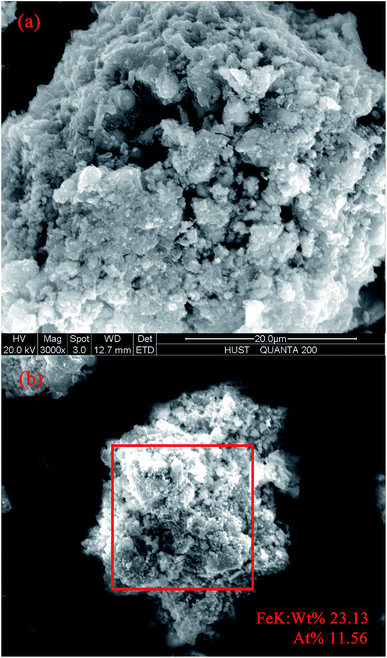
SEM image was shown in Fig. 2a. The results suggested that uniform Fe3O4 particles were distributed on the surface of the MSDBC with porous structure. SEM-EDX results (Fig. 2b) further confirmed the existence of Fe species, and the atom and weight ratio of iron on the surface of MSDBC was detected as 11.56% and 23.13% respectively. The AAS measurement result of digested iron (vide supra in Section 2.2) indicated iron weight ratio in MSDBC bulk was 219.63 mg g−1 (weight ratio of 21.96%), which was similar to the data of EDX measurement. The abovementioned result suggested iron components distributed nearly uniformly, not only on the surface but also in the interior of MSDBC. The uniform distribution of iron contents should be attributed to the one-step synthetic method by pyrolyzing sludge after co-precipitation.
The isotherm of MSDBC was depicted as Fig. 3a, which was of type IV shape and displayed the H2-type hysteresis loop.37 The pore size distribution curve was shown in the insert figure. Barrett–Joyner–Halenda (BJH) methods indicated the average pore size to be 8.217 nm, and SBET was calculated as 65.47 m2 g−1. The abovementioned results suggested a mesoporous surface38 of MSDBC with high SBET, which hinted the high adsorption capacity of MSDBC on AO7. FTIR spectra of SDBC and MSDBC were shown in Fig. 3b. Peaks at about 3427 cm−1 (–OH stretching),27 1627 cm−1 (C![[double bond, length as m-dash]](https://www.rsc.org/images/entities/char_e001.gif) O),28 1050 cm−1 (C–OH vibration of carboxylic),24 800 cm−1 (aromatic C–H)24 and 540 cm−1 (–C–Br–)39 were detected on both of fresh and used MSDBC and SDBC. Peak at 470 cm−1 was only detected on the spectra of fresh and used MSDBC, which should be assigned to Fe–O stretch of Fe3O4.39 The peak at 1264 cm−1 only appeared on the spectra of SDBC, was assigned to symmetric vibration of carboxylate –COO–.40 The broad band in the region from 1510 to 1670 cm−1 can both be assigned to C
O),28 1050 cm−1 (C–OH vibration of carboxylic),24 800 cm−1 (aromatic C–H)24 and 540 cm−1 (–C–Br–)39 were detected on both of fresh and used MSDBC and SDBC. Peak at 470 cm−1 was only detected on the spectra of fresh and used MSDBC, which should be assigned to Fe–O stretch of Fe3O4.39 The peak at 1264 cm−1 only appeared on the spectra of SDBC, was assigned to symmetric vibration of carboxylate –COO–.40 The broad band in the region from 1510 to 1670 cm−1 can both be assigned to C![[double bond, length as m-dash]](https://www.rsc.org/images/entities/char_e001.gif) O vibration, while this peak centered at 1645.3 cm−1 in SDBC and at 1626.3 cm−1 in fresh MSDBC. Also the intensity of this peak was stronger for fresh MSDBC under identical conditions. The abovementioned differences between the spectra of SDBC and MSDBC may raise from the chemical bond of Fe–O–C between the Fe species and carbon components on the surface of MSDBC,40 and the introducing of Fe3+ favored oxygen-containing functional groups generation, leading to the fact that most peaks in MSDBC was stronger than these of SDBC. Similar phenomena has also been reported in literatures.29,41,42 When Fe3+ was introduced, it would conjunct with biomass in small area and be carbonized as small nanosheet. The Fe3+ could be seen as the “separation agent” which would “cut” the biochar to many minces. Functional groups in sludge such as –OH, –COOH, –NH2 and –C
O vibration, while this peak centered at 1645.3 cm−1 in SDBC and at 1626.3 cm−1 in fresh MSDBC. Also the intensity of this peak was stronger for fresh MSDBC under identical conditions. The abovementioned differences between the spectra of SDBC and MSDBC may raise from the chemical bond of Fe–O–C between the Fe species and carbon components on the surface of MSDBC,40 and the introducing of Fe3+ favored oxygen-containing functional groups generation, leading to the fact that most peaks in MSDBC was stronger than these of SDBC. Similar phenomena has also been reported in literatures.29,41,42 When Fe3+ was introduced, it would conjunct with biomass in small area and be carbonized as small nanosheet. The Fe3+ could be seen as the “separation agent” which would “cut” the biochar to many minces. Functional groups in sludge such as –OH, –COOH, –NH2 and –C![[double bond, length as m-dash]](https://www.rsc.org/images/entities/char_e001.gif) O could be conjoined through condensation reactions.29
O could be conjoined through condensation reactions.29
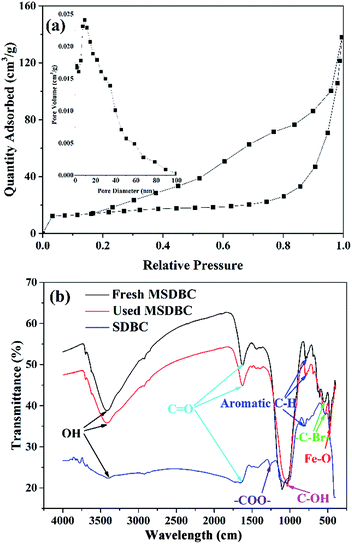 | ||
| Fig. 3 (a) Nitrogen adsorption–desorption isotherm of MSDBC, insert figure: the corresponding BJH adsorption pore size distribution curve and (b) FTIR spectra of fresh and used MSDBC and SDBC. | ||
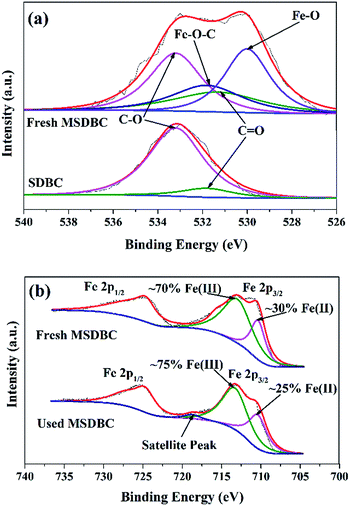
To confirm or disprove the existence of metal–O–C bonds, XPS spectra of O 1s in SDBC and MSDBC were shown in Fig. 4a. In the case of SDBC, two peaks centered at 533.2 and 531.2 eV should be attributed to the O 1s spectra in C–O and C![[double bond, length as m-dash]](https://www.rsc.org/images/entities/char_e001.gif) O groups, respectively.43 The peak of C
O groups, respectively.43 The peak of C![[double bond, length as m-dash]](https://www.rsc.org/images/entities/char_e001.gif) O was weaker than that of C–O from the view of intensity, indicating the existence of more abundant C–O groups on the surface of SDBC than C
O was weaker than that of C–O from the view of intensity, indicating the existence of more abundant C–O groups on the surface of SDBC than C![[double bond, length as m-dash]](https://www.rsc.org/images/entities/char_e001.gif) O groups, which was also proved by previous spectra of FTIR. Alternatively, O 1s spectra of MSDBC contained four peaks. Besides the two similar peaks as discussed above, another two distinguished peaks that centered at 531.8 and 529.8 eV should be found and attributed to Fe–O–C and Fe–O bonds, respectively.44 This result further confirmed the existence of Fe–O–C bond on the surface of MSDBC, indicating strong interfacial interactions between Fe3O4 and carbon components that benefitted the stability of MSDBC.
O groups, which was also proved by previous spectra of FTIR. Alternatively, O 1s spectra of MSDBC contained four peaks. Besides the two similar peaks as discussed above, another two distinguished peaks that centered at 531.8 and 529.8 eV should be found and attributed to Fe–O–C and Fe–O bonds, respectively.44 This result further confirmed the existence of Fe–O–C bond on the surface of MSDBC, indicating strong interfacial interactions between Fe3O4 and carbon components that benefitted the stability of MSDBC.
XPS spectra of the Fe 2p spectral region for fresh and used MSDBC further confirmed the existence of Fe3O4 (Fig. 4b). For instance, signals from Fe 2p1/2 at around 725 eV could be observed in XPS spectra in both fresh and used MSDBC. Two peaks from Fe 2p3/2 that centered at 710 eV and 713 eV are indicative of Fe(II) and Fe(III), respectively.45 The relative peak areas of the two peaks from Fe 2p3/2 indicated 30% and 25% of Fe(II) on the surface of fresh and used MSDBC respectively, indicated some of Fe(II) was oxidated into Fe(III) by persulfate during the reaction (vide infra in Section 3.2).3 The Fe(II)/Fe(III) ratio on the surface of fresh MSDBC was 3/7, less than not only the theoretical one of 1/2 but also the detected value of 0.35/0.65 in standard Fe3O4 sample.46 This phenomenon should be attributed to that SDBC itself always contains some iron impurities rather than Fe3O4.33 Fe 2p3/2 spectra for Fe3O4 has been previously reported without any satellite peak.46 The satellite peak of Fe 2p3/2 for fresh MSDBC was nearly negligible. However, after it was used for catalytic degradation (vide infra in Section 3.2), a satellite peak of Fe 2p3/2 centered at 718 eV was observed in used MSDBC. The transforming of Fe(II) to Fe(III) was responsible to this phenomenon. However, the Fe(II)/Fe(III) ratio was maintained as 0.25/0.75 and the satellite peak was very weak, indicated the high stability of MSDBC.
Above results indicated the successful preparation of MSDBC through feasible method, and MSDBC appeared a porous surface with abundant Fe3O4 and oxygen-containing functional groups. Both of these two components have been reported to activate PS successfully,2,45,47 implicating MSDBC as a good candidate for PS activation.
3.2 Removal of AO7
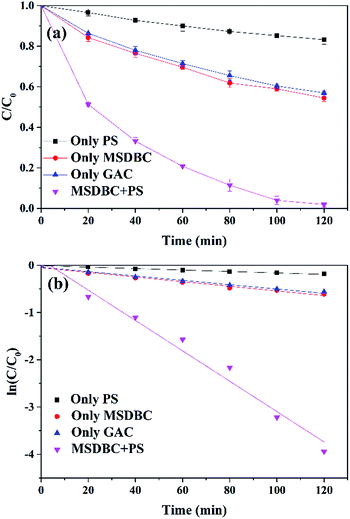
Initial assays were carried out to test AO7 removal by (1) 1.85 mM PS alone, (2) 1 g L−1 MSDBC alone, (3) 1 g L−1 GAC alone and (4) MSDBC/PS system (1 g L−1 and 1.85 mM respectively). Results showed (Fig. 5a) that PS alone was sluggish on AO7 removal (16.8%), consistent with the fact that PS oxidation required activator.3 Meanwhile, MSDBC itself showed certain removal efficiency (45.5%), which was due to the adsorption that raised from the porous structure and abundant oxygen-containing functional groups of MSDBC. It is worth to emphasize that, this adsorption capacity is even higher than that of GAC, which is widely used as commercial adsorbent, and costly more expensive than MSDBC.21 Under the same conditions, GAC alone only exhibited 43.0% removal. Drastic increase on AO7 removal (98.1%) was achieved when PS was introduced into the MSDBC adsorption group, suggested PS was successfully activated by MSDBC.To further confirm the successful activation of PS. The data of aforementioned four groups were fitted using pseudo-first-order kinetics and pseudo-second-order kinetics models respectively, and the fitting results were listed in Table 2. The high correlation coefficients (R12, >0.97 in all groups) suggested that AO7 removal in all groups could be well expressed by pseudo-first-order kinetics model (Table 2 and Fig. 5b). However, the fitting result of group “MSDBC/PS” by pseudo-second-order kinetics model was not satisfactory as the correlation coefficient (R22) was only 0.7117. In most PS based systems, pseudo-first-order kinetics model was reported to fit data well based on only one target contaminant concentration.10 Thus, data were fitted by pseudo-first-order kinetics model to test AO7 removal efficiency in our case and all correlation coefficients (R2) were shown in the figures.
| Group | Rate constant (k1) of pseudo-first-order kinetics model (min−1) | Correlation coefficients (R12) of pseudo-first-order kinetics model | Rate constant (k2) of pseudo-second-order kinetics model (mM−1 min−1) | Correlation coefficients (R22) of pseudo-second-order kinetics model |
|---|---|---|---|---|
| PS alone | 0.0015 | 0.9910 | 0.0283 | 0.9750 |
| MSDBC alone | 0.0049 | 0.9769 | 0.1133 | 0.9735 |
| GAC alone | 0.0046 | 0.9837 | 0.1050 | 0.9774 |
| MSDBC/PS | 0.0321 | 0.9801 | 6.0533 | 0.7117 |
Rate constant (k) of “MSDBC/PS” group (0.0321 min−1) was 21.4 and 6.6 times of that of “only PS” (0.0015 min−1) and “only MSDBC” (0.0049 min−1) groups respectively, which further confirmed the successfully activation of PS by MSDBC. Additionally, the adsorption ability of MSDBC also contributed to this remarkable performance of oxidative degradation because concentrate pollutants onto the surface may promote radical oxidation processes in the presence of high instantaneous concentration of reactants. Similarly, Fe(II)–GAC/PS was reported to remove COD more efficiently from landfill leachate than Fe2+/PS and GAC/PS systems, and the higher efficiency was considered to be attributed to the combination of adsorption by GAC and catalysis of Fe(II).48 RuO2–AC/peroxymonosulfate (PMS) system was reported to exhibit higher efficiency on phenol removal than RuO2–zeolite/PMS system because of that higher adsorption capacity of AC promoted surface reaction between phenol and oxidative radicals.22
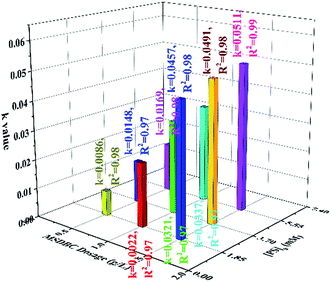
The rate constants of AO7 removal by different dosages of MSDBC (0.5, 1.0 and 1.5 g L−1) and PS (1.85, 3.70 and 5.55 mM) were shown in Fig. 6. Kinetics rate constant increased sharply with the increase of PS dosage from 1.85 mM to 3.70 mM, and the increase was not that obvious when PS dosage further raised to 5.55 mM as rate constant increased from 0.0148, 0.0321 and 0.0491 min−1 with 0.5, 1.0 and 1.5 g L−1 of MSDBC, to 0.0169, 0.0337 and 0.0511 min−1, respectively. This phenomenon should be attributed to scavenge of SO4˙− by superfluous PS introduced into the system when PS concentration is too high.2 However, in the three groups of different fixed PS dosages, increase of MSDBC dosages induced drastic increase of AO7 removal efficiency in the whole range of MSDBC dosage from 0.5 g L−1 to 1.5 g L−1. On one hand, larger MSDBC dosage induced larger adsorption capacity and increased number of reaction sites for persulfate activation. On the other hand, larger adsorption capacity favored surface radicals reaction mentioned above. In conclusion, effects of MSDBC dosage were more obvious than that of PS concentration.
3.3 Identification of oxidative radicals
Radical scavenger experiments and EPR studies were carried out to identify oxidative radicals in MSDBC/PS system. Sulfate radicals and hydroxyl radicals were reported as the main oxidative radicals in most system employed PS as oxidant.3,4,45 Two radical scavengers (MeOH and TBA) were employed in the scavenger experiments under pH 5.22. TBA is well known as efficient OH˙ scavenger but not sensitive with SO4˙− because of high reaction rate constants with OH˙ (3.8–7.6 × 10⁸ M−1 s−1) and lower ones with SO4˙− (4.0–9.1 × 10⁵ M−1 s−1).4 Fig. 7a showed quenching results of TBA. Kinetics rate constant of AO7 removal decreased from 0.0321 to 0.0179 min−1 when 18.5 mM TBA was introduced. Further decrease of rate constant from 0.0179 to 0.012 min−1 was observed when TBA concentration increased from 18.5 mM to 370.0 mM, suggesting that OH˙ contributed to AO7 removal. Owing to the high reaction rate constants with both of SO4˙− (1.2–2.8 × 10⁹ M−1 s−1) and OH˙ (1.6–7.7 × 10⁷ M−1 s−1),4 MeOH was employed to quench both of SO4˙− and OH˙ (Fig. 7b). Rate constant of AO7 removal decreased from 0.0321 to 0.0172 min−1 when 18.5 mM MeOH was introduced into the reaction. Further decrease of rate constant from 0.0172 to 0.008 min−1 was found when MeOH concentration increased from 18.5 mM to 370.0 mM. With the same amounts of scavengers, rate constants of MeOH groups were always lower than the case of TBA, suggesting SO4˙− was also oxidative radicals in MSDBC/PS system. EPR tests with DMPO as spin-trapping agent further confirmed the existence of SO4˙− and OH˙ (Fig. 7c). Both of DMPO-SO4 and DMPO-OH signals were observed under three different pH values of 3.01, 5.22 and 9.11 (DMPO-SO4: aN = 12.3 G, aH = 9.6 G, aH = 1.48 G, aH = 0.78 G; DMPO-OH: aN = aN = 14.9 G, g = 2.0067, quartet adduct peaks with characteristic intensities of 1![[thin space (1/6-em)]](https://www.rsc.org/images/entities/char_2009.gif) :
:![[thin space (1/6-em)]](https://www.rsc.org/images/entities/char_2009.gif) 2
2![[thin space (1/6-em)]](https://www.rsc.org/images/entities/char_2009.gif) :
:![[thin space (1/6-em)]](https://www.rsc.org/images/entities/char_2009.gif) 2
2![[thin space (1/6-em)]](https://www.rsc.org/images/entities/char_2009.gif) :
:![[thin space (1/6-em)]](https://www.rsc.org/images/entities/char_2009.gif) 1).49 In addition, stronger DMPO-OH signal was observed under pH 9.11 than these of pH 5.22 and 3.01, indicating that OH˙ made more contribution under alkaline condition. This phenomenon is attributed to transforming of SO4˙− into OH˙ under alkaline condition.47
1).49 In addition, stronger DMPO-OH signal was observed under pH 9.11 than these of pH 5.22 and 3.01, indicating that OH˙ made more contribution under alkaline condition. This phenomenon is attributed to transforming of SO4˙− into OH˙ under alkaline condition.47
3.4 Stability and reuse of MSDBC
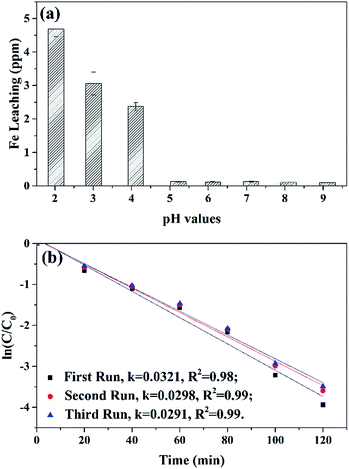
Iron leaching from MSDBC was tested under different pHs (Fig. 8a). Negligible iron leaching was found under pH values from 5.22 to 9.11 during the oxidative process. This phenomenon demonstrated heterogeneous MSDBC with a good stability for practical applications in real wastewater treatment. Only under extreme acidic condition of pH 2.03 and 3.01, very small amount of iron leaching was detected to be 4.69 and 3.06 ppm. In the case of pH 2.03, 4.69 ppm leaching was still limited because it equaled to 4.69 × 10⁻³ g iron leached from 1 g MSDBC under this strong acidic condition. However, weight ratio of iron in MSDBC bulk was detected as 219.63 mg g−1, representing that only 2.14% weight ratio of iron oxide was dissolved into aqueous solution.Reuse performance represents one of the most important properties of heterogeneous catalysts.50 In our case MSDBC was reused for three times for the oxidative degradation of AO7 (Fig. 8b), in which the plot of rate constant almost overlapped with each other, suggesting the good reuse performance of MSDBC. This reuse performance originated from its simple preparation method of pyrolysis, was also consistent with the unchanged FTIR and XPS spectra before and after oxidative degradation in Characterization section, and was in highly agreement with its aforementioned negligible leaching during the process.
3.5 Effects of pH and common inorganic anions on AO7 removal
The presence of inorganic anions such as HCO3−, CO32−, H2PO4−, SO42−, NO3−, Br− and Cl− etc. can react with free radicals through electron exchange and thus influence the efficiency of AOPs. This efficiency was also strongly influence by the pH of wastewater. Thus it is important to evaluate the oxidative potential of MSDBC/PS system under different pHs and common anions which exist abundantly in industrial and sewage water.Influences of initial pH values (2.03–9.11) on AO7 removal were shown in Fig. 9. Acidic condition favored AO7 removal. Rate constant increased from 0.007 to 0.0517 min−1 when pH decreased from 9.11 to 2.03. These results were in agreement with some previous works.45,47,51 This phenomenon may be attributed to two facts. On one hand, as pHPZC of MSDBC was measured to be 5.3, MSDBC will be positively charged under acidic conditions. Meanwhile, AO7 molecules have two pKa values of 1 for the –SO3H group and 11 for the naphthalene, respectively. AO7 will exist as negatively charged monoprotonated form in the aqueous solution for pH values between 2.03 and 9.11.51 Thus, lower pH (pH < 5.3) will favor AO7 adsorption by MSDBC because of electrostatic attraction between the anionic dye molecules and MSDBC surface. On the other hand, Leng et al. suggested that rapid decay of SO4˙− resulting from the reactions with hydroxyl ions also contributed to the decrease of organic pollutants removal efficiency.47
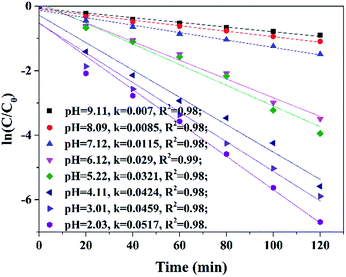 | ||
| Fig. 9 Pseudo-first-order kinetic curves for AO7 removal under different initial pH values. Reaction conditions: MSDBC dosage = 1.0 g L−1, [PS]0 = 1.85 mM and [AO7]0 = 0.06 mM. | ||
Effects of common anions (HCO3−, CO32−, H2PO4−, SO42−, NO3−, Br− and Cl−, initial concentration of 1.85 mM) were shown in Fig. 10a. NO3− slightly inhibited AO7 removal as rate constant decreased from 0.0321 to 0.0280 min−1 when 1.85 mM NO3− was introduced into the reaction. This phenomenon was attributed to the fact that nitrate radicals (NO3˙, E0 = 2–2.2 V) was produced by reactions between NO3− and oxidative radicals (SO4˙−/OH˙) of less reactivity by eqn (3) and (4).52 HCO3−, CO32− and HPO42− also inhibited the reaction by similar pathways, in which less reactive radicals (HCO3˙, CO3˙−, H2PO4˙ by eqn (5)–(10))7,52 were generated by the reaction of SO4˙−/OH˙ with anions. Alternatively, HCO3− has been reported to favor phenol removal by CuO–Fe3O4/PS system because of its pH buffering stability (by eqn (11) and (12)) to fix pH constant at 8.0 ± 0.5.3 However, in our case, when HCO3− was introduced in our case, MSDBC was negatively charged due to the weak alkaline pH and its adsorption capacity on anionic AO7 decreased, therefore inhibited AO7 removal. 1.85 mM SO42− was also found to inhibit AO7 removal. This phenomenon should be attributed to decrease of oxidative reduction potential of SO4˙−/SO42− under high SO4˙− concentration, leading to less efficient activation of PS.52
| NO3− + SO4˙− → NO3˙ + SO42−, k = 5.5 × 10⁵ M−1 s−1 | (3) |
| NO3− + OH˙ → NO3˙ + OH−, k < 5.0 × 10⁵ M−1 s−1 | (4) |
| HCO3− + SO4˙− → HCO3˙ + SO42−, k = 9.1 × 10⁶ M−1 s−1 | (5) |
| HCO3− + OH˙ → HCO3˙ + OH−, k = 8.5 × 10⁸ M−1 s−1 | (6) |
| CO32− + SO4˙− → CO3˙− + SO42−, k = 6.1 × 10⁶ M−1 s−1 | (7) |
| CO32− + OH˙ → CO3˙− + OH−, k = 3.9 × 10⁸ M−1 s−1 | (8) |
| H2PO4− + SO4˙− → H2PO4˙ + SO42−, k < 7.0 × 10⁴ M−1 s−1 | (9) |
| H2PO4− + OH˙ → H2PO4˙ + OH−, k = (1.0–2.0) × 104 M−1 s−1 | (10) |
| H2CO3(aq) → H+ + HCO3−, pKa = 6.37 | (11) |
| HCO3− → H+ + CO32−, pKa = 10.33 | (12) |
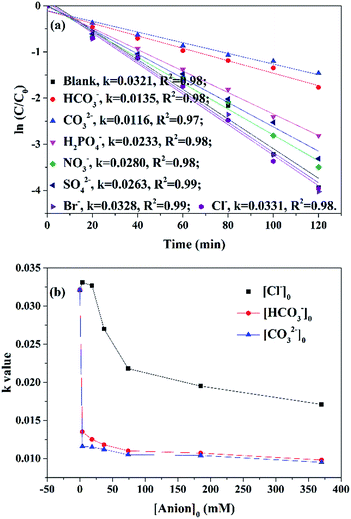 | ||
| Fig. 10 (a) Effects of common anions on AO7 removal. Reaction conditions: [anions]0 = 1.85 mM. (b) Effects of anions concentration on AO7 removal. Reaction conditions: [anions]0 = 1.85–370 mM. | ||
Distinguished from above anions, 1.85 mM of Cl− and Br− enhanced efficiency of oxidative degradation. Rate constants of AO7 degradation increased from 0.0321 to 0.0331 and 0.0328 min−1 with the addition of Cl− and Br− respectively. Halide irons may also react with sulfate and hydroxyl radicals through different processes.53 For instance, Cl˙ (eqn (13)) and Cl2˙− (eqn (14)) may be generated through the quench of sulfate radicals by Cl−.53 However, the quenching reaction (eqn (13)) was reported reversible and the rate constants of forward (2.7–3.4 × 10⁸ M−1 s−1) and reverse pathway (2.0–2.5 × 10⁸ M−1 s−1) are similar.52,53 Under low Cl− concentration, certain amount of SO4˙− was quenched, which may help to avoid SO4˙− quenching by superfluous SO4˙− and accelerate PS decomposition.54 Meanwhile, reverse pathway (eqn (13)) which will undergo under low level of Cl− and SO4˙−, will regenerate SO4˙− and maintain oxidation efficiency.53
| Cl− + SO4˙− ↔ Cl˙ + SO42− | (13) |
| Cl− + Cl˙ ↔ Cl2˙− | (14) |
As HCO3− and CO32− showed highest inhibition levels and Cl− showed highest promotion level on AO7 removal respectively, different concentrations of these three anions were introduced into MSDBC/PS system to further study the effects of anions on AO7 removal (Fig. 10b). Rate constants decreased from 0.0135 and 0.0116 min−1 to 0.0098 and 0.0095 min−1 when concentration of HCO3− and CO32− increased from 1.85 to 370.0 mM respectively. As the rate constant was calculated as 0.0049 min−1 on AO7 adsorption by MSDBC, the aforementioned results suggested that oxidation of AO7 happened even 370.0 mM of HCO3− and CO32− was introduced. This may be attributed incomplete quenching of oxidative radicals and/or oxidation of AO7 by HCO3˙ and CO3˙−. Interestingly, further increase of Cl− induced decrease of rate constant of AO7 removal (0.0171 min−1 when Cl− concentration was 370.0 mM). This is attributed to that high Cl− level favored forward pathway of reaction between Cl− and SO4˙− (eqn (13)), and Cl− acted as radical quencher. Above data disclosed that most anions inhibited AO7 removal, the order of inhibition levels is CO32− > HCO3− > H2PO4− > SO42− > NO3−. Two halide irons, Cl− and Br−, at low concentration of 1.85 mM, showed slightly promotion effects on AO7 removal. However, high concentration of halide irons inhibited AO7 removal.
4 Conclusion
In this effort, municipal sewage sludge was chosen as the feedstock of biochar, based on which Fe3O4 particles were successfully loaded by one-step co-precipitation method. Magnetic sludge-derived biochar was therefore prepared, and this material reveals porous structure with remarkable adsorption capacity and magnetic separation ability. Fe3O4 component and oxygen-containing functional groups on its surface contributed to the generation of high level of oxidative radicals from PS, while and the enrichment of pollutant on the surface was realized. Thus, excellent performance for the treatment of AO7 was achieved via both adsorption and catalytic degradation. MSDBC also exhibited satisfactory stability, remained highly efficient in reuse experiments because little iron leaching can be detected in a broad pH window. Different from other heterogeneous catalysts, lower pH value favored AO7 removal by MSDBC/PS system because the pHPZC of MSDBC was evaluated to be 5.3. Furthermore, two halide irons, Cl− and Br− can promote AO7 removal under low concentrations. These unique behaviors of MSDBC/PS system may be reflected to have superior potential of full-scale application for wastewater treatment. Furthermore, this approach may also be considered as feasible waste resource utilization that converts the solid waste of sewage sludge into stable, cheap and multifunctional bio-resource.Acknowledgements
This project was funded by National Science Foundation of China [grant number 21671072], Shenzhen Science and Technology Development Funds (No. JCYJ20160429182628979), and Chutian Scholar Foundation from Hubei province, China. The authors also thank the Analytical and Testing Center of Huazhong University of Science and Technology for help in SEM-EDX, FTIR, XRD and XPS analysis.References
- C. G. Niu, Y. Wang, X. G. Zhang, G. M. Zeng, D. W. Huang, M. Ruan and X. W. Li, Bioresour. Technol., 2012, 126, 101–106 CrossRef CAS PubMed.
- J. Yan, L. Han, W. Gao, S. Xue and M. Chen, Bioresour. Technol., 2015, 175, 269–274 CrossRef CAS PubMed.
- Y. Lei, C. S. Chen, Y. J. Tu, Y. H. Huang and H. Zhang, Environ. Sci. Technol., 2015, 49, 6838–6845 CrossRef CAS PubMed.
- C. Sun, R. Zhou, E. Jianan, J. Sun and H. Ren, RSC Adv., 2015, 5, 57058–57066 RSC.
- Y. H. Guan, J. Ma, X. C. Li, J. Y. Fang and L. W. Chen, Environ. Sci. Technol., 2011, 45, 9308–9314 CrossRef CAS PubMed.
- H. Hori, M. Murayama, N. Inoue, K. Ishida and S. Kutsuna, Catal. Today, 2010, 151, 131–136 CrossRef CAS.
- J. Chen, N. Gao, X. Lu, M. Xia, Z. Gu, C. Jiang and Q. Wang, RSC Adv., 2016, 6, 100056–100062 RSC.
- Y. C. Chou, S. L. Lo, J. Kuo and C. J. Yeh, J. Hazard. Mater., 2015, 284, 83–91 CrossRef CAS PubMed.
- K. F. Chen, Y. C. Chang and K. Y. Liu, RSC Adv., 2016, 6, 75578–75587 RSC.
- L. W. Matzek and K. E. Carter, Chemosphere, 2016, 151, 178–188 CrossRef CAS PubMed.
- H. Li, J. Wan, Y. Ma, Y. Wang and M. Huang, Chem. Eng. J., 2014, 237, 487–496 CrossRef CAS.
- P. Avetta, A. Pensato, M. Minella, M. Malandrino, V. Maurino, C. Minero, K. Hanna and D. Vione, Environ. Sci. Technol., 2015, 49, 1043–1050 CrossRef CAS PubMed.
- Y. F. Rao, L. Qu, H. Yang and W. Chu, J. Hazard. Mater., 2014, 268, 23–32 CrossRef CAS PubMed.
- J. Yan, M. Lei, L. Zhu, M. N. Anjum, J. Zou and H. Tang, J. Hazard. Mater., 2011, 186, 1398–1404 CrossRef CAS PubMed.
- G. Ayoub and A. Ghauch, Chem. Eng. J., 2014, 256, 280–292 CrossRef CAS.
- X. Ruan, X. Gu, S. Lu, Z. Qiu and Q. Sui, Environ. Technol., 2015, 36, 1389–1397 CrossRef CAS PubMed.
- J. Yan, W. Gao, M. Dong, L. Han, L. Qian, C. P. Nathanail and M. Chen, Chem. Eng. J., 2016, 295, 309–316 CrossRef CAS.
- M. Feng, R. Qu, X. Zhang, P. Sun, Y. Sui, L. Wang and Z. Wang, Water Res., 2015, 85, 1–10 CrossRef CAS PubMed.
- K. W. Jung, B. H. Choi, T. U. Jeong and K. H. Ahn, Bioresour. Technol., 2016, 220, 672–676 CrossRef CAS PubMed.
- P. Sun, C. Hui, R. A. Khan, J. Du, Q. Zhang and Y. H. Zhao, Sci. Rep., 2015, 5, 12638 CrossRef CAS PubMed.
- A. Zielinska and P. Oleszczuk, Bioresour. Technol., 2015, 192, 618–626 CrossRef CAS PubMed.
- S. Muhammad, P. R. Shukla, M. O. Tade and S. Wang, J. Hazard. Mater., 2012, 215, 183–190 CrossRef PubMed.
- T. Zeng, X. Zhang, S. Wang, H. Niu and Y. Cai, Environ. Sci. Technol., 2015, 49, 2350–2357 CrossRef CAS PubMed.
- T. Chen, Z. Zhou, S. Xu, H. Wang and W. Lu, Bioresour. Technol., 2015, 190, 388–394 CrossRef CAS PubMed.
- W. Zhang, S. Mao, H. Chen, L. Huang and R. Qiu, Bioresour. Technol., 2013, 147, 545–552 CrossRef CAS PubMed.
- T. Chen, Z. Y. Zhou, R. Han, R. H. Meng, H. T. Wang and W. J. Lu, Chemosphere, 2015, 134, 286–293 CrossRef CAS PubMed.
- H. Lu, W. Zhang, Y. Yang, X. Huang, S. Wang and R. Qiu, Water Res., 2012, 46, 854–862 CrossRef CAS PubMed.
- J. Zhang and Q. Wang, J. Cleaner Prod., 2016, 112, 3927–3934 CrossRef CAS.
- L. Peng, Y. Ren, J. Gu, P. Qin, Q. Zeng, J. Shao, M. Lei and L. Chai, Environ. Sci. Pollut. Res., 2014, 21, 7631–7640 CrossRef CAS PubMed.
- W. Zhang, J. Zheng, P. Zheng and R. Qiu, Chemosphere, 2015, 134, 438–445 CrossRef CAS PubMed.
- X. Zhang, M. Hua, L. Lv and B. Pan, Sci. Rep., 2015, 5, 8253 CrossRef CAS PubMed.
- H. Li, J. Wan, Y. Ma, Y. Wang and Z. Guan, RSC Adv., 2015, 5, 99935–99943 RSC.
- A. Zielinska, P. Oleszczuk, B. Charmas, J. Skubiszewska-Zieba and S. Pasieczna-Patkowska, J. Anal. Appl. Pyrolysis, 2015, 112, 201–213 CrossRef CAS.
- H. Li, J. Wan, Y. Ma, M. Huang, Y. Wang and Y. Chen, Chem. Eng. J., 2014, 250, 137–147 CrossRef CAS.
- H. Wu, X. Che, Z. Ding, X. Hu, A. E. Creamer, H. Chen and B. Gao, Environ. Sci. Pollut. Res., 2016, 23, 1905–1915 CrossRef CAS PubMed.
- D. Mohan, P. Singh, A. Sarswat, P. H. Steele and C. U. Pittman Jr, J. Colloid Interface Sci., 2015, 448, 238–250 CrossRef CAS PubMed.
- P. Shen, H. T. Zhang, H. Liu, J. Y. Xin, L. F. Fei, X. G. Luo, R. Z. Ma and S. J. Zhang, J. Mater. Chem. A, 2015, 3, 3456–3464 CAS.
- L. J. Leng, X. Z. Yuan, H. J. Huang, H. Wang, Z. B. Wu, L. H. Fu, X. Peng, X. H. Chen and G. M. Zeng, Fuel Process. Technol., 2015, 129, 8–14 CrossRef CAS.
- P. Devi and A. K. Saroha, Chem. Eng. J., 2015, 271, 195–203 CrossRef CAS.
- L. Qin, Z. Li, Z. Xu, X. Guo and G. Zhang, Appl. Catal., B, 2015, 179, 500–508 CrossRef CAS.
- J. Yang, Y. Zhao, S. Ma, B. Zhu, J. Zhang and C. Zheng, Environ. Sci. Technol., 2016, 50, 12040–12047 CrossRef CAS PubMed.
- X. Hu, Z. Ding, A. R. Zimmerman, S. Wang and B. Gao, Water Res., 2015, 68, 206–216 CrossRef CAS PubMed.
- F. Xiao, W. Li, L. Fang and D. Wang, J. Hazard. Mater., 2016, 308, 11–20 CrossRef CAS PubMed.
- J. Zhou, H. Song, L. Ma and X. Chen, RSC Adv., 2011, 1, 782–791 RSC.
- C. Sun, R. Zhou, E. Jianan, J. Sun, Y. Su and H. Ren, RSC Adv., 2016, 6, 10633–10640 RSC.
- T. Yamashita and P. Hayes, Appl. Surf. Sci., 2009, 255, 8194 CrossRef CAS.
- Y. Leng, W. Guo, X. Shi, Y. Li and L. Xing, Ind. Eng. Chem. Res., 2013, 52, 13607–13612 CrossRef CAS.
- Z. Li, Q. Yang, Y. Zhong, X. Li, L. Zhou, X. Li and G. Zeng, RSC Adv., 2016, 6, 987–994 RSC.
- S. H. Yuan, P. Liao and A. N. Alshawabkeh, Environ. Sci. Technol., 2014, 48, 656–663 CrossRef CAS PubMed.
- K. Y. A. Lin, H. A. Chang and C. J. Hsu, RSC Adv., 2015, 5, 32520–32530 RSC.
- M. Stoyanova, I. Slavova, S. Christoskova and V. Ivanova, Appl. Catal., A, 2014, 476, 121–132 CrossRef CAS.
- T. Zhou, X. Zou, J. Mao and X. Wu, Appl. Catal., B, 2016, 185, 31–41 CrossRef CAS.
- S. Naim and A. Ghauch, Chem. Eng. J., 2016, 288, 276–288 CrossRef CAS.
- M. Nie, Y. Yang, Z. Zhang, C. Yan, X. Wang, H. Li and W. Dong, Chem. Eng. J., 2014, 246, 373–382 CrossRef CAS.
| This journal is © The Royal Society of Chemistry 2017 |

