 Open Access Article
Greatly enhanced dielectric permittivity in La1.7Sr0.3NiO4/poly(vinylidene fluoride) nanocomposites that retained a low loss tangent
Keerati Meeporna,
Prasit Thongbai *b,
Teerapon Yamwongc and
Santi Maensirid
aMaterials Science and Nanotechnology Program, Faculty of Science, Khon Kaen University, Khon Kaen 40002, Thailand
bIntegrated Nanotechnology Research Center (INRC), Department of Physics, Faculty of Science, Khon Kaen University, Khon Kaen 40002, Thailand. E-mail: pthongbai@kku.ac.th; Fax: +66 43 202374; Tel: +66 84 4190266
cNational Metal and Materials Technology Center, 114 Thailand Science Park, Paholyothin Rd. Klong 1, Klong Luang, Pathunthani 12120, Thailand
dSchool of Physics, Institute of Science, Suranaree University of Technology, Nakhon Ratchasima 30000, Thailand
First published on 20th March 2017
Abstract
The effect of La1.7Sr0.3NiO4 nanoparticles (LSNO-NPs) on the dielectric properties of LSNO-NPs/polyvinylidene fluoride (LSNO-NPs/PVDF) composites is presented. LSNO-NPs/PVDF composites fabricated via a liquid-phase assisted dispersion and hot-pressing methods showed a homogeneous dispersion of LSNO-NPs in a PVDF polymer matrix. The dielectric permittivity (ε′) continuously increased with increasing volume fraction of LSNO-NPs from fLSNO = 0–0.20, following the effective medium theory and Lichtenecker's logarithmic models. This result was intrinsically caused by a very large ε′ ≈ 105 of LSNO-NPs ceramic particles. At fLSNO = 0.25, ε′ deviated from the conventional mixed models, indicating a dominant extrinsic effect. A rapid change in ε′ of LSNO-NPs/PVDF composites was observed when fLSNO > 0.3. A largely enhanced dielectric response with ε′ ≈ 3285 at 1 kHz was obtained at fLSNO = 0.35, while the loss tangent was still low (≈0.83). This extremely enhanced ε′ value is attributed to the large interfacial areas and very short interparticle distances between LSNO-NPs (≈20–30 nm) separated by a thin layer of PVDF, forming highly effective microcapacitors. The overall ε′ values are well described by the combination model of effective medium percolation theory.
1. Introduction
Nowadays, dielectric polymer materials have been intensively investigated due to their unique advantages, such as process compatibility, light weight, flexibility and high breakdown strength.1 However, ε′ of these polymers is still very low (ε′ < 10) compared to those of ceramic oxides (ε′ ≈ 103–105). Thus, incorporating various types of materials (i.e., insulating dielectric oxides or conducting materials) into a polymer to enhance the ε′ value was widely investigated. Generally, the dielectric properties of a polymer composite are determined by the polymer matrix used and its filler. The most widely used polymers are poly(vinylidene fluoride) (PVDF) and its copolymers.2–9 This is because PVDF has been found to be a superior dielectric material for capacitor applications due to its relatively high ε′ values (≈10), high energy density, high electric breakdown field, low–dielectric loss tangent (tan![[thin space (1/6-em)]](https://www.rsc.org/images/entities/char_2009.gif) δ), low cost and high reliability.1,10
δ), low cost and high reliability.1,10
One of the most common and promising strategies to increase the ε′ value of PVDF is to incorporate ceramic oxide particles that exhibit a large ε′ > 103.2–4,11–16 This capitalizes upon the idea that a combination of a very large ε′ value of inorganic ceramic particles coupled with excellent flexibility and good dielectric strength of polymers1,11,12 can be used to produce suitable polymeric dielectric materials. From the point of view of capacitor applications, although significant efforts have been made to increase the ε′ of ferroelectric-ceramic/polymer composites, their ε′ values are difficult to significantly enhance to more than 100 even though the filler contents as high as 50 vol% (or ffiller = 0.5) were used.3,17,18 Furthermore, ferroelectric ceramics usually exhibit an electromechanical effect (i.e., a piezoelectric effect). This can cause a mechanical resonance in the device during charging and discharging, resulting in a reliability limit of the device.11
Non-ferroelectric ceramics that can exhibit very high ε′ values of ≈104–105, such as CaCu3Ti4O12 and isostructural CaCu3Ti4O12-oxides (e.g., Na0.5Bi0.5Cu3Ti4O12 and Na1/3Ca1/3Bi1/3Cu3Ti4O12),12,13,15,19 (Li + Ti) co-doped NiO (LTNO) particles,2 and Ba(Fe0.5Nb0.5)O3 (ref. 4) are considered promising fillers for greatly enhancing the ε′ value of PVDF polymers. Non-ferroelectric ceramic/polymer composite systems have been intensively developed to overcome the limitation of ferroelectric-ceramic/polymer composites. Accordingly, a number of excellent research studies have been done. At the same volume fraction, the ε′ value these composite systems was larger than that of ferroelectric-ceramic/polymer composites. However, the ε′ values of these non-ferroelectric ceramic/PVDF composites were difficult to enhance to values larger than 100 (at 103 Hz), even when a large volume fraction of filler was used (ffiller ≥ 0.5).4,12–14,20 Although a large value of ε′ ≈ 600 at (100 Hz) could be obtained in LTNO/PVDF composite with fLTNO = 0.4, tan![[thin space (1/6-em)]](https://www.rsc.org/images/entities/char_2009.gif) δ of this composite was also large (tan
δ of this composite was also large (tan![[thin space (1/6-em)]](https://www.rsc.org/images/entities/char_2009.gif) δ > 1.0 at 2 kHz).2
δ > 1.0 at 2 kHz).2
It has been generally observed that the low ε′ values (<102) of these ceramic/PVDF composites are much lower than those of sintered bulk ceramics (ε′ ≈ 104–105) by 2–3 orders of magnitude. This may have occurred since the very high ε′ values of many giant dielectric oxides originated from the extrinsic effect, i.e., strong interfacial polarization at the grain boundaries. When calcined a ceramic powder or a powder that was obtained by grinding a sintered ceramic was incorporated into polymer matrix, there were no grain boundary layers. Only interfacial polarization at the interface between ceramic particles and polymer occurred, while the dielectric response contributed by intrinsic polarizations inside ceramic particles (usually, ε′ ≈ 102 for CCTO21) and polymer matrix (usually, ε′ ≈ 10 for PVDF) were very low.
Most recently, incorporation of FeTiNbO6 ceramic particles into PVDF was used successfully increase the ε′ value of a composite with f = 0.4 to ≈181 (at 100 Hz).22 This was due to a very high ε′ of ≈4 × 10³ of a FeTiNbO6 ceramic, in which its high ε′ originated from the intrinsic effect inside the grains (or particles). This opened a new way for using giant dielectric material as a filler to enhance ε′ of a polymer matrix. A dielectric ceramic, where the origin of the giant ε′ was caused by an intrinsic effect, is more suitable than that of a giant dielectric ceramic whose high ε′ value originated from an extrinsic mechanism at the grain boundaries. Among several giant dielectric materials that were reported in recent years, La2−xSrxNiO4 has become one of the most interesting dielectric ceramics due to its extremely large ε′ ≈ 105−106. It can also exhibit a very high ε′ ≈ 104 even when the frequency is increased into the GHz region.23 The origin of the giant dielectric response in La2−xSrxNiO4 ceramics was intrinsically caused by the adiabatic small polaronic hopping process of Ni2+ and Ni3+.24–27 Therefore, La2−xSrxNiO4 is an important candidate for making high ε′ flexible polymeric composites for various applications. Unfortunately, to our best knowledge, this high-permittivity La2−xSrxNiO4 ceramic has rarely been incorporated into a PVDF polymer to enhance its ε′ value.28
The aim of this work was to enhance the dielectric response in a PVDF polymer by incorporating La1.7Sr0.3NiO4 nanoparticles (LSNO-NPs). A novel high-performance polymeric nanocomposite system of LSNO-NPs/PVDF composites was fabricated. It was found that ε′ of LSNO-NPs/PVDF composites can be greatly enhanced while retaining a low tan![[thin space (1/6-em)]](https://www.rsc.org/images/entities/char_2009.gif) δ value. At fLSNO = 0.35, the composite showed a very large ε′ ≈ 3595 with low tan
δ value. At fLSNO = 0.35, the composite showed a very large ε′ ≈ 3595 with low tan![[thin space (1/6-em)]](https://www.rsc.org/images/entities/char_2009.gif) δ < 1.0. The mechanisms of improvement of the dielectric properties of LSNO-NPs/PVDF composites are discussed in detail.
δ < 1.0. The mechanisms of improvement of the dielectric properties of LSNO-NPs/PVDF composites are discussed in detail.
2. Experimental details
2.1 Preparation of La1.7Sr0.3NiO4 nanoparticles
La1.7Sr0.3NiO4 nanocrystalline powders were prepared via a chemical combustion method using urea as fuel for reaction initiation. The starting raw materials consisted of Ni(NO3)2·6H2O (99.0%, Kanto Chemical), La(NO3)3·6H2O (99.99%, Sigma-Aldrich), Sr(NO3)2 (99.0%, Sigma-Aldrich), deionized water, citric acid (C6H8O7·H2O, 99.7%), and urea (CH4N2O, 99.0%). Details of the preparation method are given in elsewhere.29 To obtain LSNO-NPs, the dried porous precursor was calcined at 1000 °C for 6 h.2.2 Preparation of LSNO-NPs/PVDF composites
LSNO-NPs/PVDF composites with different volume fractions of LSNO-NPs (fLSNO = 0, 0.05, 0.1, 0.15, 0.2, 0.25, 0.3, 0.35 and 0.4) were prepared using a liquid-phase assisted dispersion method.1,15,17 First, the prepared LSNO-NPs and purchased PVDF (Sigma-Aldrich) were mixed by ball-milling in absolute ethanol for 5 h using ZrO2 balls. Second, the mixture was further dried to evaporate the absolute ethanol. Finally, the dried powders were molded by hot-pressing them at about 200 °C and ≈10 MPa for 30 min. The final LSNO-NPs/PVDF composite samples had a disc-shape that was 12 mm in diameter and 1 mm in thickness.2.3 Characterization techniques and dielectric measurements
Transmission electron microscopy (TEM) (FEI Tecnai G2, Eindhoven, Netherlands) was used to reveal the morphologies of LSNO-NPs. X-ray diffraction (XRD) (PANalytical, EMPYREAN) and scanning electron microscopy (SEM) (SEC, SNE4500M) were used to characterize the phase composition and microstructure of LSNO powder and LSNO-NPs/PVDF composites, respectively. Prior to characterizing the microstructure using SEM, polymer nanocomposite samples were initially immersed in liquid N2 and fractured. The cross-sections of the samples were coated by Au sputtering. Thermogravimetric analyses (TGA) were performed using a Pyris Diamond TGA/DTA (PerkinElmer Instrument) with alumina as the reference material. The experiments were carried out at a heating rate of 10 °C min−1 in a flowing N2 atmosphere (flow rate: 100 cm3 min−1). The dielectric properties were measured using a KEYSIGHT E4990A Impedance Analyzer over the frequency range of 102 to 106 Hz at room temperature (RT) with an oscillation voltage of 500 mV. Ag paint was used as an electrode material.3. Results and discussion
Fig. 1 and its inset reveal the SEM and TEM images of LSNO-NPs prepared by a combustion method and calcined at 1000 °C for 6 h. Particle sizes of LSNO-NPs with nearly spherical shape had diameters of about 100–200 nm. Using an XRD technique [Fig. 3], only one phase of LSNO (JCPDS 32–1241) with a tetragonal structure was detected in the XRD pattern of the calcined LSNO powder and it showed no impurity phases. According to the analyses of phase composition and powder morphologies, this synthesized LSNO powder is suitable for incorporation into PVDF polymer to enhance its ε′ value.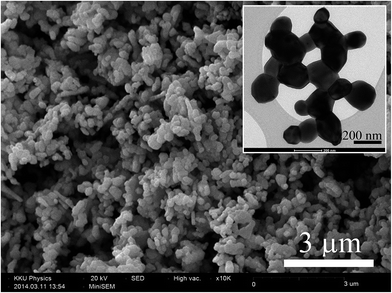 | ||
| Fig. 1 SEM image of LSNO nanoparticles obtained using a combustion method. The inset is a TEM image of LSNO nanoparticles calcined at 1000 °C for 6 h. | ||
Fig. 2 shows the SEM images of the fractured cross-section of pure PVDF polymer and LSNO-NPs/PVDF composites with various volume fractions of LSNO filler (fLSNO = 0.15, 0.25 and 0.30). In Fig. 2(a), the PVDF polymer sample prepared via a liquid-phase assisted dispersion and hot-pressing method formed a continuous phase. As shown in Fig. 2(b–d), LSNO-NPs were homogeneously dispersed in the PVDF polymer matrix. Furthermore, a 0–3 type composite structure was confirmed in the LSNO-NPs/PVDF composites, in which LSNO-NPs were randomly distributed and surrounded by a PVDF matrix.30 With increasing fLSNO, a small number of pores and small aggregates of LSNO-NPs were observed, as can be seen in Fig. 2(d). With regard to the effect of filler dispersion on the dielectric properties of polymer composites,17 we found that good dispersion of ceramic filler in the polymer matrix improved its dielectric properties.
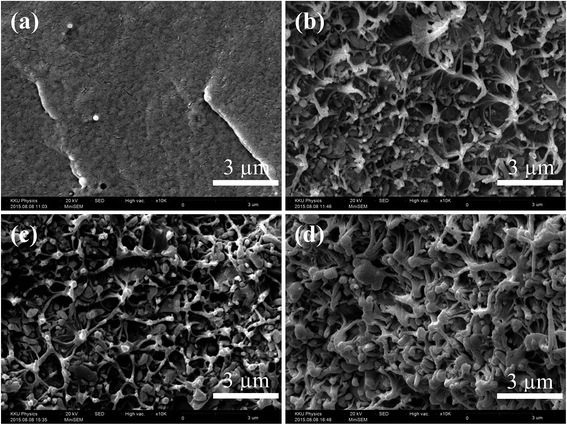 | ||
| Fig. 2 (a) SEM images of fracture cross section of pure PVDF polymer, (b) LSNO/PVDF nanocomposites with fLSNO = 0.15 (c) 0.25, and (d) 0.30. | ||
Fig. 3 illustrates the XRD patterns of LSNO powder, pure PVDF and LSNO-NPs/PVDF composites with different loading contents of LSNO (fLSNO = 0–0.35). The existence of an α-phase of PVDF was confirmed. With increasing fLSNO, the peak height of PVDF decreased. XRD peaks of PVDF were not observed in the composites with fLSNO > 0.25. This was due more to the presence of a volume fraction of LSNO-NPs than to that of a semi-crystalline PVDF phase. PVDF and LSNO phases were found, but no impurity phase was detected. It is notable that the XRD patterns of a LSNO-NPs phase were the same for all compositions. Generally, it would be suitable to evaluate and quantify the β-phase content, as it is the most relevant phase of PVDF for a large number of applications.31–33 Unfortunately, an β-phase of PVDF cannot be detected in the XRD patterns. This may be due to a small amount of this phase in pure PVDF and LSNO-NPs/PVDF composites.
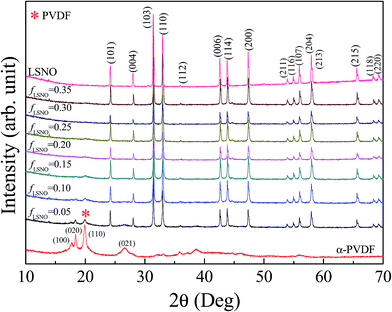 | ||
| Fig. 3 XRD patterns of LSNO nanoparticles, pure PVDF polymer and LSNO/PVDF nanocomposites with various fLSNO values. | ||
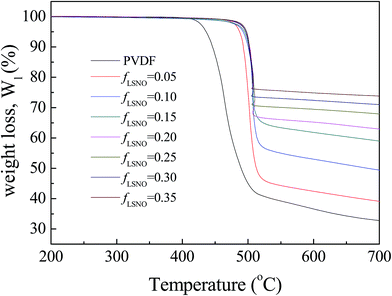
The thermal stability of the PVDF matrix as a result of incorporating LSNO-NPs was investigated. The TGA curves of PVDF and LSNO-NPs/PVDF composites are shown in Fig. 4. In the temperature range of 200–700 °C, the degradation behaviors of all the samples had a similar trend. Incorporation of LSNO-NPs into the PVDF polymer had no significant effect on its structure when compared to pure PVDF. The influence of LSNO-NPs on the thermal stability of PVDF–based composites was similar to that observed in Ba(Fe1/2Nb1/2)O3/PVDF nanocomposites.4 The thermal stability of LSNO-NPs/PVDF composites was better than that of the pure PVDF polymer. Homogeneous distribution of LSNO-NPs may inhibit the decomposition of the PVDF polymer.
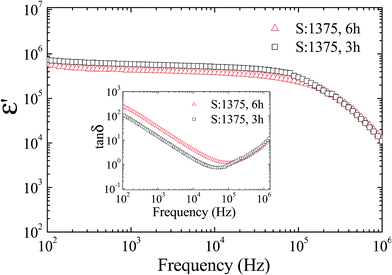
Generally, the ε′ values of composites with a low filler loading content (f < 0.3) for various ceramic/PVDF polymeric composites such as (Li + Ti) co-doped NiO/PVDF, BaTiO3/PVDF, CaCu3Ti4O12/PVDF, and Ba(Fe1/2Nb1/2)O3/PVDF composite systems were still lower than 50 at RT and 102 Hz.3,4,12,14,34 For example, the ε′ values at 1 kHz of CCTO/PVDF composites with fCCTO = 0.2 and 0.3 were ≈25 and ≈45, respectively.12 For Ba(Fe1/2Nb1/2)O3/PVDF nanocomposites with fBFN = 0.2 and 0.3, the ε′ values at 100 Hz were reported to be 25 and 40, respectively.4 With increasing f > 0.5, the ε′ values at RT and 102 Hz of these composites were still lower than 100. These results may be primarily caused by two factors: (1) ε′ values of these high-permittivity fillers used were not sufficiently large (ε′ ≈ 103–104)12,35,36 and (2) large ε′ values in these ceramics were generally associated with the insulating grain boundary response,21,36 and thus, there were no (or less) grain boundaries in ceramic particles incorporated into PVDF matrix. As illustrated in Fig. 5, low-frequency ε′ values at RT of sintered LSNO ceramics were extremely large (105–106) and they were nearly independent of frequency in the range of 102−105 Hz. The extremely large ε′ value of LSNO was intrinsically attributed to a small polaronic hopping mechanism in the grain interiors or inside particles.23,25–27 Therefore, such a large ε′ value is usually accompanied by large values of tan![[thin space (1/6-em)]](https://www.rsc.org/images/entities/char_2009.gif) δ and DC conductivity, as shown in the inset of Fig. 5. In addition to a small polaronic hopping mechanism inside the LSNO-NPs, it is expected that the dielectric response in LSNO-NPs/PVDF composites could arise the interfacial polarization of the interface between an insulting PVDF polymeric phase and semiconducting LSNO particles.
δ and DC conductivity, as shown in the inset of Fig. 5. In addition to a small polaronic hopping mechanism inside the LSNO-NPs, it is expected that the dielectric response in LSNO-NPs/PVDF composites could arise the interfacial polarization of the interface between an insulting PVDF polymeric phase and semiconducting LSNO particles.
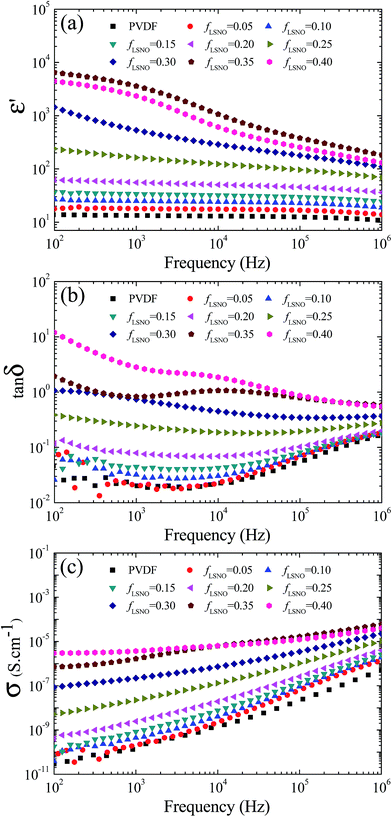
Regarding the essential properties of LSNO ceramics, the enhanced dielectric response in LSNO-NPs/PVDF composites may be larger than those of other ceramic/PVDF composites. As depicted in Fig. 6(a), ε′ of the LSNO-NPs/PVDF composites greatly increased with increasing loading content of LSNO-NPs. The ε′ value of pure PVDF polymer was slightly higher than 10 over the measured frequency range. ε′ of LSNO-NPs/PVDF composites continuously increased with increasing fLSNO from 0.10 to 0.25 over the measured frequency range. Interestingly, incorporating only 25 vol% of LSNO-NPs (fLSNO = 0.25) into PVDF can cause a great increase in ε′ of ≈205.9 and ≈158.8 at 100 Hz and 1 kHz, respectively, while the associated tan![[thin space (1/6-em)]](https://www.rsc.org/images/entities/char_2009.gif) δ values were 0.33 and 0.24, respectively. With further increases in fLSNO > 0.25, ε′ at 100 Hz greatly increased with increasing fLSNO. Notably, at fLSNO = 0.35, the ε′ values at 100 Hz and 1 kHz of the nanocomposites were 5523.6 and 3285.3, respectively, while tan
δ values were 0.33 and 0.24, respectively. With further increases in fLSNO > 0.25, ε′ at 100 Hz greatly increased with increasing fLSNO. Notably, at fLSNO = 0.35, the ε′ values at 100 Hz and 1 kHz of the nanocomposites were 5523.6 and 3285.3, respectively, while tan![[thin space (1/6-em)]](https://www.rsc.org/images/entities/char_2009.gif) δ at 1 kHz was 0.83. It is worth noting that the large increase in ε′ of LSNO-NPs/PVDF composites can be comparable to that observed in the multi walled carbon nanotube/poly(vinylidene fluoride) composite system.37
δ at 1 kHz was 0.83. It is worth noting that the large increase in ε′ of LSNO-NPs/PVDF composites can be comparable to that observed in the multi walled carbon nanotube/poly(vinylidene fluoride) composite system.37
Fig. 6(b) shows tan![[thin space (1/6-em)]](https://www.rsc.org/images/entities/char_2009.gif) δ as a function of frequency. For the LSNO-NPs/PVDF composites with fLSNO ≤ 0.25, the frequency-dependent behaviors of tan
δ as a function of frequency. For the LSNO-NPs/PVDF composites with fLSNO ≤ 0.25, the frequency-dependent behaviors of tan![[thin space (1/6-em)]](https://www.rsc.org/images/entities/char_2009.gif) δ were similar for all the samples. The increase in tan
δ were similar for all the samples. The increase in tan![[thin space (1/6-em)]](https://www.rsc.org/images/entities/char_2009.gif) δ in a high frequency range was attributed to the relaxation process of the PVDF polymer.10 At a low frequency, tan
δ in a high frequency range was attributed to the relaxation process of the PVDF polymer.10 At a low frequency, tan![[thin space (1/6-em)]](https://www.rsc.org/images/entities/char_2009.gif) δ of the LSNO-NPs/PVDF composites increased with increasing fLSNO. Usually, the large values of low-frequency tan
δ of the LSNO-NPs/PVDF composites increased with increasing fLSNO. Usually, the large values of low-frequency tan![[thin space (1/6-em)]](https://www.rsc.org/images/entities/char_2009.gif) δ of a dielectric material are associated with a long-range motion of free charge carriers, i.e., DC conduction and/or interfacial polarization of the accumulated charges at internal interfaces.38 This was confirmed by the observed increase in the low-frequency conductivity (σ) as the LSNO-NPs loading was increased [Fig. 6(c)].
δ of a dielectric material are associated with a long-range motion of free charge carriers, i.e., DC conduction and/or interfacial polarization of the accumulated charges at internal interfaces.38 This was confirmed by the observed increase in the low-frequency conductivity (σ) as the LSNO-NPs loading was increased [Fig. 6(c)].
Two distinct frequency-dependent dielectric behaviors of LSNO-NPs/PVDF composites were observed, as shown in Fig. 6(a). At fLSNO = 0–0.25, ε′ was nearly independent of frequency over the measured frequency range. In contrast, at fLSNO = 0.3–0.4, a strong frequency dependence of ε′ was observed. For the composites with fLSNO = 0.35 and 0.4, plateaus of ε′ were observed in the frequency range of 102–103 Hz. A step-like decrease in ε′ was observed in the range of 103–105 Hz, corresponding to an apparent tan![[thin space (1/6-em)]](https://www.rsc.org/images/entities/char_2009.gif) δ peak in this range. This indicates that dielectric relaxation behavior occurred rather than a dielectric response in a low-frequency range due to conductivity.38 The enhanced dielectric response in a low-frequency range may be correlated to strong interfacial polarization. Therefore, the greatly enhanced ε′ values in a low-frequency range when fLSNO ≥ 0.25 should be attributed to strong interfacial polarization. In contrast, ε′ values in a relatively high-frequency range for all samples (fLSNO = 0–0.4) may be primarily attributed to the largely intrinsic ε′ values of LSNO-NPs.
δ peak in this range. This indicates that dielectric relaxation behavior occurred rather than a dielectric response in a low-frequency range due to conductivity.38 The enhanced dielectric response in a low-frequency range may be correlated to strong interfacial polarization. Therefore, the greatly enhanced ε′ values in a low-frequency range when fLSNO ≥ 0.25 should be attributed to strong interfacial polarization. In contrast, ε′ values in a relatively high-frequency range for all samples (fLSNO = 0–0.4) may be primarily attributed to the largely intrinsic ε′ values of LSNO-NPs.
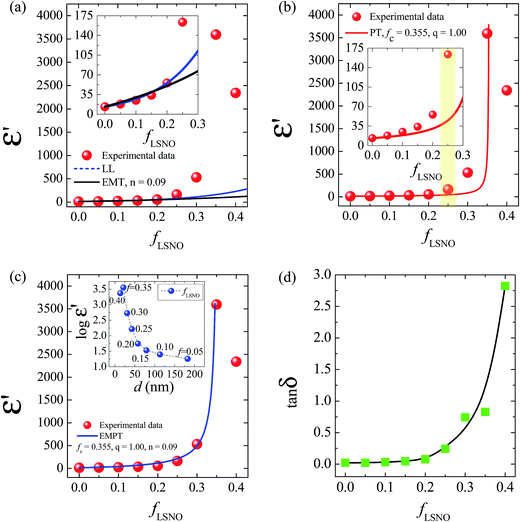
The volume fraction dependence of ε′ at 1 kHz of LSNO-NPs/PVDF composites was studied by fitting the experimental ε′ values with several appropriate models. This was performed to explain mechanisms of the overall dielectric behaviors for all filler volume fractions over the measured frequency range. Each technique used to understanding dielectric responses in LSNO-NPs/PVDF composites with different levels of fLSNO is described as follows. In first step, the experimental ε′ values were fitted using the effective medium theory (EMT) and Lichtenecker's logarithmic (LL) models following their respective relations:1,5
 | (1) |
εeff = fLSNO![[thin space (1/6-em)]](https://www.rsc.org/images/entities/char_2009.gif) ln ln![[thin space (1/6-em)]](https://www.rsc.org/images/entities/char_2009.gif) εLSNO + (1 − fLSNO)ln εLSNO + (1 − fLSNO)ln![[thin space (1/6-em)]](https://www.rsc.org/images/entities/char_2009.gif) εPVDF εPVDF
| (2) |
An abrupt change in the ε′ value of LSNO-NPs/PVDF composites was observed at around fLSNO = 0.3–0.35, which might have been caused by the formation of a percolation network of semiconducting LSNO-NPs in the PVDF matrix. Usually, a dramatic change in electrical and dielectric properties of metal (or semiconductor)−insulator composites in a critical volume fraction of filler is caused by the percolation effect.39 Thus, in second step, the rapid increase in the experimental ε′ values as well as the continuous increase in ε′ in a low fLSNO range was fitted using the power law of the percolation theory (PT):39
 | (3) |
It was observed that the EMT and PT models can describe the dielectric behavior of LSNO-NPs/PVDF composites only in cases of low and high filler loading, respectively. Therefore, a combination of these two models may be better than either model alone. In final step, the effective medium percolation theory model (EMPT) was used to fit the dielectric behavior of LSNO-NPs/PVDF composites. εeff of the EMPT model is expressed as follows:40
 | (4) |
Using the same fitting conditions in the EMT and PT models, the fitted result of EMPT model nearly matches the experimental ε′ values over filler loading contents ranging from fLSNO = 0 to 0.4 [Fig. 7(c)]. The best fitting parameters for the EMPT model werefc = 0.355, n = 0.09, and q = 1.0. Theoretically, fc of a spherical-shaped metal/polymer composite is about 0.16,39 which is much smaller than fc = 0.355 for the LSNO-NPs/PVDF composites. Usually, fc increases with decreasing conductivity of the fillers.39 A large fc value was therefore due to the semiconducting property of the LSNO-NPs. According to the fitted results using the EMPT model, it is likely that more than one mechanism had a significant influence on the dielectric responses of LSNO-NPs/PVDF composites. All possible mechanisms in the distinct loading contains of filler can be described as follows.
For the composites with fLSNO = 0–0.2, the continuous increase in ε′ in with low filler loading contents was dominated by the intrinsic polarization inside the LSNO-NPs. Interfacial polarization at the interface between semiconducting LSNO-NPs and insulating PVDF layers had an effect on the dielectric response in this range, but it was small because of a low polarized interfacial area. The average distance (d) between neighboring particles in the PVDF matrix for various filler volume fractions can be calculated from the relation d = r[(4π/3fLSNO)1/3 − 2], where r is the average radius of LSNO-NPs.41,42 As shown in the inset of Fig. 7(c), the interparticle distance was larger than 50 nm when fLSNO ≤ 0.2. It is likely that the formation of microcapacitors in the LSNO-NPs/PVDF composites with fLSNO = 0–0.2 was not dominate due to the large distance between neighboring LSNO-NPs. Consequently, electromagnetic coupling between particles was very weak, and hence the local electric field and ε′ value were very low. Generally, a low-frequency tan![[thin space (1/6-em)]](https://www.rsc.org/images/entities/char_2009.gif) δ value of a dielectric is correlated with a long range transfer of electrons. Conduction in a composite can occur by electron transfer between the conducting particles in intimate contact and/or by tunneling of electrons between the uncontacted particles at distances of less than 10 nm.41,42 As illustrated in Fig. 7(d), tan
δ value of a dielectric is correlated with a long range transfer of electrons. Conduction in a composite can occur by electron transfer between the conducting particles in intimate contact and/or by tunneling of electrons between the uncontacted particles at distances of less than 10 nm.41,42 As illustrated in Fig. 7(d), tan![[thin space (1/6-em)]](https://www.rsc.org/images/entities/char_2009.gif) δ slightly increased with increasing fLSNO in the range of 0–0.2. All composites exhibited a very small tan
δ slightly increased with increasing fLSNO in the range of 0–0.2. All composites exhibited a very small tan![[thin space (1/6-em)]](https://www.rsc.org/images/entities/char_2009.gif) δ<0.1 at 1 kHz. This is because the LSNO-NPs were separated from each other and roughly thought to be completely surrounded by a thick layer of an insulating PVDF matrix (>50 nm). So, contact between particles and tunneling of electrons could not occur.
δ<0.1 at 1 kHz. This is because the LSNO-NPs were separated from each other and roughly thought to be completely surrounded by a thick layer of an insulating PVDF matrix (>50 nm). So, contact between particles and tunneling of electrons could not occur.
For the composites with fLSNO = 0.25–0.35, the drastic increase in ε′ may have been caused by the percolation effect. Although the increase in tan![[thin space (1/6-em)]](https://www.rsc.org/images/entities/char_2009.gif) δ was more dominant than that of the composites with fLSNO ≤ 0.2, tan
δ was more dominant than that of the composites with fLSNO ≤ 0.2, tan![[thin space (1/6-em)]](https://www.rsc.org/images/entities/char_2009.gif) δ slightly increased when fLSNO was increased from 0.3 to 0.35. Thus, formation of a percolation network was unlikely occurred, corresponding to the theoretical fitted value forfc = 0.355. Furthermore, when fLSNO was increased from 0.25 to 0.35, the interparticle distance was reduced from ≈44 to ≈22 nm. Thus, tunneling of electrons between particles with a large distance from each other (>10 nm) still could not happen, allowing these materials to retain their low tan
δ slightly increased when fLSNO was increased from 0.3 to 0.35. Thus, formation of a percolation network was unlikely occurred, corresponding to the theoretical fitted value forfc = 0.355. Furthermore, when fLSNO was increased from 0.25 to 0.35, the interparticle distance was reduced from ≈44 to ≈22 nm. Thus, tunneling of electrons between particles with a large distance from each other (>10 nm) still could not happen, allowing these materials to retain their low tan![[thin space (1/6-em)]](https://www.rsc.org/images/entities/char_2009.gif) δ values (<1.0 at RT and 1 kHz). With increasing filler loading of LSNO-NPs in a PVDF matrix, the interfacial area, which can be roughly estimated to be equal to the total surface area of LSNO-NPs, greatly increased. This is one of the most important factors contributing to the enhanced ε′ value.41 Another important cause is that the interparticle distance was lessened, but the LSNO-NPs were still separated by a PVDF layer. When the thickness of the PVDF layer between LSNO-NPs was sufficiently reduced to nearly 10 nm, an overlapping of diffused double layer charge clouds, i.e., Debye length, around the semiconducting LSNO-NPs may have formed.41,43 The electromagnetic coupling between semiconducting LSNO-NPs surfaces became stronger, thereby increasing the local electric field strength. In this case, it can be expected that the electric field strength was sufficiently strong to orientate the dipoles in PVDF layer of neighboring particles. Both the charge ordering polarization inside LSNO-NPs and dipolar polarization in the PVDF layers can cause a sudden increase in ε′. This explanation from the viewpoint of a microcapacitor structure can be reasonably described as follows. Under an applied external electric field, induced surface charges of neighboring LSNO-NPs behaved as electrode-like plates, in which they were separated by an insulating PVDF dielectric-layer. With increasing fLSNO, a large number of microcapacitors were produced in the PVDF matrix. The capacitance of each microcapacitor was enhanced because the thickness of the PVDF layer was reduced, resulting from shorter interparticle distances. The explanation of the results in terms of a microcapacitor network in a conductive/polymer composite was clearly demonstrated by Ricardo et al.44 The numerical model was developed and successfully compared to the experimental result. They have demonstrated that below the percolation threshold, highly dispersed conductive fillers can form capacitor networks in the polymer matrix. Furthermore, it was shown that ε′ and the dielectric strength of the conductive/polymer composite were greatly dependent on the distribution of fillers, leading to high deviations of the electrical properties.
δ values (<1.0 at RT and 1 kHz). With increasing filler loading of LSNO-NPs in a PVDF matrix, the interfacial area, which can be roughly estimated to be equal to the total surface area of LSNO-NPs, greatly increased. This is one of the most important factors contributing to the enhanced ε′ value.41 Another important cause is that the interparticle distance was lessened, but the LSNO-NPs were still separated by a PVDF layer. When the thickness of the PVDF layer between LSNO-NPs was sufficiently reduced to nearly 10 nm, an overlapping of diffused double layer charge clouds, i.e., Debye length, around the semiconducting LSNO-NPs may have formed.41,43 The electromagnetic coupling between semiconducting LSNO-NPs surfaces became stronger, thereby increasing the local electric field strength. In this case, it can be expected that the electric field strength was sufficiently strong to orientate the dipoles in PVDF layer of neighboring particles. Both the charge ordering polarization inside LSNO-NPs and dipolar polarization in the PVDF layers can cause a sudden increase in ε′. This explanation from the viewpoint of a microcapacitor structure can be reasonably described as follows. Under an applied external electric field, induced surface charges of neighboring LSNO-NPs behaved as electrode-like plates, in which they were separated by an insulating PVDF dielectric-layer. With increasing fLSNO, a large number of microcapacitors were produced in the PVDF matrix. The capacitance of each microcapacitor was enhanced because the thickness of the PVDF layer was reduced, resulting from shorter interparticle distances. The explanation of the results in terms of a microcapacitor network in a conductive/polymer composite was clearly demonstrated by Ricardo et al.44 The numerical model was developed and successfully compared to the experimental result. They have demonstrated that below the percolation threshold, highly dispersed conductive fillers can form capacitor networks in the polymer matrix. Furthermore, it was shown that ε′ and the dielectric strength of the conductive/polymer composite were greatly dependent on the distribution of fillers, leading to high deviations of the electrical properties.
When a filler load of LSNO-NPs was incorporated into PVDF at levels higher than fc (≈0.355), ε′ of the LSNO-NPs/PVDF composite greatly decreased [Fig. 7(c)], while tan![[thin space (1/6-em)]](https://www.rsc.org/images/entities/char_2009.gif) δ significantly increased [Fig. 7(d)]. As depicted in the inset of Fig. 7(c), when fLSNO = 0.4, the calculated interparticle distance was ≈14 nm, which is very close to the lower theoretical limit thickness of the PVDF layer (10 nm) necessary to inhibit conduction of free charges. Therefore, the possibility of electron tunneling between the uncontacted particles separated by a thin layer of LSNO-NPs was very high. The percolation threshold was ≈0.355. Thus, conduction between particles in intimate contact could occur in composites with very high LSNO-NP filler loading. The interparticle distance was very much shortened, and the energy required for electron movement between the conducting phases across a PVDF layer can be negligible, giving rise to a frequency independent conductivity, as shown in Fig. 6(c).41
δ significantly increased [Fig. 7(d)]. As depicted in the inset of Fig. 7(c), when fLSNO = 0.4, the calculated interparticle distance was ≈14 nm, which is very close to the lower theoretical limit thickness of the PVDF layer (10 nm) necessary to inhibit conduction of free charges. Therefore, the possibility of electron tunneling between the uncontacted particles separated by a thin layer of LSNO-NPs was very high. The percolation threshold was ≈0.355. Thus, conduction between particles in intimate contact could occur in composites with very high LSNO-NP filler loading. The interparticle distance was very much shortened, and the energy required for electron movement between the conducting phases across a PVDF layer can be negligible, giving rise to a frequency independent conductivity, as shown in Fig. 6(c).41
4. Conclusions
The dielectric properties of PVDF polymer were successfully enhanced by incorporating it with LSNO-NPs, which were easily synthesized using a combustion method. liquid-phase assisted dispersion and hot-pressing methods were successfully used to prepare LSNO-NPs/PVDF composites with good dispersion of filler. Interestingly, incorporation of LSNO-NPs can cause improved thermal properties of a PVDF polymer. The greatly enhanced dielectric response, ε′ ≈ 3285 at 1 kHz, was accomplished by incorporating 35 vol% LSNO-NPs into a PVDF polymer, while a low tan![[thin space (1/6-em)]](https://www.rsc.org/images/entities/char_2009.gif) δ ≈ 0.83 was obtained. The overall ε′ values were well described by the EMPT model, indicating that there were several mechanisms contributing to the dielectric properties of the composites with different volume fractions of filler. For the composites with fLSNO ≤ 0.2, the observed continuous increase in ε′ was primarily attributed to the very large ε′ of the LSNO-NP filler. The dramatically enhanced ε′ of LSNO-NPs/PVDF composites in the range of fLSNO > 0.25–0.35 resulted from the large interfacial area between the semiconducting filler and insulating PVDF matrix combined with a very short interparticle distance between the LSNO-NPs (≈20–30 nm) separated by a thin layer of PVDF, creating largely capacitive microcapacitors in the composites.
δ ≈ 0.83 was obtained. The overall ε′ values were well described by the EMPT model, indicating that there were several mechanisms contributing to the dielectric properties of the composites with different volume fractions of filler. For the composites with fLSNO ≤ 0.2, the observed continuous increase in ε′ was primarily attributed to the very large ε′ of the LSNO-NP filler. The dramatically enhanced ε′ of LSNO-NPs/PVDF composites in the range of fLSNO > 0.25–0.35 resulted from the large interfacial area between the semiconducting filler and insulating PVDF matrix combined with a very short interparticle distance between the LSNO-NPs (≈20–30 nm) separated by a thin layer of PVDF, creating largely capacitive microcapacitors in the composites.
Acknowledgements
This work was financially supported by the Thailand Research Fund (TRF) and Khon Kaen University, Thailand [Grant No. RSA5880012]. K. Meeporn would like to thank the Thailand Research Fund through the Royal Golden Jubilee PhD Program (Grant No. PHD/0191/2556) for his PhD scholarship.References
- Z.-M. Dang, J.-K. Yuan, J.-W. Zha, T. Zhou, S.-T. Li and G.-H. Hu, Prog. Mater. Sci., 2012, 57, 660–723 CrossRef CAS.
- Z. M. Dang, J. B. Wu, L. Z. Fan and C. W. Nan, Chem. Phys. Lett., 2003, 376, 389–394 CrossRef CAS.
- Z.-M. Dang, H.-Y. Wang and H.-P. Xu, Appl. Phys. Lett., 2006, 89, 112902 CrossRef.
- Z. Wang, M. Fang, H. Li, Y. Wen, C. Wang and Y. Pu, Compos. Sci. Technol., 2015, 117, 410–416 CrossRef CAS.
- G. Chen, X. Wang, J. Lin, W. Yang, H. Li and Y. Wen, J. Phys. Chem. C, 2016, 120, 28423–28431 CAS.
- J. Bi, Y. Gu, Z. Zhang, S. Wang, M. Li and Z. Zhang, Mater. Des., 2016, 89, 933–940 CrossRef.
- L. Zhang, R. Gao, P. Hu and Z.-M. Dang, RSC Adv., 2016, 6, 34529–34533 RSC.
- Q. Huang, H. Luo, C. Chen, X. Zhou, K. Zhou and D. Zhang, J. Alloys Compd., 2017, 696, 1220–1227 CrossRef CAS.
- U. Yaqoob and G.-S. Chung, J. Alloys Compd., 2017, 695, 1231–1236 CrossRef CAS.
- X. Jiang, X. Zhao, G. Peng, W. Liu, K. Liu and Z. Zhan, Curr. Appl. Phys., 2017, 17, 15–23 CrossRef.
- M. Arbatti, X. Shan and Z. Y. Cheng, Adv. Mater., 2007, 19, 1369–1372 CrossRef CAS.
- P. Thomas, K. T. Varughese, K. Dwarakanath and K. B. R. Varma, Compos. Sci. Technol., 2010, 70, 539–545 CrossRef CAS.
- Y.-l. Su, C. Sun, W.-q. Zhang and H. Huang, J. Mater. Sci., 2013, 48, 8147–8152 CrossRef CAS.
- M. Fang, Z. Wang, H. Li and Y. Wen, Ceram. Int., 2015, 41(suppl. 1), S387–S392 CrossRef CAS.
- P. Kum-onsa, P. Thongbai, S. Maensiri and P. Chindaprasirt, J. Mater. Sci.: Mater. Electron., 2016, 27, 9650–9655 CrossRef CAS.
- K. Meeporn, S. Maensiri and P. Thongbai, Appl. Surf. Sci., 2016, 380, 67–72 CrossRef CAS.
- K. Silakaew, W. Saijingwong, K. Meeporn, S. Maensiri and P. Thongbai, Microelectron. Eng., 2015, 146, 1–5 CrossRef CAS.
- R. K. Goyal, S. S. Katkade and D. M. Mule, Composites, Part B, 2013, 44, 128–132 CrossRef CAS.
- B. Shri Prakash and K. B. R. Varma, Compos. Sci. Technol., 2007, 67, 2363–2368 CrossRef.
- C. Yang, H.-s. Song and D.-b. Liu, Composites, Part B, 2013, 50, 180–186 CrossRef CAS.
- R. Schmidt, M. C. Stennett, N. C. Hyatt, J. Pokorny, J. Prado-Gonjal, M. Li and D. C. Sinclair, J. Eur. Ceram. Soc., 2012, 32, 3313–3323 CrossRef CAS.
- J. Fu, Y. Hou, Q. Wei, M. Zheng, M. Zhu and H. Yan, J. Appl. Phys., 2015, 118, 235502 CrossRef.
- S. Krohns, P. Lunkenheimer, C. Kant, A. V. Pronin, H. B. Brom, A. A. Nugroho, M. Diantoro and A. Loidl, Appl. Phys. Lett., 2009, 94, 122903 CrossRef.
- J. Wang, G. Liu, B. W. Jia, X. Q. Liu and X. M. Chen, Ceram. Int., 2014, 40, 5583–5590 CrossRef CAS.
- A. Chouket, O. Bidault, V. Optasanu, A. Cheikhrouhou, W. Cheikhrouhou-Koubaa and M. Khitouni, RSC Adv., 2016, 6, 24543–24548 RSC.
- K. Meeporn, N. Chanlek and P. Thongbai, RSC Adv., 2016, 6, 91377–91385 RSC.
- X. Q. Liu, S. Y. Wu and X. M. Chen, J. Alloys Compd., 2010, 507, 230–235 CrossRef CAS.
- R. Kumar, A. M. Goswami and M. Kar, AIP Conf. Proc., 2016, 1728, 020580 CrossRef.
- K. Meeporn, T. Yamwong and P. Thongbai, Jpn. J. Appl. Phys., 2014, 53, 06JF01 CrossRef.
- Z. D. Liu, Y. Feng and W. L. Li, RSC Adv., 2015, 5, 29017–29021 RSC.
- P. Martins, A. C. Lopes and S. Lanceros-Mendez, Prog. Polym. Sci., 2014, 39, 683–706 CrossRef CAS.
- A. C. Lopes, C. M. Costa, R. S. i. Serra, I. C. Neves, J. L. G. Ribelles and S. Lanceros-Méndez, Solid State Ionics, 2013, 235, 42–50 CrossRef CAS.
- S. F. Mendes, C. M. Costa, C. Caparros, V. Sencadas and S. Lanceros-Méndez, J. Mater. Sci., 2012, 47, 1378–1388 CrossRef CAS.
- Z.-M. Dang and C.-W. Nan, Ceram. Int., 2005, 31, 349–351 CrossRef CAS.
- A. R. West, T. B. Adams, F. D. Morrison and D. C. Sinclair, J. Eur. Ceram. Soc., 2004, 24, 1439–1448 CrossRef CAS.
- X. Sun, J. Deng, S. Liu, T. Yan, B. Peng, W. Jia, Z. Mei, H. Su, L. Fang and L. Liu, Appl. Phys. A: Mater. Sci. Process., 2016, 122, 864 CrossRef.
- P. Costa, J. Silva and S. Lanceros Mendez, Composites, Part B, 2016, 93, 310–316 CrossRef CAS.
- P. Lunkenheimer, S. Krohns, S. Riegg, S. G. Ebbinghaus, A. Reller and A. Loidl, Eur. Phys. J.: Spec. Top., 2010, 180, 61–89 CrossRef.
- C. W. Nan, Y. Shen and J. Ma, Annu. Rev. Mater. Res., 2010, 40, 131–151 CrossRef CAS.
- C. Li, S. Yu, S. Luo, W. Yang, Z. Ge, H. Huang, R. Sun and C.-P. Wong, RSC Adv., 2016, 6, 36450–36458 RSC.
- K. S. Deepa, M. T. Sebastian and J. James, Appl. Phys. Lett., 2007, 91, 202904 CrossRef.
- J. I. Hong, L. S. Schadler, R. W. Siegel and E. Mårtensson, Appl. Phys. Lett., 2003, 82, 1956–1958 CrossRef CAS.
- F. Claro, Phys. Rev. B: Condens. Matter Mater. Phys., 1982, 25, 7875–7876 CrossRef CAS.
- S. Ricardo, S. Jaime, V. Richard, S. Vítor, C. Pedro, G. João and L.-M. Senentxu, Nanotechnology, 2009, 20, 035703 CrossRef PubMed.
| This journal is © The Royal Society of Chemistry 2017 |

