
 Open Access Article
 This Open Access Article is licensed under a
 Creative Commons Attribution 3.0 Unported Licence
Controlled hydrogen generation using interaction of artificial seawater with aluminum plates activated by liquid Ga–In alloy
Jinrong Lu a,
Wenbo Yub,
Sicong Tana,
Lei Wanga,
Xiaohu Yanga and
Jing Liu*ac
a,
Wenbo Yub,
Sicong Tana,
Lei Wanga,
Xiaohu Yanga and
Jing Liu*ac
aBeijing Key Lab of CryoBiomedical Engineering, Key Lab of Cryogenics, Technical Institute of Physics and Chemistry, Chinese Academy of Sciences, Beijing 100190, China. E-mail: jliu@mail.ipc.ac.cn; Fax: +86-010-82543767; Tel: +86-010-82543765
bSchool of Material Science and Engineering, Tsinghua University, Beijing 100084, China
cDepartment of Biomedical Engineering, School of Medicine, Tsinghua University, Beijing 100084, China
First published on 14th June 2017
Abstract
Recent studies have disclosed that liquid metal (Ga–In alloy) can be applied to activate aluminum in electrolytes to generate hydrogen at room temperature. To present a close to reality experimental demonstration of this method and to realize a continuous reaction between an Al plate and seawater, the liquid metal GaIn10 alloy is adopted to directly erode the surface of the Al plate. Then the eroded Al plate is immersed into NaCl solution (simulated seawater) to produce hydrogen. The results indicate that the existence of gallium can accelerate the average H2 production rate. In addition, the average hydrogen generation rate increased from 3 × 10⁻⁵ L s−1 to 4.5 × 10⁻⁴ L s−1 as the temperature rose from 20 °C to 80 °C when the corrosion area of the Al plates was 1 × 10⁻⁴ m2. However, the H2 production first increased and then decreased with the increase of NaCl concentration. The average hydrogen generation effectiveness is 0.71 L g−1 in the aluminum–water reaction in 5% NaCl solution at 20 °C within 20 min. Over the experimental process, the capability of producing hydrogen has a linear relationship with the corrosion area on the surface of the Al plates corroded by the liquid metal. This work suggests good prospects in the future practice of large-scale hydrogen generation using Al and seawater as reaction sources.
1. Introduction
Hydrogen is regarded as the next generation clean energy.1 Traditional hydrogen production strategies are to decompose water using solar energy or electrolysis.2–7 But the high energy consumption and poor controllability in the decomposition process often lead to serious technical bottlenecks for large scale utilization of hydrogen. In addition, the flammable and explosive characteristics also increase the difficulty of H2 storage and transportation.8,9 Hence, it is critical to find and develop a highly convenient method of H2 production for the coming increasing use.As one of the critical energy storage materials, Al possesses many advantages, such as low cost, high energy density and large reserves.10 In addition, the on-site and instant hydrogen generation using Al or its alloys and water can ensure a high level of safety.11–19 For example, Kazuhiko et al.12 showed that Al could continuously react with water under low vacuum at temperatures above 40 °C. Generally, the powders of Al or Al alloys are used as raw materials to enhance the efficiency.11–14 The Al powders are often milled in vacuum or inert gases to reduce the particles size.15 However, the oxidation of Al can form a dense protective alumina film on its surface. This protective surface restrains the Al–water reaction and seriously limits the further development of this technology.16–20 Therefore, an acid or alkali is often introduced into the solution to promote the modified Al–water reaction. But the use of strong acid or alkali for large-scale hydrogen production would have adverse effects.16–18 Recent studies reveal that mixing Al and liquid metal in electrolyte can trigger the direct generation of hydrogen, which differs from the traditional strategy of the Al–water reaction for hydrogen production.19,20 The oxide layer on Al foil can be easily destroyed by a liquid metal (such as Ga or its alloy) at room temperature.20 However, the liquid alloy needs to be sealed to avoid its contact with water in case of explosion.
As is known, seawater covers most of the earth's surface. It is considered as a potential reservoir for producing hydrogen gas.21 Chen et al.22 revealed that a mixture of Al, CaO and salt powder could be used as the starting material to prepare Al-based materials by the mechanical ball-milling method for hydrogen generation. This has proven that hydrogen gas can typically be generated through inserting the treated Al alloys in NaCl solution (the main content of sea water). However, the starting materials are somewhat complex and the procedures significantly increase the cost. Based on the above discussion, to reduce the cost of H2 generation and guarantee security, we aim to establish a direct way of producing hydrogen with solid Al plate treated by liquid metal and NaCl solution (simulated seawater). Furthermore, the influence of the NaCl concentration and temperature on the hydrogen generation rate will be investigated.
2. Experimental section
6061 aluminum-alloy plates, liquid metal GaIn10 (10 wt% In) and NaCl aqueous solution were used as the raw materials in this work. The experimental process is given in Fig. 1. The Al plates with dimensions of 10 mm × 10 mm × 3 mm were polished using diamond paste. Then the surface of the Al plate was ultrasonically cleaned in ethanol for 20 min. To destroy the Al2O3 film, the liquid metal GaIn10 was kept on the surface of the Al plate for 10–30 min. After that, the liquid metal was recycled in a glass flask by spraying alcohol on the surface of the Al, as shown in Fig. 1e. Finally, the prepared Al plate was immersed into NaCl solution with different concentrations. Fig. 1f shows that the volume of hydrogen was measured by a flowmeter. When the processed samples with a rough surface were immersed into NaCl solution, a vigorous reaction occurred and large amounts of hydrogen bubbles were observed on the surface of the Al plate. Basically, when the Al plate was immersed into NaCl solution, H2 was produced almost immediately.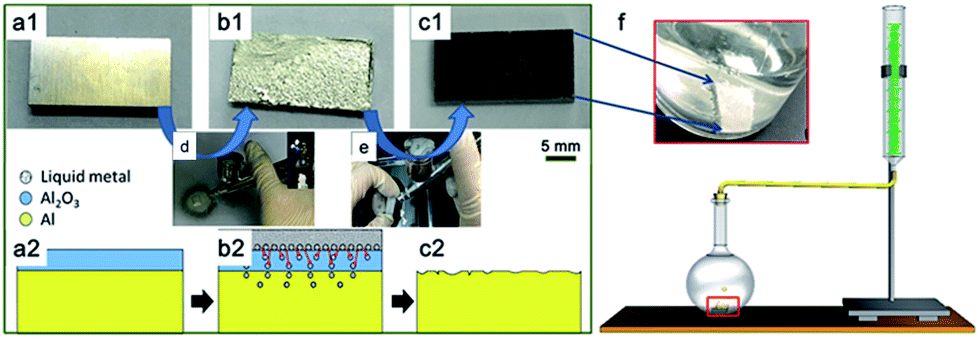 | ||
| Fig. 1 (a1), (b1) and (c1) The pre-processing of Al plate surface modified by liquid metal; (a2), (b2) and (c2) the schematic diagrams representing (a1), (b1) and (c1) processes, respectively; (d) the coating process via spray painting; (e) the recycling process of liquid metal; (f) illustration of the hydrogen generation process. The inset inside the flask indicates the reaction process and the hydrogen gas (bubbles) generates rapidly on the Al surface. | ||
In order to study the dependence of the amount of hydrogen generated on the corrosion area, Al plates of the same size (10 mm × 10 mm × 3 mm) were used. One side of the surface was covered with liquid metal, so the corrosion area of one Al plate is 1 × 10⁻⁴ m2.
Before and after the reaction, the surface of the Al plate was observed using scanning electron microscopy (SEM) (S-4300, Hitachi, Ltd., Japan). The elemental distribution in the corrosion area was measured using energy dispersive spectrometry (EDS) (6853-H, HORIBA, Ltd., Japan). Furthermore, atomic force microscopy (AFM) (ICON2-SYS, Bruker Nano Inc.) was used to detect the surface roughness of the Al plates. Finally, the phase compositions of the samples were analyzed by X-ray diffraction analysis with a D/Max 2200 PC diffractometer (CuKα, Japan).
3. Results and discussion
3.1 Hydrogen generation
Fig. 2 shows the morphologies of the Al plates under different conditions, including the Al plate in water (Fig. 2a) and in NaCl solution (Fig. 2b), the Al plate processed by liquid metal in water (Fig. 2c) and in NaCl solution (Fig. 2d) respectively. Fig. 2a and b reveal that no bubbles were produced when the untreated Al plate was immersed in water and in NaCl solution. In contrast, when the Al plate treated using liquid metal was immersed in water (Fig. 2c) and NaCl solution (Fig. 2d), bubbles were generated on the Al plate surface, and an especially vigorous reaction occurred in Fig. 2d.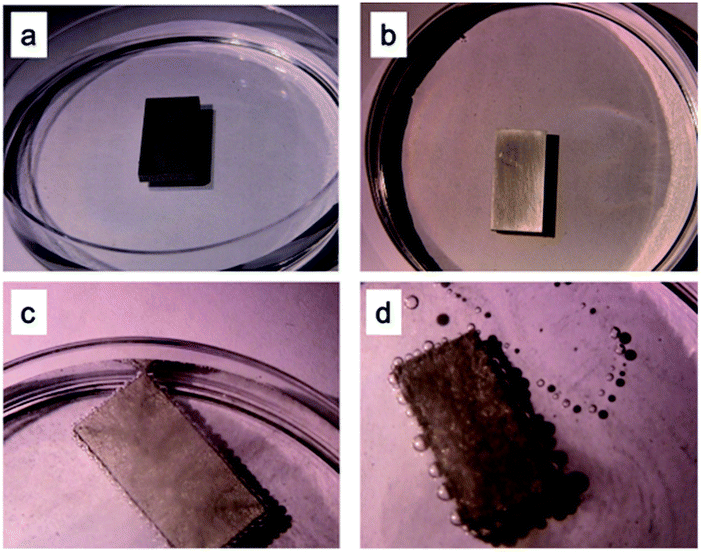 | ||
| Fig. 2 Hydrogen generation modes under 4 different conditions: (a) and (b) Al plate in water and in 5% NaCl solution; (c) and (d) the Al plate processed with liquid metal in water and in 5% NaCl solution. | ||
These results suggest that GaIn10 plays the role of catalyst and that the existence of NaCl can accelerate the H2 production rate. Furthermore, they demonstrate that the Al plate eroded by GaIn10 can be used for H2 generation at room temperature in atmosphere. In addition, this method is simpler and safer to run than those performed using Al powder and/or under high pressure and high temperature.12–18
Fig. 3 presents the variation of the generated H2 content with time and temperature under different concentrations of NaCl solution. Due to the large differences of the average H2 production rate in different conditions, the H2 production time is taken as the ordinate. Fig. 3a shows that the H2 production rate in NaCl solution is obviously higher than that in water. The average H2 production rate increased from 1 × 10⁻⁵ L s−1 to 5 × 10⁻⁵ L s−1 as the NaCl solution concentration increased from 0 to 15% at 20 °C when the corrosion area of Al plates is 1 × 10⁻⁴ m2. After that, the average H2 production rate decreased significantly to 3 × 10⁻⁵ L s−1 when the concentration increased to 20% as the corrosion area of Al plates is 1 × 10⁻⁴ m2.
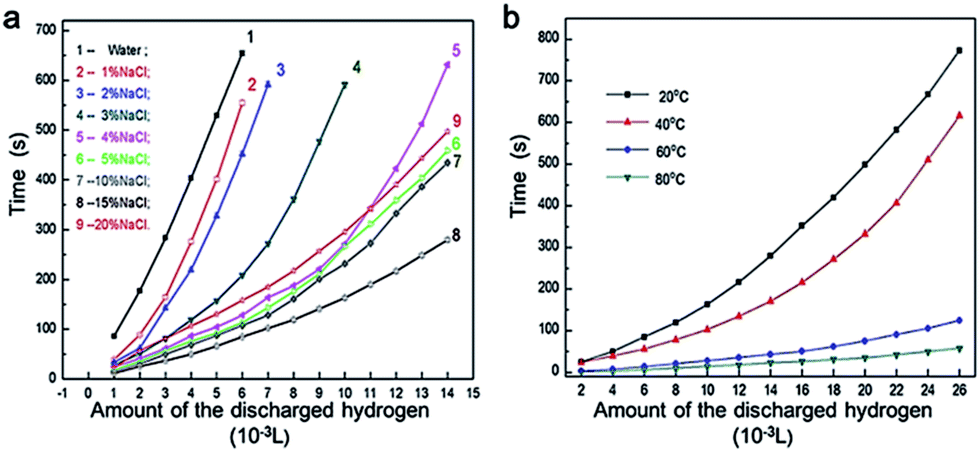 | ||
| Fig. 3 The relationship between the amount of discharged hydrogen and time: (a) under different concentrations of NaCl solution; (b) under different temperatures. | ||
Salt can impede the cold fusion of Al particles and thus reduced their size.23 In addition, the fresh surfaces of the Al particles were covered by salt, which prevented the formation of the oxidation. As a result, the effective contact between the water and small Al particles with huge specific areas remarkably enhanced the reaction kinetics.23,24 In terms of the influence of temperature, Fig. 3b reveals that the average H2 production rate increased continuously from 3 × 10⁻⁵ L s−1 to 4.5 × 10⁻⁴ L s−1 when the temperature increased from 20 °C to 80 °C in 5% NaCl solution as the corrosion area of Al plates is 1 × 10⁻⁴ m2. This strongly suggests that the hydrogen generation rate depends crucially on the initial temperature of the water. Therefore, it was feasible to employ the heat produced during the process of exothermic reaction between the Al and water.25
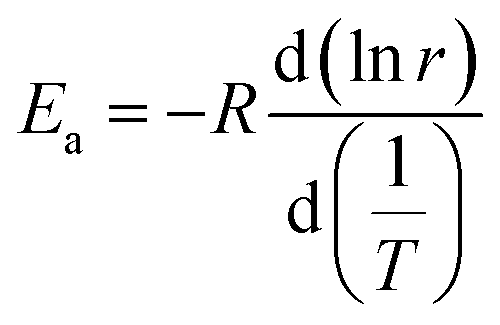
Based on Fig. 3b, Arrhenius plot (ln![[thin space (1/6-em)]](https://www.rsc.org/images/entities/char_2009.gif) r vs. T−1) can be obtained and the slope is used to calculate the activation energy (Ea) by using the following equation:26
r vs. T−1) can be obtained and the slope is used to calculate the activation energy (Ea) by using the following equation:26
 | (1) |
It has been calculated that the activation energy (Ea) of the hydrogen generation is 3.96 × 10⁴ J mol−1 in 5% NaCl solution.
After the erosion of the liquid metal (the corrosion area of one Al plate is 1 × 10⁻⁴ m2), the weight of the Al plate decreased from 1.601 g to 1.588 g, and the Al plate's weight decreased to 1.556 g after the H2 generation with 5% NaCl solution at 20 °C for 20 min.
Finally, 0.032 g of Al is consumed during this H2 generation and the amount of discharged hydrogen is 2.18 × 10⁻² L.
Fig. 4 depicts the dependence of the amount of discharged hydrogen on different amount of Al involved into the hydrolysis process in 5% NaCl solution at 20 °C for 20 min. It indicates that the amount of discharged H2 is proportional to the amount of Al. In reference to the following equation,27
| 2Al + 6H2O → 2Al(OH)3 + 3H2 | (2) |
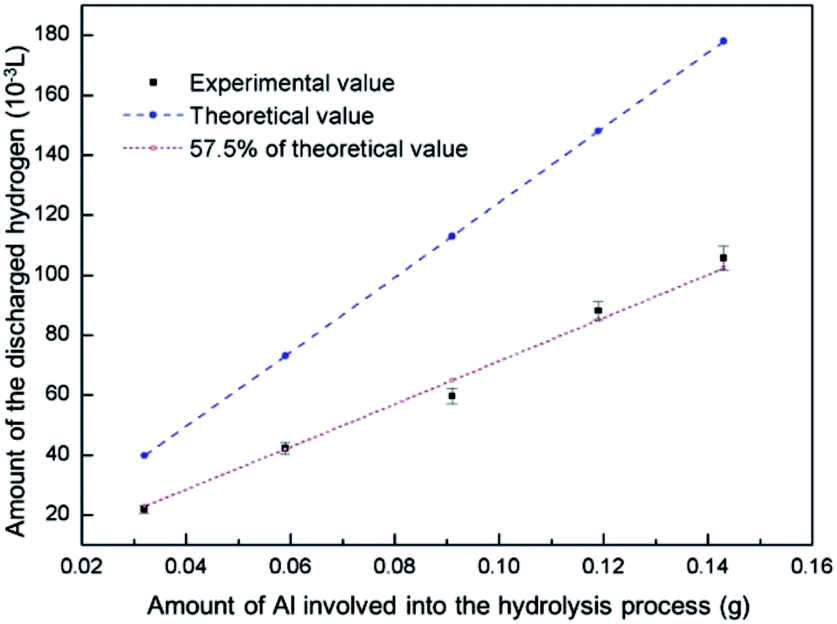 | ||
| Fig. 4 The relationship between the amount of Al involved into the hydrolysis process and the discharged hydrogen in 5% NaCl solution at 20 °C for 20 min. | ||
For comparison, some studies on the reaction of aluminum or its alloys with water for H2 generation are summarized. It is found that, the H2 conversion yields in Table 1 are mostly greater than the efficiency in our study. Especially, the conversion yield using Al alloys with different compositions as raw materials using melting at 82 °C could reach 100%.17 However, the high efficiency of these methods was based on the premise of the complex preparation processes such as ball milling14 or melting,17 which lead to a large amount of cost of human and material resources. What is more, all the raw materials are powers, even super fine powder,23 and some of the chemical reaction needs a alkaline environment to produce hydrogen.16,20
| Raw materials | Treatment | Temperature (°C) | H2 conversion yield | References |
|---|---|---|---|---|
| Al–Bi (hydride or solid salt) | Ball milling for 5 h | 25 | 93.4% | 14 |
| Al–Si alloys | Alkaline solution (NaOH, KOH, Ca(OH)2) | 25–75 | 76% | 16 |
| Al alloys with different compositions | Melting | 82 | 100% | 17 |
| Al–Si alloys | Alkaline solution (NaOH) and atomization of NaBH4 | 75 | 94% | 20 |
| Al–Ga–In–Sn–Zn powders | The powder particle sizes are less than 250 nm | 21 or 60 | 50–55% or 80–85% | 23 |
In contrast, due to the low-cost of the Al plate and seawater used in this study and the simple preparation technology as taken, the current result is suitable for various occasions.
Fig. 5 presents the influence of the GaIn10 infiltrated depth in the Al plate on the amount of discharged hydrogen. As shown in Fig. 5a, the infiltrated depth of GaIn10 into the Al plate increases linearly from 18.2 μm to 26.9 μm within 10–20 min at 20 °C, which is in accordance with the macroscopic diffusion rules. Subsequently, the average H2 production rate in 5 wt% NaCl solution at 20 °C was measured (Fig. 5b). The average H2 production rates are extracted as 2 × 10⁻⁵ L s−1 and 8 × 10⁻⁵ L s−1 in respect to the GaIn10 treatment time of 10 min and 30 min when the corrosion area of Al plates is 1 × 10⁻⁴ m2, respectively.
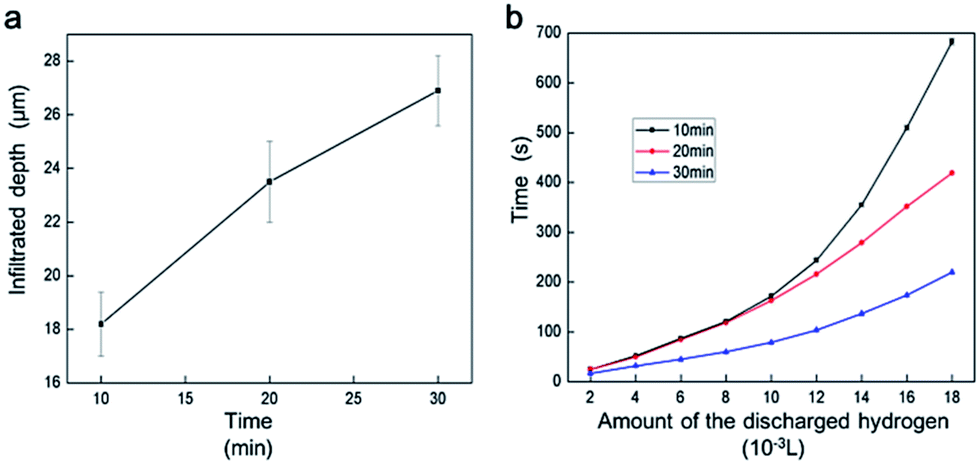 | ||
| Fig. 5 Influence of the infiltrated depth on the amount of discharged hydrogen: (a) relationship between the infiltrated depth and time; (b) relationship between the amount of discharged hydrogen and time at different infiltration times. | ||
Liquid metal is not only rather effective in removing the oxidation layer but also enables the Al–water reaction by transporting the Al in alloys to reaction sites.28,29 When the liquid metal is kept on the surface of the Al plate, Ga atoms can infiltrate into the grain boundaries of polycrystalline Al2O3. This can initiate intergranular failure in the Al2O3.30–32 Thus, when the liquid metal is recycled, the Al2O3 can be easily removed from the surface of the Al plate. Finally, the weight of the Al plate decrease, as shown in Fig. 4b. Moreover, the liquid metal continues to infiltrate into the Al plate and lowers the surface energy of the Al.30 With the increase of the infiltrated depth, more fine Al particles appear. As small size particles can enhance the reaction kinetics,23 the surface activity of the Al increase and the average H2 production rate is improved, as shown in Fig. 5b.
3.2 Topographies and content analysis
Fig. 6 presents the typical SEM micrographs of the plate surfaces combined with the corresponding AFM images in different conditions. For the untreated Al plate, Fig. 6a shows that the surface was smooth and intact. For the treated Al plate, Fig. 6b indicates that huge extensive cracks formed on the surface of the Al plate. The cracks were mainly located and propagated along the Al grain boundaries. After the H2 generation process, the cracks on the surface of the Al plate disappeared. Instead, snowflake lamella structures appeared, as shown in Fig. 6c. Furthermore, the average roughness (Ra) detected by AFM on the three regions are 106 nm, 421 nm and 630 nm, respectively. These results further confirmed that liquid metal GaIn10 could break up the Al2O3 layer on the Al plate surface and favored the penetration of H2O along the Al grain boundaries.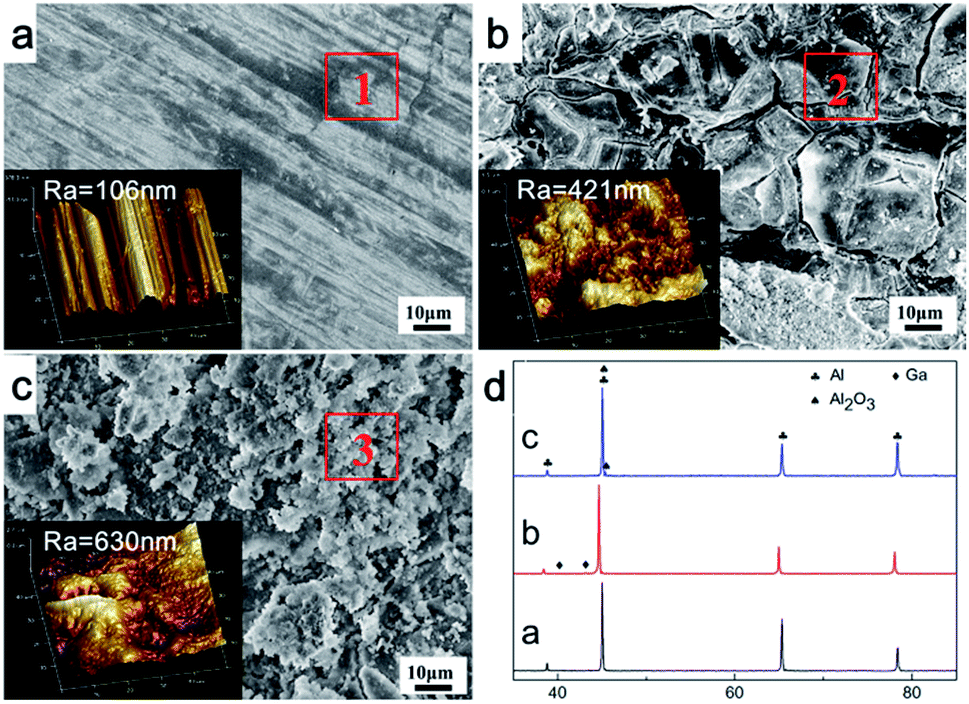 | ||
| Fig. 6 SEM images and the corresponding AFM images of Al plate surfaces: (a) pure Al plate; (b) Al plate corroded by liquid metal for 10 min at 20 °C; (c) Al plate after H2 production in 5% NaCl solution at 20 °C for 20 min; (d) XRD patterns of the three Al plate surfaces. | ||
Table 2 summarized the elemental composition of the three Al plates determined with EDS. The detected areas are marked as rectangles in Fig. 6. After the erosion of GaIn10 on the Al plate, 3.9 wt% of Ga and negligible amounts of In were detected, as revealed in Table 1 and the XRD analyses in Fig. 6d. This is in accordance with the reported results: Ga is highly soluble in solid Al while In is not.33,34 Here, it should be pointed out that the oxygen was eliminated for an approximate assumption in the EDS analysis, because the existence of oxygen could cause inaccurate measurement of Ga and In. After 20 minutes of H2 production, the Ga almost disappeared. The corresponding XRD diffraction patterns of the three Al plates reveal that Al2O3 and Al peaks can be observed in Fig. 6a and d(c), but not in Fig. 6c.
| Al | Mg | Ga | In | |
|---|---|---|---|---|
| 1 | 98.7 | 1.3 | 0 | 0 |
| 2 | 94.6 | 0.9 | 3.9 | 0.8 |
| 3 | 98.2 | 0.7 | 0.8 | 0.3 |
It has been reported that Ga atoms can incorporate into the Al lattice,35 which accounts for the absence of diffraction peaks of Ga or its compounds in the reaction products between the Al and liquid metal. As Ga atoms penetrated into the Al lattice,36,37 the diffraction peaks of Al in Fig. 6d(b) obviously shifted to smaller diffraction angles in comparison with Fig. 6d(a) and d(c).
Fig. 7 shows the elemental distribution obtained from mapping analyses with EDS in the final reaction products after H2 production. The weight percentage of different elements is summarized in Table 3. Na and Cl are found due to the NaCl solution. According to the reference,28 O should be from the reaction products of Al(OH)3. As the H2 production reaction happened at room temperature, it was impossible to form Al–Ga alloys.34 It can be estimated that Ga functions as a catalyst during H2 production. Ga atoms can incorporate into the Al lattice,35 as also shown in Fig. 6d. When the liquid metal is sprayed on the Al plate surface, liquid Ga penetrates into the Al plate along the Al grain boundaries. This results in a substantial loss of cohesion.38–40 As Ga penetrated into Al crystallites and destroyed the Al oxide film, the outermost layer of the Al plate cracked and formed tiny cracks, as shown in Fig. 6b. Finally, the reaction between Al and water can occur at room temperature once the Al surface is not blocked by oxide film.41 Furthermore, it has been reported that the H2 production rate between Al and water closely depends on the Al powder particle size, and powder with smaller particle sizes can offer a higher reaction rate because of the larger specific surface value.42 After being corroded, the surface layer of the Al plate is covered by tiny cracks and divided into small parts, which is similar to the Al particles shown in Fig. 6 in our study.
 | ||
| Fig. 7 Elemental distribution of the reaction products in hydrogen production: (a) SEM images of the reaction products; (b–g) distribution of different elements – Al, Mg, Ga, In, Na and Cl. | ||
| Element | Al | Mg | Ga | In | Na | Cl |
| Wt% | 80.98 | 0.97 | 3.15 | 0.59 | 4.31 | 10 |
4. Conclusions
In summary, a feasible method of producing hydrogen at room temperature through the direct reaction between GaIn alloy corroded Al plate and sodium chloride (NaCl) solution was successfully demonstrated. The main advantage of this method lies in its high reliability and low cost. Firstly, the average H2 production rate increased from 1 × 10⁻⁵ L s−1 to 5 × 10⁻⁵ L s−1 when increasing the NaCl solution concentration from 0 to 15%, then decreased to 3 × 10⁻⁵ L s−1 at 20 NaCl solution as the corrosion area of Al plates is 1 × 10⁻⁴ m2. Secondly, with increase of the temperature from 20 °C to 80 °C, the average H2 production rate increased from 3 × 10⁻⁵ L s−1 to 4.5 × 10⁻⁴ L s−1 as the corrosion area of Al plates is 1 × 10⁻⁴ m2. Thirdly, the amount of hydrogen generated was proportional to the corrosion area on the surface of the Al plates. The average hydrogen generation effectiveness was 0.71 L g−1 in 5% NaCl solution at 20 °C within 20 min, and the average efficiency of the hydrogen evolution was about 57.5%. Further research revealed that the outermost layer of Al plate cracked and formed tiny cracks due to penetration of the liquid Ga into the Al plate along the Al grain boundaries. This favored the reaction between Al and water. During the reaction processes, the liquid metal served as a catalyst and could be collected for repeated use. Future research will be aimed at improving the efficiency of hydrogen production.Acknowledgements
This work is partially supported by the Beijing Municipal Science and Technology Project (Grant No. Z151100003715002) and the China Postdoctoral Science Foundation (Grant No. 2016M590137). Great thanks are given to Dr Li-ting Yi, Mr Yu-jie Ding in the lab for their help in the experiments.References
- A. Bauen, J. Power Sources, 2006, 157, 893 CrossRef CAS
.
- C. Wu, Progr. Chem., 2005, 17, 423 CAS
- W. Li, X. F. Gao and D. H. Xiong, et al., Chem. Sci., 2017, 8, 2952 RSC
- W. Li, X. Gao and X. Wang, et al., J. Power Sources, 2016, 330, 156 CrossRef CAS
- W. Li, D. Xiong and X. Gao, et al., Catal. Today, 2017, 287, 122 CrossRef CAS
- W. Li, X. Wang and D. Xiong, et al., Int. J. Hydrogen Energy, 2016, 41, 9344 CrossRef CAS
- X. Wang, W. Li and D. Xiong, et al., Adv. Funct. Mater., 2016, 26, 4067 CrossRef CAS
- J. Turner, G. Sverdrup and M. K. Mann, et al., Int. J. Hydrogen Energy, 2008, 32, 379 CAS
- M. Ball and M. Wietschel, Int. J. Hydrogen Energy, 2009, 34, 615 CrossRef CAS
- H. Z. Wang, D. Y. C. Leung and M. K. H. Leung, et al., Renewable Sustainable Energy Rev., 2009, 13, 845 CrossRef CAS
- Z. Y. Deng, J. M. F. Ferreira and Y. Tanaka, et al., J. Am. Ceram. Soc., 2007, 90, 1521 CrossRef CAS
- M. Kazuhiko, T. Kentaro and L. Daling, et al., Nature, 2006, 440, 295 CrossRef PubMed
- Z. Y. Deng, Y. F. Liu and Y. Tanaka, et al., J. Am. Ceram. Soc., 2005, 88, 2975 CrossRef CAS
- M. Q. Fan, L. X. Sun and F. Xu, J. Alloys Compd., 2008, 460, 125 CrossRef CAS
- W. Z. Gai, W. H. Liu and Z. Y. Deng, et al., Int. J. Hydrogen Energy, 2012, 37, 13132 CrossRef CAS
- L. Soler, J. Macanás and M. Muñoz, et al., J. Power Sources, 2007, 169, 114 CrossRef
- O. V. Kravchenko, K. N. Semenenko and B. M. Bulychev, et al., J. Alloys Compd., 2005, 397, 58 CrossRef CAS
- L. Soler, A. M. Candela and J. Macanás, et al., J. Power Sources, 2009, 192, 21 CrossRef CAS
- B. Yuan, S. C. Tan and J. Liu, Int. J. Hydrogen Energy, 2015, 41, 1453 CrossRef
- L. Soler, J. Macanás and M. Muñoz, et al., Int. J. Hydrogen Energy, 2007, 32, 4702 CrossRef CAS
- H. Elderfield and M. J. Greaves, Nature, 1982, 296, 214 CrossRef CAS
- X. Chen, Z. Zhao and M. Hao, et al., J. Power Sources, 2013, 222, 188 CrossRef CAS
- A. V. Ilyukhina, A. S. Ilyukhin and E. I. Shkolnikov, Int. J. Hydrogen Energy, 2012, 37, 16382 CrossRef CAS
- T. Hiraki, M. Takeuchi and M. Hisa, et al., Mater. Trans., 2005, 46, 1052 CrossRef CAS
- K. Mahmoodi and B. Alinejad, Int. J. Hydrogen Energy, 2010, 35, 5227 CrossRef CAS
- F. Wang, C. Li and X. Zhang, et al., J. Catal., 2015, 329, 177 CrossRef CAS
- Y. Yavor, S. Goroshin and J. M. Bergthorson, et al., Int. J. Hydrogen Energy, 2013, 38, 14992 CrossRef CAS
- E. Czech and T. Troczynski, Int. J. Hydrogen Energy, 2010, 35, 1029 CrossRef CAS
- J. T. Ziebarth, J. M. Woodall and R. A. Kramer, et al., Int. J. Hydrogen Energy, 2011, 3, 5271 CrossRef
- R. Stumpf and P. J. Feibelman, Phys. Rev. B: Condens. Matter Mater. Phys., 1996, 54, 5145 CrossRef CAS
- D. I. Thomson, V. Heine and M. W. Finnis, et al., Philos. Mag. Lett., 1997, 76, 281 CrossRef CAS
- E. Pereiro-López, W. Ludwig and D. Bellet, Acta Mater., 2004, 52, 321 CrossRef
- H. Okamoto, J. Phase Equilib. Diffus., 2012, 33, 413 CrossRef CAS
- A. V. Ilyukhina, O. V. Kravchenko and B. M. Bulychev, et al., Int. J. Hydrogen Energy, 2010, 35, 1905 CrossRef CAS
- M. V. Trenikhin, A. V. Bubnov and A. I. Nizovskii, Russ. J. Phys. Chem. A, 2016, 80, 1110 CrossRef
- W. Wang, D. M. Chen and K. Yang, Int. J. Hydrogen Energy, 2010, 35, 12011 CrossRef CAS
- S. Fung, X. Xu and Y. Zhao, et al., J. Appl. Phys., 1998, 84, 2355 CrossRef CAS
- C. D. S. Tuck, J. A. Hunter and G. M. Scamans, J. Electrochem. Soc., 1987, 134, 2970 CrossRef CAS
- A. V. Parmuzina and O. V. Kravchenko, Int. J. Hydrogen Energy, 2008, 33, 3073 CrossRef CAS
- A. V. Parmuzina, O. V. Kravchenko and B. M. Bulychev, et al., Russ. Chem. Bull., 2009, 58, 493 CrossRef CAS
- M. Rajagopalan, M. A. Bhatia and M. A. Tschopp, et al., Acta Mater., 2014, 73, 312 CrossRef CAS
- S. S. Razavi-Tousi and J. A. Szpunar, J. Alloys Compd., 2016, 679, 364 CrossRef CAS
| This journal is © The Royal Society of Chemistry 2017 |