 Open Access Article
Creative Commons Attribution 3.0 Unported Licence
The flame retardancy and smoke suppression effect of a hybrid containing dihydrogen phosphate anion modified reduced graphene oxide/layered double hydroxide on epoxy resin
Wenzong Xu *,
Bingliang Zhang,
Xiaoling Wang and
Guisong Wang
School of Materials Science and Chemical Engineering, Anhui Jianzhu University, 292 Ziyun Road, Hefei, Anhui 230601, People's Republic of China. E-mail: wenzongxu@ahjzu.edu.cn; Fax: +86-0551-63828157; Tel: +86-0551-63828157
First published on 3rd April 2017
Abstract
A hybrid with MgAl-layered double hydroxide loaded graphene (RGO–LDH) was synthesized by a co-precipitation method, and then dihydrogen phosphate anion (H2PO4−) modified RGO–LDH hybrid (RGO–LDH/P) was prepared through an ion exchange method. X-ray diffraction, Fourier transform infrared spectra, and transmission electron microscope-energy-dispersive X-ray spectroscopy results showed that RGO–LDH/P was synthesized successfully. RGO–LDH/P was added into epoxy resin (EP) to investigate the effect on flame retardancy and smoke suppression. Results showed that the limit oxygen index and char yield of EP with RGO–LDH/P increased, reaching 24.8% and 19.7%, respectively, compared with EP. Meanwhile, peak heat release rate, total heat release, smoke production rate and total smoke production of the EP composite decreased by 37.9%, 30.6%, 27.5%, and 38.4%, respectively. Improved flame retardancy and smoke suppression were attributed to the physical barrier of graphene and LDH, and the catalytic carbonization effect of LDH. In addition, H2PO4− had a role in promoting carbonization and further improving flame retardancy and smoke suppression.
1. Introduction
Properties of many traditional materials can no longer meet the requirements of different fields of social and economic development. As a result, there has been more research on new functional materials. Epoxy resin (EP) has been widely applied in electronic components, seals, adhesives, and flooring, due to its excellent electrical and mechanical properties, solvent and corrosion resistance, and high thermal stability.1–5 However, EP's inflammability in air, and resultant harmful smoke during the combustion process causes dangerous security risks. Therefore, a study of functional EP with good flame retardancy and smoke suppression properties is highly significant.In recent years, to improve the flame retardant property of polymers, flame retarding additives have become increasingly important. Among these flame retardants nanoscale fillers, such as graphene, LDH, MoS2, carbon nanotubes, and clay, have received wide attention.6–10 Graphene has been a focal area of research due to its large specific surface area and excellent mechanical, electrical and thermal properties.11,12 According to a number of studies, the flame retardancy of polymers can be increased by adding graphene, and this is mainly attributed to the graphene layer's role of a physical barrier in the combustion process of polymers, which effectively slows the volatilization of flammable gases, protects the matrix, and prevents further combustion.13 However, graphene is liable to re-aggregate due to the presence of van der Waals forces, resulting in poor dispersion of it in a polymer. In order to overcome this shortcoming, more and more researchers have focused on modifying the surface of graphene by means of Ni2O3, Co2O3, Cu2O, MoO3, and SiO2 loaded graphene.14–16 These modifications have shown improved dispersion of graphene. At the same time, they have also enhanced the flame retardancy and smoke suppression of polymers. LDH is now more and more applied to polymers as an effective agent of flame retardancy and smoke suppression. Its effectiveness mainly depends on a physical barrier effect of the LDH layer and the char residue formed during combustion that inhibit volatilization of flammable gas during the decomposition process of a polymer which isolates oxygen and reduces heat transmission. Meanwhile, heat is absorbed in the decomposition of LDH producing water vapor, reducing the temperature, and delaying the combustion process of the material.17 In addition, lots of anions exist in the space of the LDH layer due to the positive charge on its surface, thus providing a possibility for further modification. These anions can be replaced by other anions with flame retardancy and smoke suppression properties. For example, modifying LDH with molybdate anions, borate anions, phosphate ions, and nitrogen-containing anions can improve the flame retardancy and smoke suppression of composites further.18–21
As we know, although a single nanofiller can improve flame retardancy properties of a polymer, a large amount of the additive will be needed to compensate for its low efficiency, which may affect physical and mechanical properties of the polymer. A hybrid from two or more components usually exhibits good synergy.22,23 Therefore, it is possible that graphene, LDH, and phosphate anions can be selected to synthesize a new type of flame retarding and smoke suppressing agent by hybridization. In simple terms, first, LDH is loaded onto the surface of graphene to reduce its re-aggregation, and then phosphate ions are used to modify the LDH on the graphene surface by intercalating, improving the efficiency of flame retardancy and smoke suppression of the polymer with a further catalytic carbonization effect.
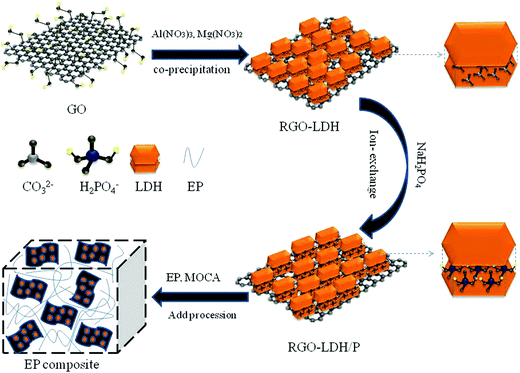
In this study, a hybrid of MgAl–LDH loaded graphene was synthesized through co-precipitation, and then H2PO4− was intercalated into the interlayer space of LDH by ion exchange to synthesize RGO–LDH/P; the whole synthesis strategy is presented in Scheme 1. The structure, composition, and morphology of RGO–LDH/P were characterized. Also, RGO–LDH/P was added into the epoxy resin and its functional mechanism was analyzed in detail.
2. Experimental
2.1 Materials
Natural graphite powder, sulfuric acid (98%), sodium nitrate, potassium permanganate, hydrochloric acid (37%), hydrogen peroxide (30%), absolute ethyl alcohol, nitric acid, hydrazine hydrate (80%), Al(NO3)3·9H2O, Mg(NO3)2·6H2O, sodium hydroxide, and sodium dihydrogen phosphate were purchased from Sinopharm Chemical Reagent Co., Ltd., China. Epoxy resin was purchased from Nantong Xingchen Synthetic Materials Co., Ltd., China. 3,3′-Dichloro-4,4′-diaminodiphenylmethane (MOCA) was purchased from Guangzhou Wenlong Chemical Co., Ltd., China.2.2 Preparation of RGO–LDH
GO was prepared by using the Hummers' method.24 0.64 g GO was added into 300 mL deionized water with 0.20 M NaOH and 0.05 M Na2CO3, obtaining an evenly dispersed GO solution by ultrasonication for 30 minutes. 3.84 g Mg(NO3)2·6H2O and 2.8 g Al(NO3)·9H2O were dissolved in 300 mL deionized water, and then dropped into the GO solution with vigorous stirring. The pH of the above solution was adjusted to 10.5 by using 0.5 M NaOH at 60 °C for 6 h. Then, 1.5 mL N2H2·H2O was added to it followed by heating for 2 h under 100 °C. Finally, the product was separated using centrifuge, washing with absolute ethyl alcohol and deionized water, and drying at 50 °C. Note that RGO and MgAl–LDH were prepared under the same conditions.2.3 Preparation of RGO–LDH/P
RGO–LDH/P was synthesized using an ion exchange method: 2 g RGO–LDH was dispersed in 100 mL deionized water with appropriate ultrasonic agitation. Then, 2.2 g NaH2PO4 was dissolved in 100 mL deionized water and added to the above solution, with the pH adjusted to 4.5, and rapid stirring at 60 °C for 2 h. After the reaction, the product was separated using a centrifuge, washed with absolute ethyl alcohol and deionized water and then dried at 50 °C.2.4 Preparation of EP composites
EP composites were prepared by blending with ultrasonication. For example, RGO–LDH/P was evenly dispersed in an appropriate acetone solution, and then it was mixed with EP by stirring rapidly at 60 °C with ultrasonic agitation to form a homogeneous mixture. A suitable amount of molten MOCA (curing agent) was added to the above mixture and mixed fully, poured into a Teflon mold, and allowed to sit overnight. Finally, the above mixture was cured at 110 °C for 2 h and at 150 °C for 2 h in an oven to prepare the EP composite. RGO, MgAl–LDH, and RGO–LDH were mixed with EP under the same conditions, respectively (the specific formulas are shown in Table 1).| Sample | EP (wt%) | RGO (wt%) | LDH (wt%) | RGO–LDH (wt%) | RGO–LDH/P (wt%) |
|---|---|---|---|---|---|
| EP | 100 | 0 | 0 | 0 | 0 |
| EP1 | 98 | 2 | 0 | 0 | 0 |
| EP2 | 98 | 0 | 2 | 0 | 0 |
| EP3 | 98 | 0 | 0 | 2 | 0 |
| EP4 | 98 | 0 | 0 | 0 | 2 |
2.5 Characterization
X-ray diffraction (XRD) measurements were performed using a Bruker D8 ADVANCE X-ray diffractometer (BRUKER, Germany) equipped with a Cu-Kα tube and Ni filter (λ = 0.1542 nm). Fourier transform infrared spectroscopic (FTIR) studies were carried out with a Nicolet 6700 FTIR spectrophotometer (Thermo Fisher Scientific, U.S.) using a standard KBr pellet technique. Transmission electron microscope-energy-dispersive X-ray spectroscopy (TEM-EDS) measurements were made using a JEM-2100 instrument (JEOL Co., Japan) with an acceleration voltage of 200 kV. Thermogravimetric analysis (TGA) was conducted on a STA 409PC (NETZSCH, Germany) thermogravimetric instrument under an air flow of 20 cc min−1. The samples were heated from room temperature to 700 °C. Cone calorimeter combustion tests were carried out on a JCZ-2 cone calorimeter (Jiangning Analytic Instrument Company, China) using ISO5660 standard procedures. Specimens with the size of 100 × 100 × 4 mm3 were irradiated under a heat flux of 50 kW m−2. Limited oxygen index (LOI) tests were performed with an HC-2 oxygen index meter (China) in accordance with ASTM D2863-2012 standard procedures. Dimensions of the specimens were 100 × 10 × 3 mm3. X-ray Photoelectron Spectroscopy (XPS) analysis was performed by using an Escalab 250 spectrometer (Thermo Scientific Ltd., U.S.) with an Al Kα excitation radiation (hν = 1486.6 eV).3. Results and discussion
3.1 Characterization of as-prepared samples
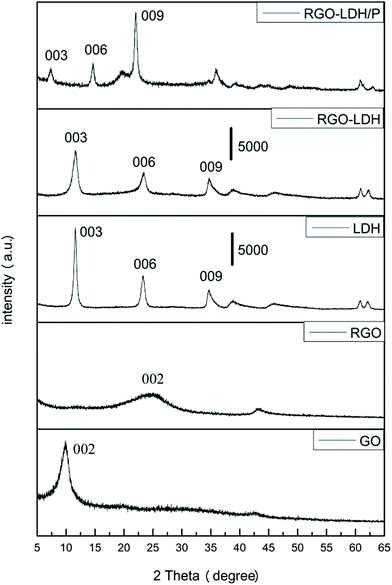
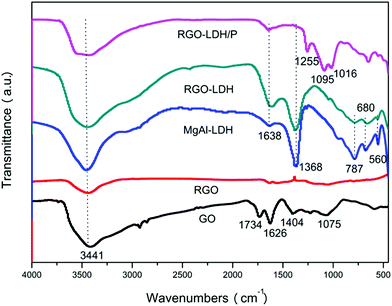
XRD patterns of GO, RGO, MgAl–LDH, RGO–LDH, and RGO–LDH/P are shown in Fig. 1. The pattern of GO has a diffraction peak at 2θ = 9.8°, corresponding to a (002) diffraction peak and indicating an interlayer spacing of 0.89 nm. This is greater than the interlayer spacing of graphite (0.32 nm) as oxygen functional groups were introduced into the interlayer spacing of GO.25 After reaction, the (002) plane of RGO is shown at 2θ = 24.9°, showing that the interlayer spacing is 0.36 nm, attributed to removal of the oxygen functional groups from the GO surface. The pattern of MgAl–LDH displays diffraction peaks at 2θ = 11.6°, 23.2°, and 34.7°, corresponding to the (003), (006), and (009) characteristic peaks, respectively. The interlayer spacing of MgAl–LDH is 0.76 nm from calculating the (003) peak, indicating the anion in the interlayer of LDH is CO3.2–26 The diffraction peak of RGO–LDH is almost the same as MgAl–LDH in the pattern, where the (002) characteristic peaks of RGO disappear, showing that LDH is spread on the RGO layer, effectively preventing the restacking of graphene. These results suggest that LDH loaded quite well onto the surface of the RGO layer, effectively preventing the re-aggregating of graphene.14 In addition, compared with MgAl–LDH, the diffraction peak's intensity of RGO–LDH is decreased (the scale-plate of 5000 represents the peak's intensity in the XRD pattern), and this is attributed to the introduction of graphene. The characteristic peaks of RGO–LDH/P moved to a low angle (2θ = 7.4°) in the XRD pattern, showing that H2PO4− was successfully intercalated into the interlayer of LDH.FTIR spectra of GO, RGO, LDH, RGO–LDH, and RGO–LDH/P are shown in Fig. 2. The characteristic bands of oxygen-containing functional groups can be observed in the GO spectrum: they include the O–H stretching vibration (3441 cm−1), C![[double bond, length as m-dash]](https://www.rsc.org/images/entities/char_e001.gif) O stretching vibration (1734 cm−1), bending vibration of adsorbed water (1626 cm−1), epoxy C–O stretching vibration (1404 cm−1), and alkoxy C–O stretching vibration (1075 cm−1).27 As for RGO, after a restoration reaction, characteristic bands of oxygen-containing functional groups are almost non-existent, showing that the oxygen functional groups on the surface of GO were removed. The FTIR spectrum of MgAl–LDH shows the O–H group stretching vibration peak (3441 cm−1), deformation vibration peak of water molecules (1640 cm−1), Al–O and Mg–O vibration absorption peak (672 cm−1), and vibration absorption of CO32− (1352 cm−1).28 Compared with MgAl–LDH, all characteristic peaks of LDH can be found in the spectrum of RGO–LDH and the decreased characteristic peak intensities of RGO–LDH are attributed to the introduction of RGO. The FTIR spectrum of RGO–LDH/P shows no characteristic peak near 1352 cm−1, compared with RGO–LDH, indicating that there is almost no CO32− in the interlayer of RGO–LDH/P. Meanwhile, the characteristic peaks at 1255, 1095, and 1016 cm−1 are attributed to P
O stretching vibration (1734 cm−1), bending vibration of adsorbed water (1626 cm−1), epoxy C–O stretching vibration (1404 cm−1), and alkoxy C–O stretching vibration (1075 cm−1).27 As for RGO, after a restoration reaction, characteristic bands of oxygen-containing functional groups are almost non-existent, showing that the oxygen functional groups on the surface of GO were removed. The FTIR spectrum of MgAl–LDH shows the O–H group stretching vibration peak (3441 cm−1), deformation vibration peak of water molecules (1640 cm−1), Al–O and Mg–O vibration absorption peak (672 cm−1), and vibration absorption of CO32− (1352 cm−1).28 Compared with MgAl–LDH, all characteristic peaks of LDH can be found in the spectrum of RGO–LDH and the decreased characteristic peak intensities of RGO–LDH are attributed to the introduction of RGO. The FTIR spectrum of RGO–LDH/P shows no characteristic peak near 1352 cm−1, compared with RGO–LDH, indicating that there is almost no CO32− in the interlayer of RGO–LDH/P. Meanwhile, the characteristic peaks at 1255, 1095, and 1016 cm−1 are attributed to P![[double bond, length as m-dash]](https://www.rsc.org/images/entities/char_e001.gif) O and P–O vibration peaks.29 Hence, it may be inferred that CO32− was replaced by H2PO4− in the interlayer of LDH.
O and P–O vibration peaks.29 Hence, it may be inferred that CO32− was replaced by H2PO4− in the interlayer of LDH.
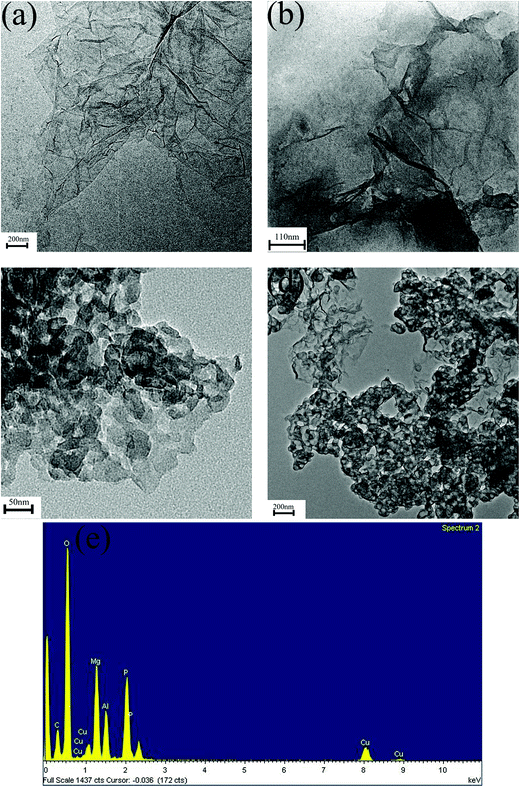
TEM is an effective method for directly observing the morphology of GO, RGO, RGO–LDH, and RGO–LDH/P; EDS is used to characterize the composition of elements from RGO–LDH/P. Fig. 3a indicates that GO has a very thin two-dimensional sheet structure with a little folded region. As shown in Fig. 3b, the folded layer region of RGO is obviously increased and some areas exhibit serious restacking, due to the presence of van der Waals forces. A lot of LDH lamellas loaded on the surface of graphene layer can be seen in Fig. 3c, showing that LDH was successfully loaded onto the graphene layer. Fig. 3d indicates that the contours of the LDH sheets are irregular after H2PO4− was intercalated into the RGO–LDH interlayer. This is mainly because the lattice structure of LDH was damaged slightly in the modification process. Meanwhile, the EDS of RGO–LDH/P is shown in Fig. 3e, where the elements of C, O, Mg, Al, and P are observable, further indicating that RGO–LDH/P was synthesized successfully.
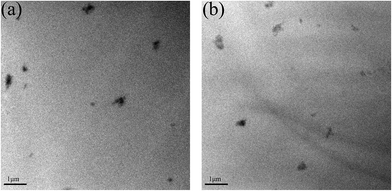
A good dispersion of inorganic nanofillers in a polymer is very important for the properties of the composites. TEM was used to investigate the dispersion of RGO–LDH and RGO–LDH/P in EP. The TEM observations of EP3 and EP4 ultrathin sections are displayed in Fig. 4. They indicate that the basic size of RGO–LDH and RGO–LDH/P ranges from 200 to 400 nm and there is no obvious agglomeration. These results show that RGO–LDH and RGO–LDH/P are well dispersed in EP.
3.2 Thermal behavior of EP composites
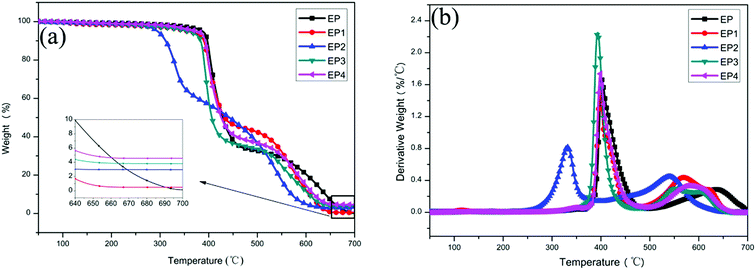
Thermogravimetric analysis was used to study the thermal degradation behavior of EP and EP composites. The TGA and DTG curves of EP, EP1, EP2, EP3, and EP4 composites in air are displayed in Fig. 5. The initial decomposition temperature (Tonset) is defined as the temperature at which the sample quality loss is 5 wt%; the maximum temperature (Tmax) is defined as the maximum temperature at which the sample reaches the fastest thermal decomposition rate. As shown in Fig. 5a and b and Table 2, the Tonset of EP is 378.1 °C, and Tmax is 403.4 °C. Compared with EP, the Tonset and Tmax of all composites decreased in various degrees, due mainly to the high thermal conductivity of graphene.30 Meanwhile, LDH has a catalytic coking effect which could promote the early thermal decomposition of composites.31 It is worth noting that the Tonset and Tmax of EP4 are improved, compared with EP3. These results show that H2PO4− can improve the thermal stability of the composites.| Sample | T5% (°C) | Tmax (°C) | Char yield (%) |
|---|---|---|---|
| EP | 378.1 | 402.5 | 0.12 |
| EP1 | 356.3 | 398 | 0.55 |
| EP2 | 294.8 | 398 | 0.55 |
| EP3 | 355.9 | 393.7 | 3.8 |
| EP4 | 374.9 | 399.3 | 4.79 |
The char yield of EP is 0.12% at 700 °C. Compared with neat EP, the char yields of all composites are increased significantly at 700 °C as listed in Table 2. Among them, the char yield of EP4 is the highest, reaching 4.79%. This is mainly because H2PO4− has a role of promoting the formation of char.
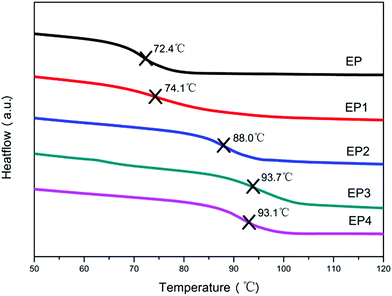
In order to further examine thermal behavior of the composites, DSC was used to study the effect of different flame retardants on the glass transition temperature (Tg) of EP. It can be observed from Fig. 6, the Tg of neat EP is 72.4 °C. Compared with EP, the Tg of all composites increased by various degrees after addition of different flame retardants. This is due primarily to the high specific surface and strong interface interaction of flame retardants as a physical barrier which could effectively hinder the mobility of polymer chains. In addition, it can be seen that the Tg of EP3 and EP4 are increased more than those of EP1 and EP2, compared with EP, and this is attributable to a better dispersion of RGO–LDH and RGO–LDH/P in EP.
3.3 Flame retardancy of EP composites
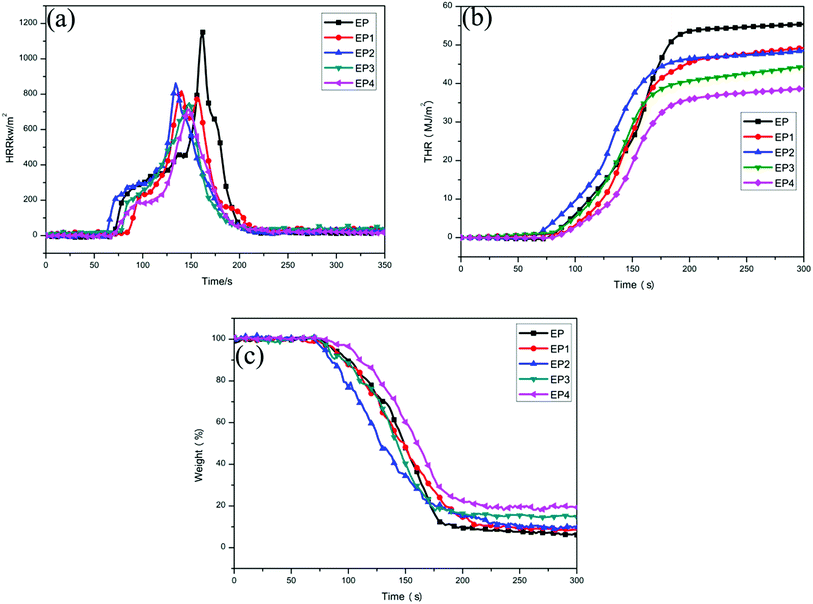
The heat release rate (HRR) curves and total heat release (THR) curves of neat EP and EP composites are shown in Fig. 7a and b, and the specific data are listed in Table 3. It can be seen from Fig. 7a, the peak heat release rate (PHRR) of neat EP can reach 1150 kW m−2, indicating that neat EP may burn severely after ignition. Compared with neat EP, the PHRR of EP1 is decreased by 29.0%. This is attributed to a physical barrier effect of the graphene layers. Compared with neat EP, the PHRR of EP2 is decreased by 24.8%. That is mainly because the sheets of LDH and metal oxide produced during the combustion process possess a physical barrier effect which could isolate oxygen and restrain the volatilization of combustible gas during the decomposition process. At the same time, the decomposition of LDH could absorb heat to produce steam which could lower the temperature of the composites and delay the combustion process of the polymer. In addition, the PHRR of EP3 is decreased by 34.8% in comparison with neat EP. It is noted that the PHRR of EP4 is decreased by 37.9% in comparison with neat EP.| Sample | PHRR (kW m−2) | THR (MJ m−2) | Weight (%) | SPR (m2 s−1) | TSP (m2) | LOI (%) |
|---|---|---|---|---|---|---|
| EP | 1150 | 55.5 | 6.2 | 0.80 | 45.8 | 20.5 |
| EP1 | 865 | 48.4 | 9.7 | 0.70 | 33.4 | 22.3 |
| EP2 | 817 | 49.2 | 8.9 | 0.77 | 42.1 | 23.0 |
| EP3 | 750 | 44.4 | 15.0 | 0.62 | 32.9 | 23.5 |
| EP4 | 714 | 38.5 | 19.7 | 0.58 | 28.2 | 24.8 |
It can be seen from Fig. 7b that the THR of neat EP reaches 55.5 MJ m−2. The THR of all the EP composites were reduced to some extent after different flame retardants were added to them. Compared with neat EP, the THR of EP1, EP2, EP3, and EP4 are decreased by 11.4%, 12.8%, 20.0%, and 30.6%, respectively. Among them, the THR of EP4 is decreased most obviously. Compared with EP3, RGO–LDH/P could further promote fire safety of the EP composites. The main reason is that H2PO4− could promote the formation of a char layer with the condensed phase effect, isolating oxygen and preventing the matrix from further combustion. Meanwhile, the radical of PO˙ generated from H2PO4− can capture H˙ or HO˙ during the combustion process, reducing the spread of flame and improving the flame retardancy of composite materials.32
Fig. 7c shows the weight loss curves of neat EP and EP composites during combustion. The specific data are listed in Table 3. It can be seen from Fig. 7c that the char residue of neat EP after 300 s of burning is 6.2%. Compared with neat EP, the char residue of all EP composites was increased by varying degrees. The char residue of EP4 is produced most obviously, reaching 19.7% and this is attributed to the fact that graphene and LDH could enhance production of the char residue.33,34 Meanwhile, H2PO4− could promote the formation of a char layer, preventing the matrix from further combustion, thereby improving the char residue ratio of composites.
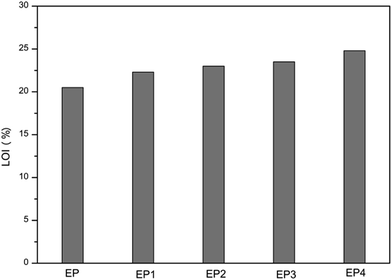
The limiting oxygen index (LOI) is the minimum oxygen concentration (volume percent) capable of supporting combustion of a material. As shown in Fig. 8, and specifically in Table 3, the LOI value of neat EP is 20.5%, showing that combustion is easy for neat EP in air. Compared with EP, the LOI values of all composites increased by varying degrees. It can be observed that the LOI value of EP4 is the highest, up to 24.8%, indicating that RGO–LDH/P has the best level of flame retardancy.
3.4 Smoke suppressing of EP composites
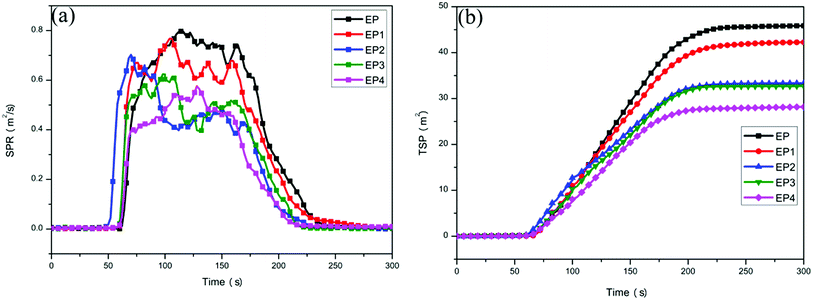
The smoke density curves of neat EP and its composites are displayed in Fig. 9 and the specific data are shown in Table 3. It can be seen from Fig. 9a that the maximum value of EP's smoke production rate (SPR) can reach up to 0.80 m2 s−1, indicating that neat EP can release a large amount of smoke quickly during the combustion process. The SPR declines in various degrees after adding different flame retardants. Compared with EP, the SPR of EP1 is slightly reduced from the physical barrier effect of the graphene layer. The SPR of EP2 is decreased by 12.5%, compared with EP. This is due mainly to the physical barrier effect of LDH, and a larger specific surface area of metal oxide generated from LDH, which can better adsorb smoke and inhibit its spread.35 In addition, compared with EP, the SPR of EP3 is deceased by 22.5% and it is worth noting that the SPR of EP4 is deceased more than that of EP3, reaching 27.5%, compared with EP.It can be observed from Fig. 9b that the total smoke production (TSP) of EP is 45.8 m2. With the addition of different flame retardants, the TSP of the composites are similar to the changes of SPR. Compared with EP, the TSP of EP1, EP2, EP3, and EP4 are deceased by 27.1%, 8.1%, 28.2%, and 38.4%, respectively. It is obvious that the decreasing range of EP4 is the largest. Compared with EP3, RGO–LDH/P can further improve smoke suppression performance of the composites, mainly due to the fact that H2PO4− can promote the formation of a char layer, which inhibits the further decomposition of materials and decreases the release of smoke during combustion. These results show that RGO–LDH/P has a better smoke suppressing effect.
3.5 Char residue analysis for EP composites
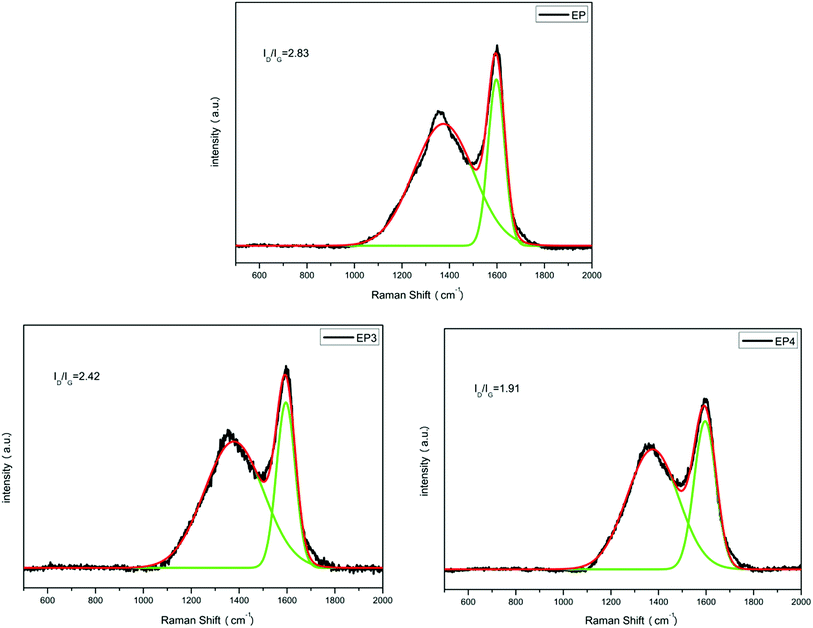
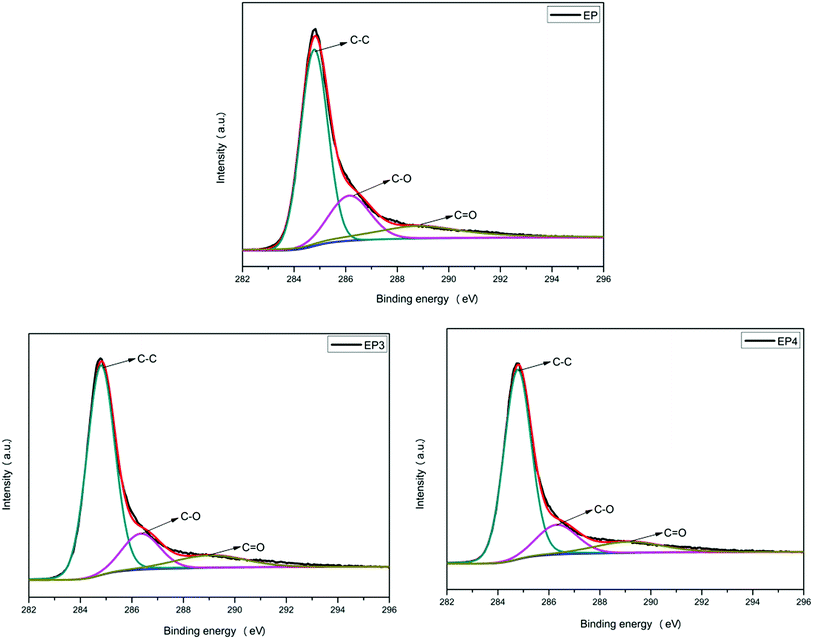
Raman spectroscopy was used to characterize the structure of composites because it can provide important information for the mechanism analysis of flame retardancy effects. The Raman spectra of EP, EP3, and EP4 char residue are shown in Fig. 10. Nearly all the Raman spectra have two strong absorptions at 1366 and 1597 cm−1, corresponding to D and G bands, respectively. In general, the area ratio of D and G bands (ID/IG) can represent the graphitization degree of char residue. Briefly, the smaller the ID/IG ratio is, the higher the graphitization degree of a char layer is.36 As shown in Fig. 10, the ID/IG ratio of EP char is 2.83. Compared with EP, the ID/IG ratio of EP3 decreased to 2.42 with 2 wt% RGO–LDH added, as the content of graphite carbon is increased with the introduction of graphene, and metal oxides from the products of LDH in the decomposition process can promote carbonization. In addition, after adding 2 wt% RGO–LDH/P, the ID/IG ratio of EP4 char is decreased further, reaching 1.91. The content of graphite carbon increases, indicating greater stability and densification of the char layer. Also, it can hinder the transmission of heat effectively, isolating oxygen, suppressing the volatilization of flammable and poisonous gases, and delaying the degradation of materials, thereby improving the flame retardancy and smoke suppression of the composites.XPS was used to further analyze the char layer data of EP, EP3, and EP4 obtained by the cone calorimeter. The C1s spectra of all samples are presented in Fig. 11, and the specific data are listed in Table 4. The C1s spectrum of the char layer exhibits three peaks at 284.6, 286.8, and 288.4 eV, corresponding to the structure of aliphatic and aromatic carbon atoms (C–C, C–H), carbon atom of ether or hydroxyl (C–O), and the carbonyl carbon atoms (C![[double bond, length as m-dash]](https://www.rsc.org/images/entities/char_e001.gif) O), respectively.37 The thermal oxidative resistance of char residue was investigated by calculating the values of Cox/Ca. Among them, Ca represents the contents of carbon atoms with non-oxidation state (C–C, C–H), and Cox represents the contents of carbon atoms (C–O, C
O), respectively.37 The thermal oxidative resistance of char residue was investigated by calculating the values of Cox/Ca. Among them, Ca represents the contents of carbon atoms with non-oxidation state (C–C, C–H), and Cox represents the contents of carbon atoms (C–O, C![[double bond, length as m-dash]](https://www.rsc.org/images/entities/char_e001.gif) O) with oxidation state. Typically, the lower the value of Cox/Ca, the higher thermal oxidation resistance of the char layer.38 The Cox/Ca value of neat EP char residue is 0.65. After RGO–LDH is added, the Cox/Ca value of EP3 char decreased to 0.55, compared with EP. Moreover, the Cox/Ca value of EP4 char is further decreased to 0.39 with the adding of RGO–LDH/P. Results show that RGO–LDH/P could improve the thermal oxidation resistance of char residue effectively, which further proves that RGO–LDH/P performs better in flame retardancy and smoke suppression.
O) with oxidation state. Typically, the lower the value of Cox/Ca, the higher thermal oxidation resistance of the char layer.38 The Cox/Ca value of neat EP char residue is 0.65. After RGO–LDH is added, the Cox/Ca value of EP3 char decreased to 0.55, compared with EP. Moreover, the Cox/Ca value of EP4 char is further decreased to 0.39 with the adding of RGO–LDH/P. Results show that RGO–LDH/P could improve the thermal oxidation resistance of char residue effectively, which further proves that RGO–LDH/P performs better in flame retardancy and smoke suppression.
| Sample | C–C area (%) | C–O area (%) | C![[double bond, length as m-dash]](https://www.rsc.org/images/entities/char_e001.gif) O area (%) O area (%) |
Cox/Ca |
|---|---|---|---|---|
| EP | 60.8 | 21.8 | 17.4 | 0.65 |
| EP3 | 64.7 | 18.4 | 16.9 | 0.55 |
| EP4 | 72.2 | 16.6 | 11.2 | 0.39 |
The O1s and P2p spectra of EP and EP4 char residue are shown in Fig. 12. It can be observed from the O1s spectra that the peaks at 532.9, 531.7, and 530.6 eV correspond to the binding energy of C–O–C, P–O–C, C![[double bond, length as m-dash]](https://www.rsc.org/images/entities/char_e001.gif) O, P
O, P![[double bond, length as m-dash]](https://www.rsc.org/images/entities/char_e001.gif) O, and M–O–M respectively.18,39 As shown in the P2p spectrum, a peak can be found at 134.2 eV, which belongs to the binding energy of –P(
O, and M–O–M respectively.18,39 As shown in the P2p spectrum, a peak can be found at 134.2 eV, which belongs to the binding energy of –P(![[double bond, length as m-dash]](https://www.rsc.org/images/entities/char_e001.gif) O)–O–C–.40 Results show that H2PO4− could generate the cross-linked structure of –P(
O)–O–C–.40 Results show that H2PO4− could generate the cross-linked structure of –P(![[double bond, length as m-dash]](https://www.rsc.org/images/entities/char_e001.gif) O)–O–C– during the combustion process. This can promote carbonization and raise the density of the char layers, improving the flame retardancy and smoke suppression of the composites.
O)–O–C– during the combustion process. This can promote carbonization and raise the density of the char layers, improving the flame retardancy and smoke suppression of the composites.
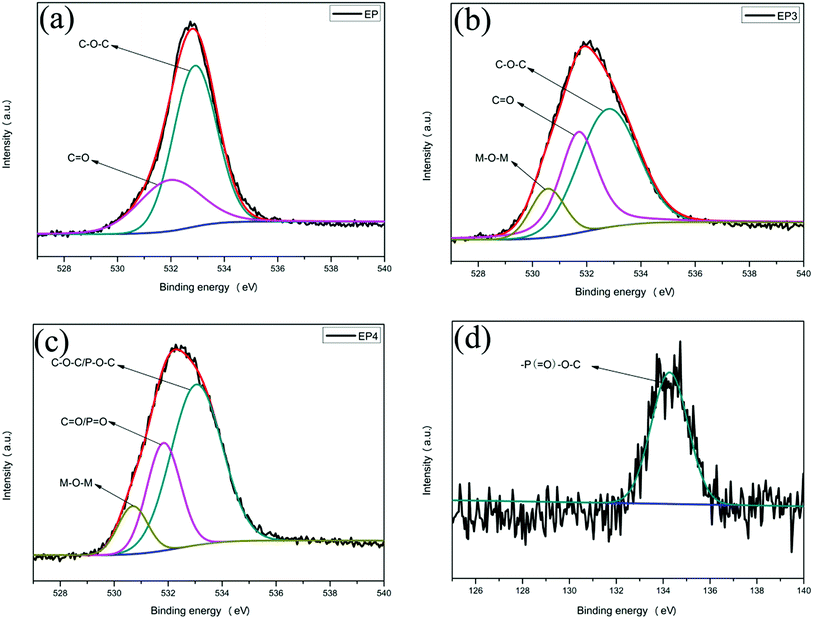 | ||
| Fig. 12 O1s spectra of char residue of EP composites: EP (a), EP3 (b), and EP4 (c); P2p spectrum of EP4 (d). | ||
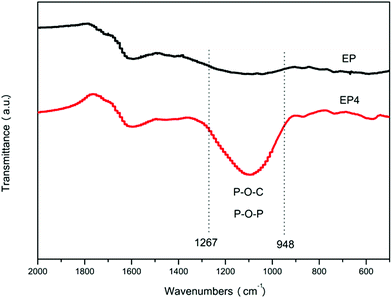
FTIR was used to analyze the char layers of EP and EP4 obtained by the cone calorimeter. As shown in Fig. 13, compared with EP, new broad bands at 1267 and 948 cm−1 can be observed in the spectrum of EP4. These may be attributed to generation of P–O–P and P–O–C during the combustion process.41,42 Results show that H2PO4− could generate the cross-linked structure, raising the density of the char layers, and further improving the flame retardancy and smoke suppression of the composites.
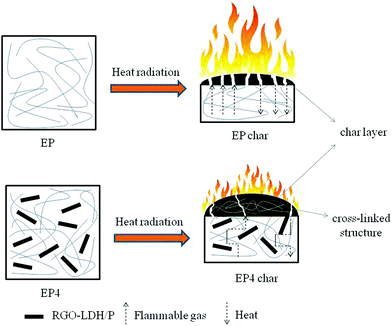
Based on the above studies, a mechanism is illustrated for the flame retarding and smoke suppressing of RGO–LDH/P on EP in Scheme 2. RGO–LDH/P could improve the flame retardancy and smoke suppression of EP, on the one hand, due to the physical barrier effect of graphene and LDH, and the catalytic carbonization effect of LDH. On the other hand, the cross-linked structure of –P(![[double bond, length as m-dash]](https://www.rsc.org/images/entities/char_e001.gif) O)–O–C– and P–O–P generated from H2PO4− during the combustion process could promote carbonization and raise the compactness of the char layer, thus inhibiting volatilization of flammable gases and delaying the transmission of heat. Meanwhile, the radical of PO˙ generated from H2PO4− could capture H˙ or HO˙ during the combustion process and reduce the spread of flame, thereby further improving the flame retardancy and smoke suppression of composites.
O)–O–C– and P–O–P generated from H2PO4− during the combustion process could promote carbonization and raise the compactness of the char layer, thus inhibiting volatilization of flammable gases and delaying the transmission of heat. Meanwhile, the radical of PO˙ generated from H2PO4− could capture H˙ or HO˙ during the combustion process and reduce the spread of flame, thereby further improving the flame retardancy and smoke suppression of composites.
4. Conclusions
In this study, a new type of flame retarding and smoke suppressing agent, RGO–LDH/P, was successfully synthesized. The structure, composition, and morphology of RGO–LDH/P were characterized using XRD, FTIR, and TEM-EDS. The TEM results showed that RGO–LDH/P had good dispersion in EP. RGO–LDH/P was added to EP to study thermal stability, flame retardancy, and smoke suppression of the EP composites. Results showed that RGO–LDH/P could improve the thermal stability of the composites, compared with RGO–LDH. In addition, the charring rate of EP4 was increased significantly at 700 °C. Cone calorimeter test results showed that the PHRR, THR, SPR, and TSP results of EP4 were decreased much more than those of EP3. Meanwhile, LOI test results showed that the LOI value of EP4 was higher than that of EP3. The fire safety performance of the composites was improved due to the physical barrier effect of graphene and LDH, and metal oxide from the products of LDH in the decomposition process hindered the transmission of heat and suppressed the volatilization of flammable and poisonous gases. In addition, the Raman, XPS, and FTIR results showed that the graphitization degree and thermal oxidation resistance were improved. These are attributed to the cross-linked structure of –P(![[double bond, length as m-dash]](https://www.rsc.org/images/entities/char_e001.gif) O)–O–C– and P–O–P generated during the combustion process, which promoted carbonization and raised the compactness of the char layer. Meanwhile, the radical of PO˙ generated from H2PO4− could capture H˙ or HO˙ during the combustion process and reduce the spread of flame, thereby further improving fire safety performance.
O)–O–C– and P–O–P generated during the combustion process, which promoted carbonization and raised the compactness of the char layer. Meanwhile, the radical of PO˙ generated from H2PO4− could capture H˙ or HO˙ during the combustion process and reduce the spread of flame, thereby further improving fire safety performance.
Acknowledgements
The authors are grateful to the Anhui Provincial Natural Science Foundation (1708085ME113) and National Key Technology R&D Program (2013BAJ01B05) for their financial support.References
- Y. Qiu, L. J. Qian and W. Xi, RSC Adv., 2016, 6, 56018–56027 RSC.
- L. J. Cui, H. Z. Geng, W. Y. Wang, L. T. Chen and J. Gao, Carbon, 2013, 54, 277–282 CrossRef CAS.
- K. Q. Zhou, J. J. Liu, Y. Q. Shi, S. H. Jiang, D. Wang, Y. Hu and Z. Gui, ACS Appl. Mater. Interfaces, 2015, 7, 6070–6081 CAS.
- E. N. Kalali, X. Wang and D. Y. Wang, J. Mater. Chem. A, 2015, 3, 6819–6826 CAS.
- Q. Q. Luo, Y. C. Yuan, C. L. Dong, S. Liu and J. Q. Zhao, RSC Adv., 2015, 5, 68476–68484 RSC.
- K. Q. Zhou, Q. J. Zhang, J. J. Liu, B. Wang, S. H. Jiang, Y. Q. Shi, Y. Hu and Z. Gui, RSC Adv., 2014, 4, 13205–13214 RSC.
- X. Wang, L. Song, H. Y. Yang, H. D. Lu and Y. Hu, Ind. Eng. Chem. Res., 2011, 50, 5376–5383 CrossRef CAS.
- P. G. Song, Y. Shen, B. X. Du, Z. H. Guo and Z. P. Fang, Nanoscale, 2009, 1, 118–121 RSC.
- R. Horrocks, A. Sitpalan, C. Zhou and B. K. Kandola, Polymers, 2016, 8, 1–17 CrossRef.
- X. Wang, E. N. Kalali and D. Y. Wang, ACS Sustainable Chem. Eng., 2015, 3, 3281–3290 CrossRef CAS.
- S. Liu, Z. P. Fang, H. Q. Yan and H. Wang, RSC Adv., 2016, 6, 5288–5292 RSC.
- X. Zhang, J. X. Zhu, C. S. Tiwary, Z. Y. Ma, H. J. Huang, J. F. Zhang, Z. Y. Lu, W. Huang and Y. P. Wu, ACS Appl. Mater. Interfaces, 2016, 8, 10858–10865 CAS.
- B. Yu, Y. Q. Shi, B. H. Yuan, S. L. Qiu, W. Y. Xing, W. Z. Hu, L. Song, S. Lo and Y. Hu, J. Mater. Chem. A, 2015, 3, 8034–8044 CAS.
- N. N. Hong, L. Song, T. R. Hull, A. A. Stec, B. B. Wang, Y. Pan and Y. Hu, Mater. Chem. Phys., 2013, 142, 531–538 CrossRef CAS.
- W. Z. Xu, L. Liu, B. L. Zhang, Y. Hu and B. L. Xu, Ind. Eng. Chem. Res., 2016, 55, 4930–4941 CrossRef CAS.
- F. Wu, D. L. Chen, M. X. Sun and M. Y. Wang, Graphene, 2013, 1, 120–123 CrossRef.
- K. KaulP, J. SamsonA, G. T. Selvan, I. Enoch and P. M. Selvakumar, Appl. Clay Sci., 2017, 135, 234–243 CrossRef.
- W. Z. Xu, S. Q. Wang, L. Liu and Y. Hu, Polym. Adv. Technol., 2016, 27, 250–257 CrossRef CAS.
- Q. Wang, J. P. Undrell, Y. S. Gao, G. P. Cai, J. C. Buffet, C. A. Wilkie and D. O'Hare, Macromolecules, 2013, 46, 6145–6150 CrossRef CAS.
- E. N. Kalali, X. Wang and D. Y. Wang, J. Mater. Chem. A, 2016, 4, 2147–2157 CAS.
- M. Shabanian, N. Basaki, H. A. Khonakdar, S. H. Jafari, K. Hedayati and U. Wagenknecht, Appl. Clay Sci., 2014, 90, 101–108 CrossRef CAS.
- S. Cravanzola, F. Cesano, G. Magnacca, A. Zecchina and D. Scarano, RSC Adv., 2016, 6, 59001–59008 RSC.
- Q. L. He, T. T. Yuan, X. Zhang, X. G. Yan, J. Guo, D. W. Ding, M. A. Khan, D. P. Young, A. Khasanov, Z. P. Luo, J. R. Liu, D. Shen, X. Y. Liu, S. Y. Wei and Z. H. Guo, J. Phys. Chem. C, 2014, 118, 24784–24796 CAS.
- G. H. Weghera, E. R. Viana, G. M. Ribeirob and J. F. Deusa, RSC Adv., 2016, 6, 112864–112869 RSC.
- T. N. Zhou, F. Chen, K. Liu, H. Deng, Q. Zhang, J. W. Feng and Q. Fu, Nanotechnology, 2011, 22, 1–6 Search PubMed.
- S. J. Palmer, R. L. Frost, G. Ayoko and T. Nguyen, J. Raman Spectrosc., 2008, 39, 395–401 CrossRef CAS.
- N. N. Hong, L. Song, B. B. Wang, A. A. Ste, T. R. Hull and J. Zhan, Mater. Res. Bull., 2014, 49, 657–664 CrossRef CAS.
- T. Wen, X. L. Wu, X. L. Tan, X. K. Wang and A. W. Xu, ACS Appl. Mater. Interfaces, 2013, 5, 3304–3311 CAS.
- P. K. Sahoo, H. S. Panda and D. Bahadur, Mater. Chem. Phys., 2013, 142, 106–112 CrossRef CAS.
- D. Wang, K. Q. Zhou, W. Yang, W. Y. Xing, Y. Hu and X. L. Gong, Ind. Eng. Chem. Res., 2013, 52, 17882–17890 CrossRef CAS.
- L. C. Du, B. J. Qu and M. Zhang, Polym. Degrad. Stab., 2007, 92, 497–502 CrossRef CAS.
- S. Q. Huo, J. Wang, S. Yang, J. B. Wang, B. Zhang, B. Zhang, X. Chen and Y. H. Tang, Polym. Degrad. Stab., 2016, 131, 106–113 CrossRef CAS.
- R. H. Pour, M. Soheilmoghaddam, A. Hassan and S. Bourbigot, Polym. Degrad. Stab., 2015, 120, 88–97 CrossRef.
- C. Nyambo and C. A. Wilkie, Polym. Degrad. Stab., 2009, 94, 506–512 CrossRef CAS.
- S. L. Xu, L. X. Zhang, Y. J. Lin, R. S. Li and F. Z. Zhang, J. Phys. Chem. Solids, 2012, 73, 1514–1517 CrossRef CAS.
- S. Y. Yang, W. N. Lin, Y. L. Huang, H. W. Tien, J. Y. Wang, C. C. M. Ma, S. M. Li and Y. S. Wang, Carbon, 2011, 49, 793–803 CrossRef CAS.
- P. G. Liu, W. H. Chen, Y. Liu, S. B. Bai and Q. Wang, Polym. Degrad. Stab., 2014, 109, 261–269 CrossRef CAS.
- S. Bourbigot, M. L. Bras, R. Delobel and L. Gengembre, Appl. Surf. Sci., 1997, 120, 15–29 CrossRef CAS.
- Y. H. Guan, J. Q. Huang, J. C. Yang, Z. B. Shao and Y. Z. Wang, Ind. Eng. Chem. Res., 2015, 54, 3524–3531 CrossRef CAS.
- W. C. Zhang, X. G. Li, H. B. Fan and R. G. Yang, Polym. Degrad. Stab., 2012, 97, 2241–2248 CrossRef CAS.
- S. Yang, J. Wang, S. Q. Huo, M. Wang, J. B. Wang and B. Zhang, Polym. Degrad. Stab., 2016, 131, 89–98 CrossRef.
- S. Q. Huo, J. Wang, S. Yang, J. P Wang, B. Zhang, B. Zhang, X. Chen and Y. H. Tang, Polym. Degrad. Stab., 2016, 131, 106–113 CrossRef CAS.
| This journal is © The Royal Society of Chemistry 2017 |

