 Open Access Article
Creative Commons Attribution 3.0 Unported Licence
Enzyme immobilization on metal oxide semiconductors exploiting amine functionalized layer†
Hojoong Kim and
Jang-Yeon Kwon *
*
School of Integrated Technology, Yonsei Institute of Convergence Technology, Yonsei University, Incheon, 406-840, Korea. E-mail: jangyeon@yonsei.ac.kr
First published on 3rd April 2017
Abstract
The immobilization of glucose oxidase (GOx) on indium-gallium zinc oxide (IGZO) thin films is studied in order to fabricate a high performance biosensor. An amine functionalized layer, using (3-aminopropyl)triethoxysilane (APTES), is employed to support the immobilization and to achieve a qualified silanization layer. Fourier Transform Infrared (FT-IR) Spectroscopy, Atomic Force Microscopy (AFM), and contact angle measurements were performed to analyze the surface characteristics and to investigate a deposition mechanism for APTES with varying concentrations. Finally, GOx is immobilized on the APTES layer to determine how a diverse surface quality influences GOx density, and its enzymatic activity is identified by the detection of the electrical signal from glucose biosensors.
Introduction
Diabetes mellitus is a fast-growing public health problem owing to a sharp global increase in obesity.1,2 Quantitative blood glucose sensing has great clinical importance and can greatly reduce the risks of diabetes mellitus induced heart disease, kidney failure, or blindness.3 Current needle-type glucose sensors have difficulty evaluating sudden glucose level variations and are painful with repeated use. Therefore, noninvasive continuous glucose monitoring has been an attractive technique for future glucose sensors.4 Instead of blood glucose, this method gathers glucose from other bodily fluids such as tears, urine, saliva, etc. However, the glucose concentration in these fluids is low compared to blood. Consequently, sensors require a high sensitivity at low detection limits without any interference.5,6The platform for high sensing properties has been studied in various fields for decades.7–10 Oxide based field-effect transistors (FETs) have relatively good electrical characteristics such as a field-effect mobility over 10 cm2 V−1 s−1, a low temperature process that is compatible with flexible substrates, and transparency.11 This represents that the oxide FETs have a potential for wearable sensor applications. It can also be integrated with other circuits to perform signal processing or display. The interest in the oxide FET biosensors has recently increased in areas for sensing glucose12–14 and the other biochemical molecules.15–17
Fabricating biosensors requires a process for immobilizing biomolecules on a solid surface of the sensor device. Enzymatic detection using glucose oxidase (GOx) immobilization provides a general analytical means to detect glucose concentration by electrochemically interacting with glucose and GOx. The amount of immobilized enzyme directly affects to a sensitivity of the sensor. The enzyme can loss its activity without careful immobilization process, which is related to the sensor's selectivity and stability.18,19 A weak GOx immobilizing strength requires a support layer to enhancing the bonding strength between GOx and the solid surface. In general, silanization with amine group (NH2) terminated organosilanes is widely employed due to the high NH2 group reactivity with a complementary GOx functional group.20 Surface distribution and NH2 morphology are known to be critical factors for GOx immobilization, which is controlled by the silane layer deposition condition. The condition for silanization is mainly varied by the silane concentration used in the reaction solvent, length of reaction time, and reaction environment.21
In this study, prior to fabricating oxide FET sensors, GOx is immobilized on an indium gallium zinc oxide (IGZO) thin film, which is one of the high performance oxide materials especially commercialized in a display field.22 The IGZO FETs can present a multiple application, which is monitoring the glucose level through the human tears and visualizing it on the contact lens. It is an effective example in order to show a circuit integration of the biosensor and display modules. Aminosilane using (3-aminopropyl)triethoxysilane (APTES) is used as a supporting layer for immobilization. The APTES layer formation quality is investigated under varying deposition conditions to determine if it can primarily affect GOx enzyme immobilization.
Experimental methods
IGZO film formation and hydroxylation
IGZO thin film was deposited on a SiO2/Si substrate by the radio frequency (RF) sputtering to 100 nm of thickness. The deposition process sputter power was 100 W with a working pressure maintained at 5 mTorr. The inlet gas partial pressure O2/(Ar + O2) ratio was approximately 14% to obtain IGZO semiconducting properties. A sputter target of IGZO has a molar ratio of In2O3![[thin space (1/6-em)]](https://www.rsc.org/images/entities/char_2009.gif) :
:![[thin space (1/6-em)]](https://www.rsc.org/images/entities/char_2009.gif) Ga2O3
Ga2O3![[thin space (1/6-em)]](https://www.rsc.org/images/entities/char_2009.gif) :
:![[thin space (1/6-em)]](https://www.rsc.org/images/entities/char_2009.gif) ZnO = 1
ZnO = 1![[thin space (1/6-em)]](https://www.rsc.org/images/entities/char_2009.gif) :
:![[thin space (1/6-em)]](https://www.rsc.org/images/entities/char_2009.gif) 1
1![[thin space (1/6-em)]](https://www.rsc.org/images/entities/char_2009.gif) :
:![[thin space (1/6-em)]](https://www.rsc.org/images/entities/char_2009.gif) 1. In order to obtain IGZO surface hydroxylation, oxygen plasma treatment was done on the IGZO film under 100 W plasma power, 400 mTorr of working pressure, and 40 sccm of oxygen flow.
1. In order to obtain IGZO surface hydroxylation, oxygen plasma treatment was done on the IGZO film under 100 W plasma power, 400 mTorr of working pressure, and 40 sccm of oxygen flow.
APTES preparation and deposition
APTES solution was prepared to 1%, 5%, and 17% volume fraction (v/v) concentrations by dissolving APTES (99%, Sigma-Aldrich) in an ethanol solvent. The solution was sonicated for 1 h to disperse APTES molecules in the solvent and stored at room temperature. All plasma treated IGZO samples were immersed in the various APTES concentration solutions from 2 to 17 h for APTES deposition and silanization. In order to remove weakly bonded APTES molecules on IGZO surface, it was rinsed with ethanol solvent and air dried.GOx solution preparation and immobilization
10 mg ml−1 of GOx solution was prepared by mixing a GOx powder (from Aspergillus niger, Sigma-Aldrich) with 0.01 M of phosphate buffered saline (1× PBS, pH: 7.4, Sigma-Aldrich). The solution was drop casted on the APTES treated IGZO films to induce adsorption on the terminal amine functionalized surface. After the immobilization, all samples were washed with PBS solution.Sensor fabrication
A resistor type of electrical sensor was fabricated with the IGZO platform. A 150 nm of Mo electrode was deposited on the IGZO film by sputtering as a contact electrode. For reducing contact resistance between the electrode and semiconductor, the device was annealed at 300 °C for 1 h in air. The IGZO film has an amorphous phase and its composition ratio is not clearly varied to the sputter target.23 Then, poly(methyl methacrylate) (PMMA) layer was spin-coated on the device and patterned with width/length of 600 μm/100 μm exposing only the IGZO surface for the immobilization. It is also for the calculation of sensitivity, and for preventing a leakage current between the electrodes and an aqueous solution. The silanization with varying concentration and the GOx immobilization process were conducted on the exposed IGZO surface. A polydimethylsiloxane (PDMS) was attached on the top of the devices as a solution chamber.Results and discussion
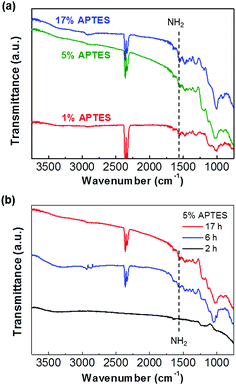
In order to study a variable for APTES film formation and amine activation, APTES was deposited as a function of its concentration and deposition time. First, we varied the APTES solvent concentration with a fixed deposition time. Fig. 1(a) shows the Fourier Transform Infrared Spectroscopy (FT-IR) spectra of 1%, 5%, and 17% APTES deposited on the hydroxylated IGZO surface for 17 h. The IR spectra were measured with Cary 670 FT-IR spectrometer (Agilent) equipped with attenuated total reflection (ATR) accessory. The sample was placed on the crystal plate of ATR and a continuous air was blown into the instrument for reducing humidity. The spectral resolution was 4 cm−1 on the scan ranging from 3750 to 750 cm−1. The two prominent peaks at 2340 and 2360 cm−1 are caused by ambient CO2 and are not related to the sample surfaces.24 The peak identified at 1560 cm−1 is a bending vibration of the NH2 terminal amine group, and Si–O–Si symmetrical stretching vibration is showed at 1040 cm−1. This indicates that the APTES silanization has progressed on the IGZO surface.25 The characteristic silanization peaks are identified at all APTES concentrations and the peak intensity increases as the concentration increases. Fig. 1(b) displays the FT-IR spectra of 5% APTES on the IGZO surface as the deposition time evolves over 2, 6, and 17 h. The intensity of IR peaks significantly increases as deposition time increases from 2 to 6 h, and it becomes saturated at 17 h. During the initial silanization stage, APTES molecules react with the hydroxyl group on the IGZO surface. As the silanization reaction site decreases, the density of amine on the IGZO finally becomes saturated after a sufficient time. On the other hand, the amine group density continuously increases depending upon how many APTES molecules are contained in the solvent. Therefore, it is noted that the APTES layer concentration dominates the total density of the amine terminal group when adequate deposition time is allowed. | ||
| Fig. 1 (a) FT-IR spectra of 1%, 5%, and 17% of the APTES deposited for 17 h and (b) 5% APTES layers as increasing deposition time. | ||
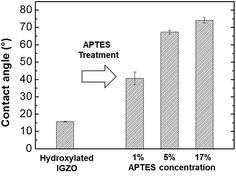
The APTES/IGZO film contact angle was measured to analyze the surface energy of the amino terminated layer. This method offers an indication about the nature of the functional groups present on the uppermost surface layers.26 Static contact angles were measured using the sessile droplet method. 2 μl of deionized water was dropped on the APTES/IGZO surface by automatic syringe and its image was taken within 5 s using the charge coupled device (CCD) video camera of the OCA15plus system. The contact angles were calculated an average of three measurements per specimen. The hydroxylated IGZO contact angle before and after APTES deposition with different concentrations are exhibited in Fig. 2. The measured contact angle before deposition was 15.7°, which has hydrophilic behavior due to the surface OH groups from oxygen plasma treatment. After depositing 1%, 5%, and 17% APTES, they increase to 40.6°, 67.3°, and 74.2°, respectively. The surface energy changed to more hydrophobic after amino terminated surface modification, which was proportional to the APTES concentration. The contact angle of a well-ordered amine group is known to range from 60 to 68°,26,27 indicating that the amino group after 1% APTES treatment is not abundantly deposited on the entire IGZO surface. At more than 5% APTES concentration, the contact angle shows a match for the qualified amine layer and becomes overcrowded at 17%.
 | ||
| Fig. 2 The contact angle measurement on the hydroxylated IGZO surface and on the different concentration ratio of APTES/IGZO layers. | ||
To further analyze APTES layer surface characteristics, the respective APTES concentration sample morphologies were measured by Atomic Force Microscopy (AFM). Their 3D images are shown in Fig. 3. Each image has 10 μm × 10 μm of measuring area and ±5 nm of thickness range. Three images illustrate different surface morphology appearances as the APTES concentration varied. The 1% APTES morphology shows a locally agglomerated ridge and densely populated peaks. This indicates that the APTES molecules do not deposit uniformly on the IGZO film while polymerizing themselves. In the 5% case, the peaks rapidly diminish and the morphology is smoother than the 1% case. On the contrary, the image of 17% reveals extremely populated fine peaks as a result of accelerated polymerization of APTES molecules caused by its high concentration. It is also noted that the RMS roughness of the 1%, 5%, and 17% concentrations were calculated to be 1.212 nm, 0.781 nm, and 1.282 nm, respectively, where of the 5% APTES created the smoothest silanized surface.
 | ||
| Fig. 3 The AFM surface morphologies for the APTES of (a) 1%, (b) 5%, and (c) 17% concentration treated on the IGZO layer. | ||
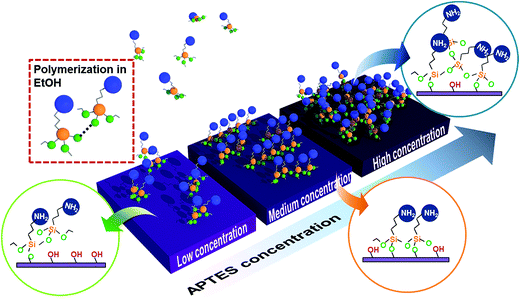
The morphology changes for different APTES concentrations are explained within the silanization process mechanism. General APTES monolayer silanization progressed through the following steps.28 APTES molecules in solvent diffused to the hydroxylated surface and one or two APTES alkoxy groups reacted with the OH surface group. Then additional alkoxy groups are hydrolyzed and establish silanols (Si–OH) such that Si–O–Si networks are linked to another alkoxysilane of APTES molecules. However, we assume that there are three practical APTES process formations depending on concentration. Fig. 4 is a schematic diagram showing how the silanization process varies by the APTES molecule concentration in the solvent. When the concentration is low, silane molecule diffusion time to the IGZO is relatively long so that it could be polymerized in solvent before reaction with the OH group on the surface (red square). This polymerized molecule creates local nucleation and additional diffusion accelerates agglomeration. As the concentration gradually increases, the reaction between silane and the surface OH group becomes faster than the silane polymerization, which forms more uniform silanization surface than the lower APTES concentration. If the silane concentration is overcrowded in the solvent, molecules could more frequently diffuse to the surface and not ensure enough time for silane alignment. This causes a randomly oriented silane polymerization and finally forms a rough surface.
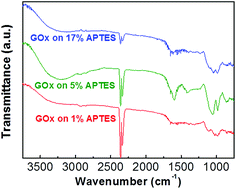
Biomolecule immobilization strength varies depending on the surface quality of the assisted silane layer. In order to confirm the biomolecule immobilization on different quality silanized layers, GOx is attached on the three kinds of APTES treated samples with different concentrations. Fig. 5 shows FT-IR spectra of GOx/APTES/IGZO samples with 1%, 5%, and 17% APTES concentration. The characteristic peaks of GOx are identified on the all samples, which is a broad band of N–H stretching vibration at 3290 cm−1 and an amide bands due to C![[double bond, length as m-dash]](https://www.rsc.org/images/entities/char_e001.gif) O stretching vibration at 1620 cm−1.29 The peaks at 5% APTES have the strongest intensity compared to the others. This means the density of GOx is highest on the 5% APTES/IGZO surface. Therefore, the enzyme immobilization has the most efficiency on the uniform and smooth silanization surface revealed on the 5% APTES layer.
O stretching vibration at 1620 cm−1.29 The peaks at 5% APTES have the strongest intensity compared to the others. This means the density of GOx is highest on the 5% APTES/IGZO surface. Therefore, the enzyme immobilization has the most efficiency on the uniform and smooth silanization surface revealed on the 5% APTES layer.
In this experiment, the NH2 density increases as the APTES concentration increases. However, the highest GOx density after immobilization is not identified on the maximum NH2 density. Contact angle and AFM analysis shows that the 5% APTES surface has a uniformly distributed amino group and smooth morphology of NH2 alignment. In conclusion, the efficiency of GOx immobilization is critically influenced by the exposed NH2 on the surface that is practically available to connect with enzymes. Additionally, the quality of IGZO surface could affect the APTES morphology. The amorphous phase of IGZO film that has relatively low surface roughness (Rq ∼ 0.53 nm) could contribute to the formation of a high quality APTES layer.30
The sensor devices were fabricated and their electric current was measured with a glucose sample for identifying the enzyme activity through the IGZO platform. A glucose solution was prepared by dissolving a glucose powder in the 1× PBS. The electrical signal of devices was measured by a parameter analyzer (4200-SCS, Keithley). Fig. 6(a) shows the electrical signal of the GOx immobilized devices which of 1%, 5%, and 17% APTES layers in the PBS solution (solid lines). The current value of 1% and 5% APTES treated devices is similar level, while it is significantly decreased up to which of 17%. It seems that the highly polymerized and unbounded NH2 group with the GOx can be converted to the NH3+ due to a protonation in the neutral PBS solution. The formation of the positively charged groups on the IGZO surface can introduce acceptor-like surface states so that the electron, a majority carrier in the IGZO, is captured in the trap sites, thereby degrading a conductivity of IGZO film.31 After drop the 1 mM of glucose solution, the current is decreased on the all devices (dashed lines). When the glucose solution is dropped into the solution chamber, the glucose is biocatalytically oxidized, and forms a gluconic acid and hydrogen peroxide in the presence of GOx.1 These products result in acidification at the IGZO/solution interface through proton dissociation. The formation of protons on the IGZO surface can create the trap states; therefore, the conductivity of IGZO is decreased after the enzyme reaction. The reduction currents on the 1%, 5%, and 17% devices are 14.4, 21.4, and 0.1 pA, respectively, which the 5% device shows a higher sensitivity rather than the other devices (Fig. 6(b)). This represents that the immobilization condition is the important factor to achieve the high sensor performances. Fig. 6(c) displays real-time glucose monitoring on the 5% device with dropping the 5 μl of 1 mM glucose repeatedly. The current level drops as the addition of glucose concentration, clearly recognizable after 200 s due to stabilizing the current baseline. Detection sensitivity is calculated to 1.50 nA mM−1 cm−2 and response time until the steady state current is 14 s, which shows the repeatable precision of the sensor. The sensor reproducibility was also evaluated with 1 mM glucose. The relative standard deviation of the sensor response was 0.2% for five measurements after the current stabilization. The electrical response observed for our sensors is comparable to prior studies of metal oxides,32 carbon nanomaterial,33 and polymer types.34 The device sensitivity and stability can be improved with a variation of measurement condition by increasing bias voltage, width/length ratio, and particularly fabricating the FET devices.
Conclusion
An APTES silanization layer was deposited on IGZO thin film for GOx immobilization. The APTES IR spectra and amine group density in the APTES layer was identified by deposition time and concentration. As the silanization deposition progressed, the amine density on the IGZO continuously increased as the APTES molecule concentration increased and became saturated after a sufficient time. Contact angle and AFM analysis showed that the silane concentration in the solvent transformed the APTES layer surface characteristics by varying deposition behavior. It is also revealed that uniform and smooth amino alignment morphology is not related to the total density of the amine group. Consequently, this silanization surface quality is attributed to the GOx immobilization on IGZO film, and it can be identified by the enzymatic detection of the glucose biosensor devices.Acknowledgements
This research was supported by the MSIP (Ministry of Science, ICT and Future Planning), Korea, under the “ICT Consilience Creative Program” (IITP-R0346-16-1008) supervised by the IITP (Institute for Information & communications Technology Promotion).References
- E.-H. Yoo and S.-Y. Lee, Sensors, 2010, 10, 4558–4576 CrossRef PubMed.
- C.-F. So, K.-S. Choi, T. K. S. Wong and J. W. Y. Chung, Med. Devices: Evidence Res., 2012, 5, 45–52 CAS.
- World Health Organization, Global Report on Diabetes, Geneva, 2016 Search PubMed.
- C. E. F. D. Amaral and B. Wolf, Med. Eng. Phys., 2008, 30, 541–549 CrossRef PubMed.
- Q. Yan, B. Peng, G. Su, B. E. Cohan, T. C. Major and M. E. Meyerhoff, Anal. Chem., 2011, 83, 8341–8346 CrossRef CAS PubMed.
- R. Ahmada, N. Tripathya, J. H. Kimb and Y.-B. Hahna, Sens. Actuators, B, 2012, 174, 195–201 CrossRef.
- C. Jianrong, M. Yuqing, H. Nongyue, W. Xiaohua and L. Sijiao, Biotechnol. Adv., 2004, 22, 505–518 CrossRef PubMed.
- N. S. Oliver, C. Toumazou, A. E. G. Cass and D. G. Johnston, Diabetic Med., 2008, 26, 197–210 CrossRef PubMed.
- C. Chen, Q. Xie, D. Yang, H. Xiao, Y. Fu, Y. Tan and S. Yao, RSC Adv., 2013, 3, 4473–4491 RSC.
- J. Parka, H. H. Nguyena, A. Woubitc and M. Kim, Applied Science and Convergence Technology, 2014, 23, 61–71 CrossRef.
- J.-Y. Kwon, D.-J. Lee and K.-B. Kim, Electron. Mater. Lett., 2011, 7, 1–11 CrossRef CAS.
- X.-L. Luo, J.-J. Xu, W. Zhao and H.-Y. Chen, Sens. Actuators, B, 2004, 97, 249–255 CrossRef CAS.
- B. S. Kang, H. T. Wang, F. Ren, S. J. Pearton, T. E. Morey, D. M. Dennis, J. W. Johnson, P. Rajagopal, J. C. Roberts, E. L. Piner and K. J. Linthicum, Appl. Phys. Lett., 2007, 91, 252103 CrossRef.
- X. Du, Y. Li, J. R. Motley, W. F. Stickle and G. S. Herman, ACS Appl. Mater. Interfaces, 2016, 8, 7631–7637 CAS.
- J. Jung, S. J. Kim, D. H. Yoon, B. Kim, S. H. Park and H. J. Kim, ACS Appl. Mater. Interfaces, 2013, 5, 98–102 CAS.
- X. Liua, P. Lina, X. Yana, Z. Kanga, Y. Zhaoa, Y. Lei, C. Li, H. Dub and Y. Zhanga, Sens. Actuators, B, 2013, 176, 22–27 CrossRef.
- Y.-C. Shen, C.-H. Yang, S.-W. Chen, S.-H. Wu, T.-L. Yang and J.-J. Huang, Biosens. Bioelectron., 2014, 54, 306–310 CrossRef CAS PubMed.
- M. Delvaux and S. D-Champagne, Biosens. Bioelectron., 2003, 18, 943–951 CrossRef CAS PubMed.
- R. Ahmad, N. Tripathy and Y.-B. Hahn, Sens. Actuators, B, 2012, 169, 382–386 CrossRef CAS.
- I. Willner and E. Katz, Angew. Chem., Int. Ed., 2000, 39, 1180–1218 CrossRef CAS PubMed.
- S. G. Thakurta and A. Subramanian, Colloids Surf., A, 2012, 414, 384–392 CrossRef.
- T. Arai and Y. Shiraishi, SID Symposium Digest of Technical Papers, 2012, 756–759 CrossRef.
- K. Park, H.-W. Park, H. S. Shin, J. Bae, K.-S. Park, I. Kang, K.-B. Chung and J.-Y. Kwon, IEEE Trans. Electron Devices, 2015, 62, 2900–2905 CrossRef CAS.
- Y. Han, D. Mayer, A. Offenhäusser and S. Ingebrandt, Thin Solid Films, 2006, 501, 175–180 CrossRef.
- E. T. Vandenberg, L. Bertilsson, B. Liedberg, K. Uvdal, R. Erlandsson, H. Elwing and I. Lundström, J. Colloid Interface Sci., 1991, 147, 103–118 CrossRef CAS.
- A. Heise, H. Menzel, H. Yim, M. D. Foster, R. H. Wieringa, A. J. Schouten, V. Erb and M. Stamm, Langmuir, 1997, 13, 723–728 CrossRef CAS.
- J. A. Howarter and J. P. Youngblood, Langmuir, 2006, 22, 11142–11147 CrossRef CAS PubMed.
- S. R. Wasserman, Y.-T. Tao and G. M. Whitesides, Langmuir, 1989, 5, 1074–1087 CrossRef CAS.
- J. L. Blin, C. Gérardin, C. Carteret, L. Rodehüser, C. Selve and M. J. Stébé, Chem. Mater., 2005, 17, 1479–1486 CrossRef CAS.
- N. Tiwari, R. N. Chauhan, P.-T. Liua and H.-P. D. Shieh, RSC Adv., 2015, 5, 51983–51989 RSC.
- J.-S. Park, J. K. Jeong, H.-J. Chung, Y.-G. Mo and H. D. Kim, Appl. Phys. Lett., 2008, 92, 072104 CrossRef.
- X. Liu, P. Lin, X. Yan, Z. Kang, Y. Zhao, Y. Lei, C. Li, H. Du and Y. Zhang, Sens. Actuators, B, 2013, 176, 22–27 CrossRef CAS.
- Y.-C. Tsai, S.-C. Li and J.-M. Chen, Langmuir, 2005, 21, 3653–3658 CrossRef CAS PubMed.
- E. S. Forzan, H. Zhang, L. A. Nagahara, I. Amlani, R. Tsui and N. Tao, Nano Lett., 2004, 4, 1785–1788 CrossRef.
Footnote |
| † Electronic supplementary information (ESI) available. See DOI: 10.1039/c7ra01615h |
| This journal is © The Royal Society of Chemistry 2017 |


