 Open Access Article
Creative Commons Attribution 3.0 Unported Licence
Study on frost heaving characteristics of gravel soil pavement structures of airports in Alpine regions
Jiying Liu *,
Guoping Cen and
Yue Chen
Department of Airfield and Building Engineering, Air Force Engineering University, Xi'an 710038, China. E-mail: liujiying621@163.com
First published on 5th May 2017
Abstract
In order to study frost heaving characteristics of gravel soil pavement structures of airports in alpine regions, we designed a 1![[thin space (1/6-em)]](https://www.rsc.org/images/entities/char_2009.gif) :
:![[thin space (1/6-em)]](https://www.rsc.org/images/entities/char_2009.gif) 10 small pavement structure model to conduct laboratory tests. Temperature, moisture, and frost heaving quantity in pavements were analyzed. Based on laboratory tests, a final element model (FEM) was prepared. Results show that the temperature in our pavement, except for surface temperature, remained unchanged for a period of time at 0 °C. At the same depth, the temperature in a soil surface area was lower. In the process of freezing, moisture in the pavement moved up and towards the soil surface area. At the same depth, moisture content in a soil surface area was higher and moisture content in the upper layer of the soil surface area was the highest. Total frost heaving quantity in the pavement shoulder area was greater than that of the pavement area. Results of laboratory tests and FEM were consistent with those of field tests, suggesting that frost heave models constructed for this paper have reasonable accuracy and reliability. These results can provide theoretical guidance for frost heaving characteristics analysis. Moreover, this paper can help provide optimization designs for airport pavement structures in alpine regions.
10 small pavement structure model to conduct laboratory tests. Temperature, moisture, and frost heaving quantity in pavements were analyzed. Based on laboratory tests, a final element model (FEM) was prepared. Results show that the temperature in our pavement, except for surface temperature, remained unchanged for a period of time at 0 °C. At the same depth, the temperature in a soil surface area was lower. In the process of freezing, moisture in the pavement moved up and towards the soil surface area. At the same depth, moisture content in a soil surface area was higher and moisture content in the upper layer of the soil surface area was the highest. Total frost heaving quantity in the pavement shoulder area was greater than that of the pavement area. Results of laboratory tests and FEM were consistent with those of field tests, suggesting that frost heave models constructed for this paper have reasonable accuracy and reliability. These results can provide theoretical guidance for frost heaving characteristics analysis. Moreover, this paper can help provide optimization designs for airport pavement structures in alpine regions.
1 Introduction
China has a very broad distribution of frozen soil in the “three north” area. The temperature is below zero in this area about two-thirds of the time in any year. In particular, regions like Tibet, Xinjiang, and Qinghai are characterized with low temperature, large frozen depth, long duration, and long retention time of freezing fronts in soil. These characteristics make it easier for soil moisture migration and intensify frost heave.1,2 Previous investigations have shown that frost heaving could cause severe damage to airport pavement structures, especially with those pavements in seasonally frozen regions.3 Therefore, it is essential to study frost heaving characteristics of soil base regarding its application to airport pavements in alpine regions.It has always been a focus and hotspot to conduct research on soil frost heaving characteristics in our project field. Since the pioneering work by Everett4 in 1961, foreign researchers have begun to study soil frost heaving problems. Everett was the first to put forward the Capillary Theory, namely the First Theory of Frost Heaving. Therefore, frost heave and frost heaving forces were quantitatively interpreted and estimated by the First Theory of Frost Heave.5 However, it couldn't explain the inner mechanism that frost heave produced, nor did it pay enough attention to frost heaving forces in fine-particulate soil. Then, Miller6 put forward the Frozen Fringe Theory, known as the Second Theory of Frost Heave. In addition, the Second Theory of Frost Heave explains that there exists a frost heaving free zone with low hydraulic conductivity and low moisture conductivity between the warmest ice lens bottom side and the freezing area. To a certain extent, this frost heaving free zone reveals the mechanism of frost heave.7 Together with the First Theory of Frost Heave, they laid a basis for study of frost heaving problems. Domestic research on frost heaving8 problems started late, though, thanks to large-scale implementation of big frozen soil engineering projects in cold regions, the theory's integrity is continuously inspected in practice and related theories are continuously researched and perfected. Hence, many achievements have been able to keep pace in western countries. Many researchers9–12 have conducted a series of indoor tests on frost heaving of a soil base and analyzed the mechanism of soil frost heaving. However, traditional research projects usually consider that gravel soil13 has unobvious frost heaving due to its large grain size, but feedback from engineering practices have revealed that frost heaving damage to pavement structures on a gravel soil base cannot be ignored. According to relevant investigations, damages from engineering construction, especially airport pavement engineering in gravel land areas located on the Qinghai-Tibet Plateau, are seen commonly due to neglecting frost heaving on gravel soil. Frost heaving with soil bases results in obvious void spaces between pavement and a shoulder.14 Therefore, it is necessary to study frost heaving properties of gravel soil to provide a theoretical basis for airport pavement structure anti-frost heaving designs.15
Considering the characteristics of airport pavement structures in cold regions, we specially designed a small pavement structure model with a scale of 1![[thin space (1/6-em)]](https://www.rsc.org/images/entities/char_2009.gif) :
:![[thin space (1/6-em)]](https://www.rsc.org/images/entities/char_2009.gif) 10 to explore developing laws of temperature, moisture, and frost heaving amounts in a gravel soil base pavement structure. On the basis of those results, we established a finite element model (FEM) of frost heaving characteristics of airport pavement structures in cold regions. Meanwhile, the results of laboratory tests and FEM were compared with those of field tests to verify reliability of the frost heaving models constructed in this paper.
10 to explore developing laws of temperature, moisture, and frost heaving amounts in a gravel soil base pavement structure. On the basis of those results, we established a finite element model (FEM) of frost heaving characteristics of airport pavement structures in cold regions. Meanwhile, the results of laboratory tests and FEM were compared with those of field tests to verify reliability of the frost heaving models constructed in this paper.
2 Mechanism analysis
Researchers from both home and abroad have conducted many studies on soil frost heaving characteristics.16 It is generally believed that the phenomenon of soil frost heaving effects is the result of a comprehensive effect of three elements, i.e., temperature, moisture, and soil.17 Under conditions of negative temperature, moisture in upper layer soil freezes first forming a frozen area, causing expansion of soil volume, and forming a negative pressure in that frozen area.18,19 When soil moisture content is large, moisture in surrounding areas will be supplied continuously to the frozen area by capillary action. As a result, this further helps increase the ice volume, thus forming frost heaving at the soil base. Therefore, as to the soil frost heaving effect,20 temperature is an external condition; moisture is a medium foundation, and soil is an internal factor.To prevent soil frost heaving,21–23 common practices include: reducing soil moisture content, increasing structure layer thickness, and replacing soil susceptible to frost heaving with soil that is less susceptible. Gravel soil itself is generally considered as free from frost heaving. Therefore, it is usually used as soil base construction material in seasonally frozen regions. However, when gravel soil contains a certain amount of fine grained soil, especially silt soil, then frost heaving will still occur. Some experiment data showed that24 fine grained soil and coarse grained soil with >6% grain size less than 0.05 mm are most susceptible to frost heaving deformation. Frost heaving characteristics of gravel soil are closely related to silt and moisture content, although currently there is limited research on this subject.25 In pavement design specifications, thickness of the antifreeze layer of a pavement structure is mainly determined by frozen depth, soil type, and factors such as dry and wet conditions. However, the frost heaving phenomenon can still appear in pavement structures meeting design specifications, especially at the shoulder part, where the frost heaving phenomenon is more serious.
3 Experimental study
3.1 Gravel soil base
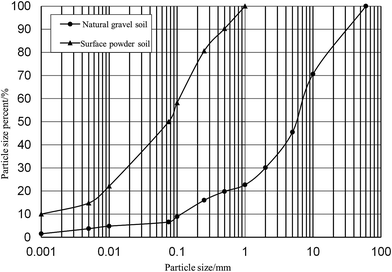
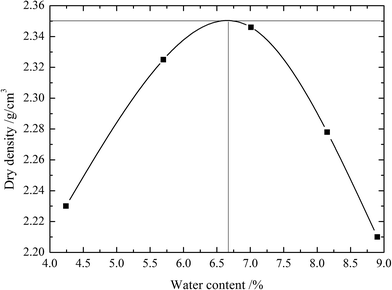
This study used the background of Qinghai Guoluo Airport, where the soil for experiments was taken. The filling section of Guoluo Airport was mainly filled with natural gravel soil, but as usual in a construction process, some surface silt can be mixed in, leading to an uneven distribution of silt content. It is known through experimental analysis that the silt content of surface powder soil is 50%, and that of natural gravel is 6.9%. According to Test Methods of Soils for Highway Engineering JTG E40-2007,26 we conducted a particle analysis test on the two kinds of soil samples collected, i.e., surface powder soil and natural gravel soil. The result is shown in Fig. 1.According to the on-site inspection report, silt content of infillings for most sections varied from 5% to 15%, but for some individual sections it exceeded 20%. This experiment used test gravel soil with silt content of 12% by mixing surface powder soil with natural gravel soil. The specific gravity of both soil samples was measured as 2.71 by a pycnometer (fine gravel soil) and a jar (natural gravel soil), indicating that the influence of grain composition on specific gravity is very limited. In accordance with the Test Methods of Soils for Highway Engineering JTG E40-2007,27 a standard compaction test was carried out on the test gravel soil. As a result, a compaction curve was obtained, as shown in Fig. 2. These results show that the maximum dry density of the test gravel soil was 2.35 g cm−1, and the optimum moisture content was 6.72%.
3.2 Laboratory test
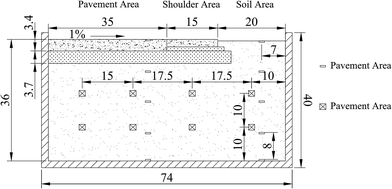
To study frost heave characteristics of airport pavement structures and shoulder lateral seepage situations with a gravel soil base in cold regions, our team used Guoluo28 Airport as a prototype. In addition, we specially designed/processed a pavement/shoulder frost heaving model test chamber; its schematic diagram is shown in Fig. 3. The test chamber is made of 2 cm thick organic glass with a ratio of 1![[thin space (1/6-em)]](https://www.rsc.org/images/entities/char_2009.gif) :
:![[thin space (1/6-em)]](https://www.rsc.org/images/entities/char_2009.gif) 10. It has a clear width of 20 cm, clear height of 38 cm, and clear length of 70 cm. The test chamber is initially filled with gravel soil and then covered with pavement and shoulders with the pavement area measuring 35 cm, shoulder area measuring 15 cm, and soil surface area measuring 20 cm. The pavement structure layer includes 3.4 cm of pavement surface and 3.7 cm of water stabilization base, while the road shoulder includes 1.4 cm of surface layer and 5.7 cm of water stabilization base.
10. It has a clear width of 20 cm, clear height of 38 cm, and clear length of 70 cm. The test chamber is initially filled with gravel soil and then covered with pavement and shoulders with the pavement area measuring 35 cm, shoulder area measuring 15 cm, and soil surface area measuring 20 cm. The pavement structure layer includes 3.4 cm of pavement surface and 3.7 cm of water stabilization base, while the road shoulder includes 1.4 cm of surface layer and 5.7 cm of water stabilization base.
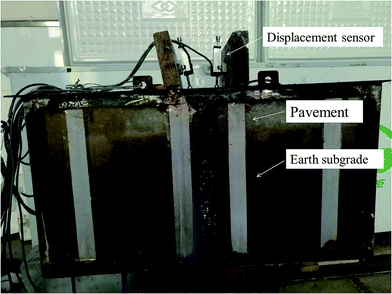
The frost heaving ratio test chamber for a pavement structure is processed as follows: (1) prepare test gravel soil by mixing surface powder soil with natural gravel soil, make the silt content as 12%, and the mass moisture content as 6.74% (slightly higher than the optimum moisture content). Then, seal the mixture in a plastic bag for 24 hours to enable the moisture to be evenly distributed in the test soil. (2) Place the cured test soil sample into the test box layer by layer, (5 cm for each) and compact the soil to reach a 95% compactness. While doing this, bury moisture sensors and temperature sensors, prepared in advance, into the test soil as shown in Fig. 4. The output current signal of the sensor is collected by a data acquisition card and input to a computer for automatic recording. (3) Pour a water-stable base upon completion of soil filling; make the base thickness 3.7 cm and slightly incline it so the soil surface area has a slope of about 1%. (4) Pour pavement with a length of 35 cm and thickness of 3.4 cm. (5) First, pour a shoulder by paving a 18 cm long 2 cm thick water stable base on the shoulder, and then pour a 15 cm long, 1.4 cm thick surface layer. (6) After 7 days of maintenance, fill the soil surface area to make it slightly lower than the shoulder. Next, seal with glass glue at the junction of the pavement surface and the organic glass box to prevent the edge from leaking. (7) Start watering. In order to ensure a certain degree of compaction, the initial mass moisture content during compaction should be near optimum moisture content. Add water three times after compaction, the average mass water content rate of sandy gravel soil can be reached about 10% (the corresponding volumetric moisture content is 19.2%). (8) Wrap the test box with an 8 cm thick insulation board at both bottom and outside, then place it in a freezer. Install two displacement sensors on the pavement and shoulder. The output voltage signals of these sensors are collected by a data acquisition card and then transferred to a computer for automatic recording. (9) Observe moisture sensor readings after internal water distribution of the gravel soil layer becomes uniform. At the same time, turn on the freezer to keep the temperature at +5 °C. Apply constant temperature treatment on the test box and observe temperature sensor readings. When the internal temperature distribution becomes uniform +5 °C, set the freezing temperature to −7 °C. While freezing, record data from the moisture sensor, temperature sensor, and displacement sensor at the same time. (10) When most of the soil is frozen, turn off the freezer to enable the temperature to slowly rise; observe changes in temperature, soil moisture, and displacement in the melting process of the soil base. After melting is complete, take the test box out and remove the pavement and foundation. Then, take a soil sample for moisture content measurement and compare it with the moisture content measured by a moisture sensor. A picture of a real test box is as shown in Fig. 4.
3.3 Numerical simulation
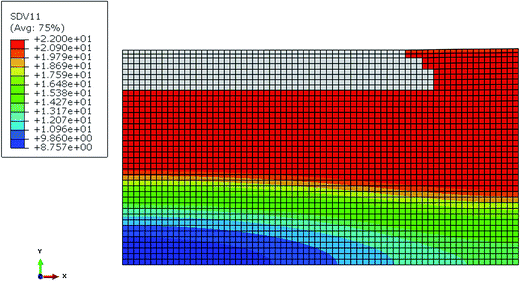
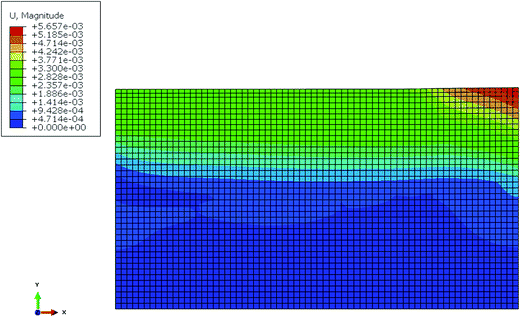
To better guide pavement structure design in cold regions and transfer the indoor test results into a guiding theory based on numerical simulation theory, and by using the pavement/shoulder frost heaving model test as the prototype, a finite element model of frost heaving of airport pavement structure in cold regions was established as shown in Fig. 5. Take the size of the model test chamber as that of the calculation model, which is 38 cm in height and 70 cm in width, divided into concrete structures (brown layer), cement stabilized layer (red layer), and gravel soil layer (grey layer). The finite element model is shown in the figure below.Initial and boundary conditions: set the initial temperature of the pavement structure as 5 °C and the initial mass moisture content of gravel soil as 10% (the corresponding volume moisture content is 19.2%, silt content is 25%, and the density of ice is 900 kg m−3). Use a waterproof and heat insulation boundary condition at the side of the model, with the side as level constraints and bottom as a fixed end constraint. Without considering the influence of underground water, the bottom of the model also uses waterproof and heat insulation boundary conditions. Parameters of each structure layer are listed in Table 1.29
| Structure layer | Elastic modulus/MPa | Poisson's ratio | Density/kg m−3 | Thermal conductivity/W (m K−1) | Volumetric heat capacity/kJ (m3 K)−1 | Mass heat capacity/J (kg K)−1 |
|---|---|---|---|---|---|---|
| Concrete pavement | 30![[thin space (1/6-em)]](https://www.rsc.org/images/entities/char_2009.gif) 000 000 |
0.167 | 2400 | 1.58 | 2410 | 1004 |
| Cement stabilized layer | 1400 | 0.186 | 2250 | 1.36 | 2560 | 1191 |
| Gravel soil layer | 160 | 0.212 | 1920 | 1.63 | 2595 | 1356 |
4 Results analysis
4.1 Analysis of temperature change
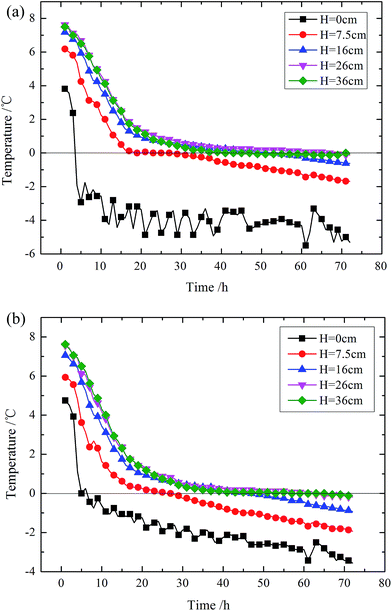
It can be seen from Fig. 6 that temperature change patterns of the pavement surface area and soil surface area are similar; the temperature decreasing rate is high when the temperature is above 0 °C and it reduces and becomes gentle after the temperature reaches 0 °C. With an increase of depth, the temperature decreasing rate becomes smaller. Note that the temperature of the upper layer is lower than that of the lower layer; the main reason is that low temperature transfers from the top down. Except for the H = 0 cm depth, each of the other layers has a transition zone at 0 °C because when the soil temperature reaches 0 °C, then soil water began to freeze and emit heat at the same time; hence the temperature can be maintained at about 0 °C for quite a long time. But the situation is different at the position H = 0 cm; at H = 0 cm, the temperature sensor contacts directly with air. When the temperature reaches around 0 °C, the temperature detected by sensor at H = 0 cm continues to drop along with the environmental temperature. The temperatures at H = 26 cm and H = 36 cm are relatively close; this mainly resulted from limited thickness of the insulating layer of the test device, making the temperature sensor in the bottom layer very susceptible to the environmental temperature. There are certain fluctuations in temperature change of a pavement surface area and soil surface area at H = 0 cm. Temperature fluctuation of the pavement surface area is more intensive because surface temperature of the pavement structure is easily influenced by the environmental temperature inside the refrigerator; a slight change of refrigerator temperature can result in a surface temperature change of the pavement structure. Pavement surface is more sensitive to temperature changes than soil surface.
It can also be seen that the temperature of the soil surface area is lower than that of the pavement surface area at the same time and depth (H = 0 cm is excluded). A completely frozen soil base is indicated when it is frozen for 72 h (3 d) and temperature of all measuring points drop to below 0 °C.
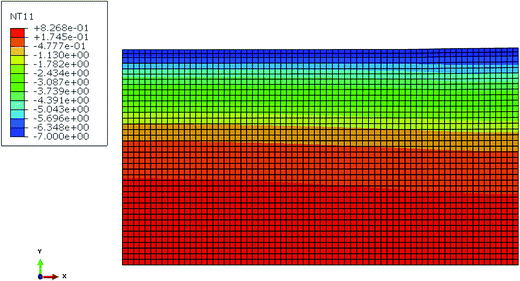
Fig. 7 shows that after freezing for 72 h, the temperature gradient of the pavement surface area is smaller than that of the soil surface area, which is consistent with laboratory test results. Results are influenced primarily by two factors. On one hand, due to thermal conductivity of the concrete pavement and cement stabilized base being smaller than that of the gravel soil layer, the effective depth of low temperature is deeper in the soil surface area than in the pavement surface area due to a heat conduction effect. On the other hand, as the concrete pavement and cement stabilized base have some thermal insulation effect on the gravel soil base, the rate of temperature decreasing of the pavement surface area is slower.
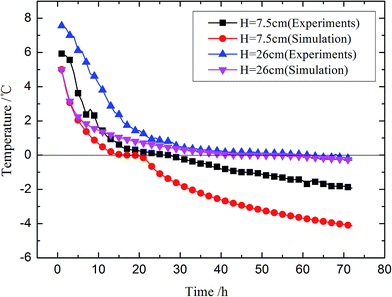
Results from the laboratory test and numerical simulation in Fig. 8 are basically the same. When the temperature is above 0 °C, the decreasing temperature rate is quite fast; when it reaches 0 °C, the temperature change is observed with a transient period and then remains unchanged at 0 °C. However, when it is below 0 °C, then the decreasing temperature rate is obviously slower than that the rate above 0 °C. The results of our laboratory test and numerical simulation at H = 26 cm are relatively close. But at H = 7.5 cm there are some differences because H = 7.5 cm is located in a negative temperature zone. One cause of these differences may be nonuniformity of gravel soil; another cause may be that the parameters of gravel soil have a certain relation with temperature but they are considered as constant values in the numerical simulation. These could explain observed differences between the laboratory test and numerical simulation.
4.2 Analysis of moisture change
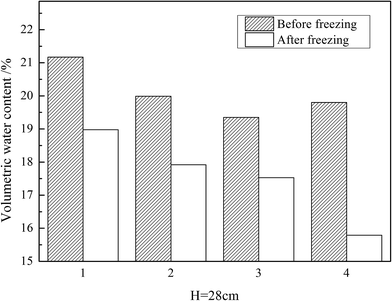
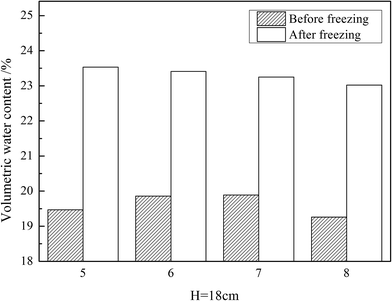
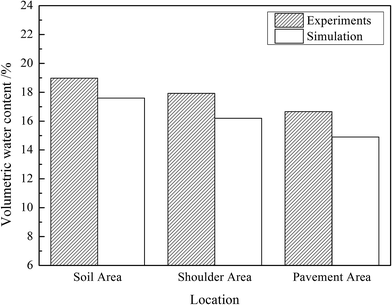
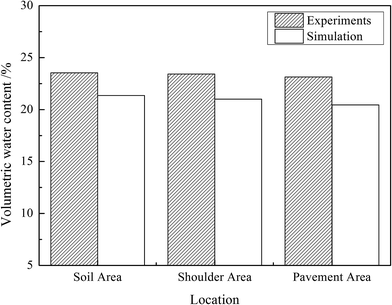
From Fig. 9 and 10, it can be seen clearly that the volumetric moisture content decreases at H = 28 cm after being frozen but then increases at H = 18 cm, which means that internal moisture in the deep position of the pavement structure has migrated to a less deep position. At H = 28 cm, the moisture content detected by sensor No. 1, located at the soil surface area, decreased the least. However, with H = 18 cm, the moisture content detected by sensor No. 1, located at the soil surface area, increased the most. This fact primarily is caused by a freezing effect which drives the soil moisture transferring it to the frozen zone. In addition, it is known from temperature change analysis that the temperature gradient in a soil surface area is greater than that in other areas. As a result, at the same depth soil in the soil surface area gets frozen first. Therefore, in the soil surface area there exists not only moisture transfer in the vertical direction, but also in the horizontal direction.
4.3 Analysis of frost heaving amounts
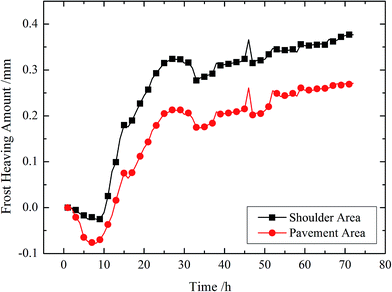
Fig. 14 shows that the change trends of frost heaving amounts at the pavement and shoulder are basically the same, with a little shrinkage in the beginning followed by a rapid growth and then gradually becoming stable. The reason for initial shrinkage primarily lies with the shrinkage property of freshly poured concrete and the sinking of a freshly poured pavement surface plate. Moreover, the later rapid growth is mainly caused by the freezing of moisture in the soil, which leads to soil volume increase. It later becomes stable because almost all moisture in the soil freezes into ice crystals; hence, moisture migration then is basically stopped.
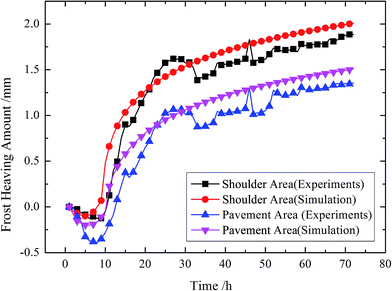
It can also be seen that the total frost heaving amount of the shoulder is greater than that of the pavement; after being frozen for 72 h, the total frost heaving amount of the shoulder was 1.9 mm, while at the pavement it was 1.35 mm (the difference is 0.55 mm). This difference is reflected in actual freezing damage manifested as a certain dislocation between the shoulder and the pavement surface. If it is calculated on a 1![[thin space (1/6-em)]](https://www.rsc.org/images/entities/char_2009.gif) :
:![[thin space (1/6-em)]](https://www.rsc.org/images/entities/char_2009.gif) 10 ratio basis, the actual frost heaving amounts of the shoulder and the pavement are 19 mm and 13.5 mm, respectively. As the soil moisture content in this test is small, and there is no external moisture supplemented, the frost heaving amount is not large. But, if the soil moisture content increases or if there is underground water for supplementation, then the frost heaving amount will become much greater.
10 ratio basis, the actual frost heaving amounts of the shoulder and the pavement are 19 mm and 13.5 mm, respectively. As the soil moisture content in this test is small, and there is no external moisture supplemented, the frost heaving amount is not large. But, if the soil moisture content increases or if there is underground water for supplementation, then the frost heaving amount will become much greater.
It can be seen from Fig. 16 that the test values and simulation values of the frost heaving amounts have the same trends regarding their change with time. Both initially shrink (i.e., the frost shrink phenomenon), followed by a rapid increase, and then a slow increase until the curves become flat; this is a general trend. Though there is a relatively large fluctuation in the test values due to unstable factors such as voltage and current, the trend of the test values is consistent with that of the simulation values. Numerical simulation results show that the finite element model has a certain reliability in the frost heaving characteristics study of the gravel soil pavement structure. This can provide theoretical guidance for the analysis of frost heaving characteristics and optimizing a design of airport pavement structures in cold regions. Additionally, it can improve the scientific and rationality of designs for airport pavement structures in cold regions.
4.4 Field experiments
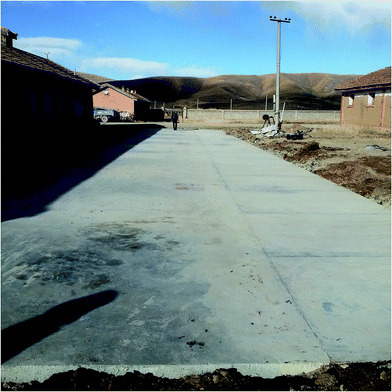
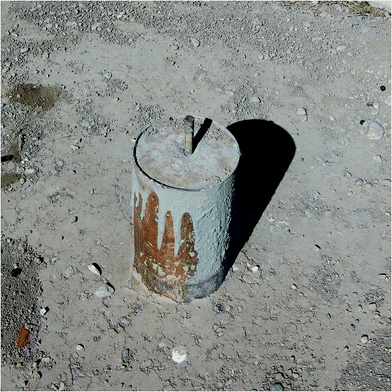
To verify accuracy of the test and simulation models, the airport pavement test section was built by our research group near Guoluo Airport in Qinghai, China. Moreover, the average elevation of Qinghai Guoluo is 4000 meters, and the annual average temperature is minus 4 degrees Celsius and the frozen soil depth of our test section is 5 meters. Qinghai Guoluo, which conforms to the characteristics of the seasonal frozen area in this model, has temperature differences, but without seasonal changes. The test section of the field is shown in Fig. 17 below. Meanwhile, to detect the frost heaving amounts in the test section, a benchmark was built near the test section with a foundation of 6 m, as shown in Fig. 18.After two seasons of cold and warm temperatures, frost heaving of the airport pavement was measured at 10 cm and compared with results from the indoor test model (8 cm) and the simulation model (9 cm); the results are quite close. In conclusion, results show that our established frost heaving model for gravel has a high reliability, and can be used to guide both theoretical research and field construction.
5 Conclusions
To study frost heaving characteristics of gravel soil pavement structures of airports in alpine regions, we specially designed and processed a model of airport pavement structure at 1![[thin space (1/6-em)]](https://www.rsc.org/images/entities/char_2009.gif) :
:![[thin space (1/6-em)]](https://www.rsc.org/images/entities/char_2009.gif) 10 size ratio for laboratory tests. Temperature, moisture, and frost heaving quantity in the pavement were analyzed. Based on laboratory tests, a FEM was set up. The scientific basis of the frost heaving model constructed for this paper was verified by results from the field test. The main conclusions are as follows: temperature increases gradually from the top down inside a pavement structure. When it reaches 0 °C, the temperatures of different areas remain unchanged for a period of time (except for the surface temperatures in each area). In the process of freezing, there are two directions for moisture to transfer, namely upward and towards the soil surface area. Moisture content in the soil surface area is the highest after freezing. The frozen heaving process is divided into three stages: slight shrink, fast frost heaving, and stabilizing. Total frost heaving amounts of a shoulder are greater than that of the pavement. The temperature, moisture, and deformation changes analyzed by the finite element model are basically the same as laboratory test results. According to the field test, the established frost heaving model of the gravel in this paper is highly reliable.
10 size ratio for laboratory tests. Temperature, moisture, and frost heaving quantity in the pavement were analyzed. Based on laboratory tests, a FEM was set up. The scientific basis of the frost heaving model constructed for this paper was verified by results from the field test. The main conclusions are as follows: temperature increases gradually from the top down inside a pavement structure. When it reaches 0 °C, the temperatures of different areas remain unchanged for a period of time (except for the surface temperatures in each area). In the process of freezing, there are two directions for moisture to transfer, namely upward and towards the soil surface area. Moisture content in the soil surface area is the highest after freezing. The frozen heaving process is divided into three stages: slight shrink, fast frost heaving, and stabilizing. Total frost heaving amounts of a shoulder are greater than that of the pavement. The temperature, moisture, and deformation changes analyzed by the finite element model are basically the same as laboratory test results. According to the field test, the established frost heaving model of the gravel in this paper is highly reliable.
Climate change from greenhouse gases eventually will increase the temperature of the atmosphere, which then will affect the frost heaving characteristics of a gravel soil base. In view of this point, we plan to develop our model to make a thorough study of this subject in our next research effort.
Acknowledgements
Projects of Civil Aviation Special Funds for Scientific Research in China (MHRD20140216).References
- X. U. Jian, F. Niu and Y. Niu, et al. Analysis on the Effect of Replacing-Soil Method on Inhibiting Frost Heave of Railway Roadbed in Seasonal Frozen Soil Region, China Railw. Sci., 2011, 32(5), 1–7 Search PubMed.
- G. P. Cen, X. Y. Long and G. Hong, Frost heaving properties of gravel soil in seasonal frozen region of Qinghai-Tibet Plateau, J. Harbin Inst. Technol., 2016, 48(3), 53–59 Search PubMed.
- S. A. Shoop and K. S. Henry, Effect of a geotextile on water migration and frost heave in a large-scale test basin, Transp. Res. Rec., 1991, 1307, 309–318 Search PubMed.
- D. H. Everett, The thermodynamics of frost damage to porous solids, Trans. Faraday Soc., 1961, 57, 1541–1551 RSC.
- S. Takagi, The adsorption force theory of frost heaving, Cold Reg. Sci. Technol., 1980, 3(1), 57–81 CrossRef.
- R. D. Miller, Lens initiation in secondary heaving, Proceedings of the International Symposium on Frost Action in Soils, 1977, vol. 2, pp. 68–74 Search PubMed.
- B. V. Derjaguin and N. V. Churaev, The theory of frost heaving, Prog. Surf. Sci., 1993, 43(1–4), 208–213 CrossRef.
- D. Dashjamts, Research on geotechnical properties of frost heaving soil hazards on foundations in Ulaanbaatar area of Mongolia, International Forum on Strategic Technology, IEEE, 2010, pp. 414–422 Search PubMed.
- L. Shiyin, S. Wenxin and S. Yongping, et al. Glacier changes since the Little Ice Age maximum in the western Qilian Shan, northwest China, and consequences of glacier runoff for water supply, J. Glaciol., 2003, 49(164), 117–124 CrossRef.
- X. B. Chen, Y. Q. Wang and P. He, Frost Susceptibility of Sandy Gravel during Freezing, Chinese Journal of Geotechnical Engineering, 1988, vol. 10(3), pp. 23–29.
- T. L. Wang and Z. R. Yue, Influence of fines content on frost heaving properties of coarse grained soil, Rock Soil Mech., 2013, 34(2), 359–388 Search PubMed.
- D. Y. Wu, Y. M. Lai and Q. G. Ma, Model test study of water and salt migration and deformation characteristics in seasonally frozen soil, Rock Soil Mech., 2016, 37(2), 465–476 Search PubMed.
- M. I. Al-Qinna, M. A. Salahat and Z. N. Shatnawi, Effect of carbonates and gravel contents on hydraulic properties in gravely-calcareous soils, Dirasat: Agricultural Sciences, 2010, 3, 145–158 Search PubMed.
- J. H. Hu, R. Wamg and M. J. Hu, Test and mechanism of horizontal plastic drain in permafrost regions embankment, J. Cent. South Univ. Technol., 2009, 40(5), 1451–1456 Search PubMed.
- S. Tunematsu, K. Soma and Y. Takamori, et al., Studies on the frost protection of pavement structure for forest roadway (I): Frost heaving of subgrade soil in forest roadway, The Boreal Forest Society, 1988, pp. 179–183 Search PubMed.
- R. L. Wang, D. P. Zhu and X. Y. Liu, Assessment method of degradation of pile stability for frozen soil decreasing in cold region, J. Cent. South Univ., 2016, 47(9), 3148–3158 Search PubMed.
- L. I. Anyuan, Y. Niu and F. Niu, Research status of frost heaving properties and controlling measures of coarse grained soil, J Glaciol Geocryol, 2015, 37(1), 202–210 Search PubMed.
- N. I. Osokin, R. S. Samoylov and A. V. Sosnovskiy, Model of the influence of snow cover on soil freezing, Ann. Glaciol., 2000, 31(1), 417–421 CrossRef.
- L. C. Rekstad, H. H. Wasmuth and B. Ystgaard, Topical negative-pressure therapy for small bowel leakage in a frozen abdomen: a technical report, J. Trauma Acute Care Surg., 2013, 75(3), 487–491 CrossRef PubMed.
- W. S. Guthrie and R. D. Lay, Effect of reduced cement contents on frost heave of silty soil: laboratory testing and numerical modeling, Transportation Research Board, Meeting, 2007 Search PubMed.
- H. Granholm, Penetration of frost into the soil, with special emphasis on the scope for preventing damage due to frost heave, Frost Heaving Soils, 1971, vol. 13, pp. 83–85 Search PubMed.
- M. D. Chantal, H. Rita and U. Bergsten, Effect of soil properties and soil disturbance on frost heaving of min, Can. J. For. Res., 2006, 36(11), 2885–2893 CrossRef.
- K. Takeda, A. Okamura and J. Nakazawa, et al. Structure for preventing frost heave damage to an underground structure and a method of installing the same, US Pat. 6,309,142[P], 2001-10-30.
- Y. Zhang and R. L. Michalowski, Thermal-hydro-mechanical analysis of frost heave and thaw settlement, J. Geotech. Geoenviron. Eng., 2015, 141(7), 04015027 CrossRef.
- M. T. Hendry, L. U. Onwude and D. C. Sego, A laboratory investigation of the frost heave susceptibility of fine-grained soil generated from the abrasion of a diorite aggregate, Cold Reg. Sci. Technol., 2016, 123, 91–98 CrossRef.
- W. Liu, J. M. Ling and H. D. Zhao, Review and analysis of design methods for asphalt concrete airport pavement, Journal of Civil Aviation University of China, 2006, vol. 24(4), pp. 43–47 Search PubMed.
- J. Liu and L. Zhang, The microstructure characters of saline soil in Qarhan salt lake area and its behaviors of mechanics and compressive strength, Arabian J. Sci. Eng., 2014, 39(12), 8649–8658 CrossRef CAS.
- X. M. Han, H. Wang and H. X. Cai, Epidemiological survey on echinococcosis in Darlag County of Qinghai Province, Zhongguo Ji Sheng Chong Xue Yu Ji Sheng Chong Bing Za Zhi, 2009, 27(1), 22–26 Search PubMed.
- C. L. Wang, Q. Xie and C. X. Jiang, et al. Analysis of thermal characteristics and mechanical properties of salty soil in frozen area of Qinghai-Tibet Railway, Rock Soil Mech., 2009, 30(3), 836–839 Search PubMed.
- R. L. Berg, G. L. Guymon and T. C. Johnson, Mathematical model to correlate frost heave of pavements with laboratory predictions, Cold Regions Research and Engineering Lab, Hanover NH, 1980 Search PubMed.
| This journal is © The Royal Society of Chemistry 2017 |

