 Open Access Article
Creative Commons Attribution 3.0 Unported Licence
The synthesis and characterization of ytterbium-doped TiO2 hollow spheres with enhanced visible-light photocatalytic activity†
Xueliang Jiangab,
Chenjian Lib,
Song Liub,
Fuqing Zhangb,
Feng Youab and
Chu Yao *ab
*ab
aHubei Key Laboratory of Plasma Chemistry and Advanced Materials, China
bCollege of Materials Science and Engineering, Wuhan Institute of Technology, Wuhan 430205, China. E-mail: jiangxl@wit.edu.cn; leechenjian@wit.edu.cn; 201401022@wit.edu.cn; 04002085@wit.edu.cn; youfeng.mse@wit.edu.cn; chuyao@wit.edu.cn; Tel: +86-27-8719-5661
First published on 5th May 2017
Abstract
Using (C16H36O4)Ti and Yb(NO3)3 solutions as raw materials, Yb-doped TiO2 hollow spheres (Yb-TiO2HS) with different doping ratios (Yb![[thin space (1/6-em)]](https://www.rsc.org/images/entities/char_2009.gif) :
:![[thin space (1/6-em)]](https://www.rsc.org/images/entities/char_2009.gif) Ti = 0.5%, 1%, and 1.5%) were successfully fabricated via a sol–gel template method with melamine–formaldehyde polymer microspheres (MF) as templates. The Yb-TiO2HS were characterized by scanning electron microscopy, transmission electron microscopy, X-ray diffraction, specific surface area and porosity analysis, ultraviolet-visible-light diffused reflection spectroscopy (UV-DRS), and luminescence spectroscopy. The Yb-TiO2HS can absorb visible-light and exhibit a lower recombination of electrons (e−) and holes (h+) when compared with commercial P25 TiO2 powder (P25). The photocatalytic activities of the prepared samples were estimated by the degradation process of methyl orange (MO) dye under irradiation with visible-light (λ > 450 nm). With H2O2 and Yb-TiO2HS (Yb
Ti = 0.5%, 1%, and 1.5%) were successfully fabricated via a sol–gel template method with melamine–formaldehyde polymer microspheres (MF) as templates. The Yb-TiO2HS were characterized by scanning electron microscopy, transmission electron microscopy, X-ray diffraction, specific surface area and porosity analysis, ultraviolet-visible-light diffused reflection spectroscopy (UV-DRS), and luminescence spectroscopy. The Yb-TiO2HS can absorb visible-light and exhibit a lower recombination of electrons (e−) and holes (h+) when compared with commercial P25 TiO2 powder (P25). The photocatalytic activities of the prepared samples were estimated by the degradation process of methyl orange (MO) dye under irradiation with visible-light (λ > 450 nm). With H2O2 and Yb-TiO2HS (Yb![[thin space (1/6-em)]](https://www.rsc.org/images/entities/char_2009.gif) :
:![[thin space (1/6-em)]](https://www.rsc.org/images/entities/char_2009.gif) Ti = 1%) as the promoter and photocatalyst, respectively, the degradation ratio of MO achieved a maximum value (89%) after irradiation for 5 h. While excessive Yb doping resulted in a negative effect on the photocatalysis, an appropriate doping ratio restrained the recombination of electron–hole pairs and extended the light absorption range, thus enhancing the ability of the visible-light photocatalysis. Moreover, the addition of H2O2 improved the dye adsorptive activity of TiO2HS, which further enhanced the photocatalytic effect.
Ti = 1%) as the promoter and photocatalyst, respectively, the degradation ratio of MO achieved a maximum value (89%) after irradiation for 5 h. While excessive Yb doping resulted in a negative effect on the photocatalysis, an appropriate doping ratio restrained the recombination of electron–hole pairs and extended the light absorption range, thus enhancing the ability of the visible-light photocatalysis. Moreover, the addition of H2O2 improved the dye adsorptive activity of TiO2HS, which further enhanced the photocatalytic effect.
1. Introduction
Dye wastewater, a pollutant of waters from the dyeing and printing industry, is harmful to the environment and human health. Since the components of this pollutant are difficult to degrade under environmental conditions, numerous researchers are concentrated on this issue for effective solutions.TiO2 has been extensively applied in the field of water purification and environmental protection due to its high photocatalytic efficiency, chemical and optical stability, low-cost, and non-toxicity.1–3 However, due to its wide band-gap energy (3.2 eV)4 and high recombination ratio of electron–hole pairs,5 only 5% solar-light (ultraviolet) can be absorbed and used by TiO2. The low absorption of solar light limits the extension of TiO2 in practical applications. To extend the optical response range and decrease the recombination ratio of electron–hole pairs of TiO2 and thus obtain effective sunlight or visible-light photocatalytic activity, TiO2 was modified using some methods such as element doping. Non-metallic (such as B, N, and C) and metallic (such as Fe and Cr) doping can effectively shorten the width of the band gap and inhibit the recombination of photoinduced electron–hole pairs.6–10
Due to their incompletely filled 4f and empty 5d orbitals,11,12 rare earth elements have been widely applied in the fields of up-conversion and luminescence materials,13,14 catalysis,15 and solar cells.16 Doping TiO2 with rare earth elements not only inhibits the recombination of photoinduced electron–hole pairs in TiO2 due to the special electron orbit structure of lanthanon, but also restrains the transformation of the anatase phase to the rutile phase in the TiO2 lattice and crystalline grain thinning.17–19 Nanostructured Yb3+-doped TiO2 was fabricated by Liu20 and it displayed improved photocatalysis for the degradation of orangeII. Romero17 synthesized a series of rare-earth ion-doped TiO2 powders via a sol–gel method and found that the rare earth ions are positive for the photocatalytic performance because they can inhibit the transformation of the crystalline phase of TiO2 from the anatase to the rutile phase.
Moreover, the photocatalytic activity of TiO2 is also correlated with its morphology and microstructure. Some special structures such as nanorods,20 nanotubes,21 and hollow spheres22 have been reported to efficiently improve the photocatalytic activity of TiO2. Among these, hollow spheres have attracted extensive attention due to their low density and high surface area and thermal stability. Furthermore, the self-light scattering properties of the hollow sphere cavities can improve the availability of sunlight.10,23–26 Recently, many efforts have been applied in the preparation of nano- or micro-sized hollow spheres. A template-directed synthesis using a hard template, such as carbon or polymer spheres,27–29 and soft template, such as gas bubbles,30,31 has been widely applied in the preparation of inorganic hollow spheres due to its higher success rate and facile control of the morphology of the hollow spheres. Melamine–formaldehyde polymer microspheres (MF) have attracted significant attention as a template due to the advantages such as ease of preparation, low-cost, environmentally friendliness, and ease of removal.32,33
In this study, Yb-doped TiO2 hollow spheres (Yb-TiO2HS) were successfully synthesized via a sol–gel method with the assistance of MF templates. The photocatalytic activities were estimated by the degradation of an aqueous solution of methyl orange (MO) under visible-light irradiation.
2. Experimental
2.1 Preparation of MF
First, 9.8 g formaldehyde solution (37%) and 200 mL deionized water were added into a three-necked flask and heated to 80 °C. Then, 2.5 g melamine was dissolved in the solution under constant stirring for prepolymerization. After 20 min, 0.6 mL of a formic acid (pH = 2) solution was introduced into the aforementioned solution, and the resulting mixture was stirred for 40 min. Finally, white MF were obtained by centrifugation, washing the resulting mixture four times with deionized water, and then drying in air at 60 °C.2.2 Synthesis of Yb-TiO2HS
First, 0.2 g of MF was dispersed in 30 mL ethanol (99.9 wt%) by ultrasonication for 30 min in a three-necked flask. Then, 0.05 g of cetyltrimethylammonium bromide (CTAB) was added into the MF dispersion and stirred for 10 min to modify the surface of MF. Next, 0.6027 g of (C16H36O4)Ti (TBOT) was dissolved in 20 mL of ethanol and the resulting solution was added to the MF dispersion. The reaction mixture was heated to 80 °C under magnetic stirring. The Yb(NO3)3 solution (0.07 mol L−1) with different volumes, corresponding the molar ratios of Yb and Ti (Yb![[thin space (1/6-em)]](https://www.rsc.org/images/entities/char_2009.gif) :
:![[thin space (1/6-em)]](https://www.rsc.org/images/entities/char_2009.gif) Ti = 0.5%, 1%, and 1.5%), used as the source of Yb was mixed with 1 mL of deionized water and then added to the reaction system. After stirring at 80 °C for 4 h, the Yb-doped TiO2@MF composite microspheres (Yb-TiO2@MFCS) were obtained by centrifugation and washing three times with ethanol and deionized water, and subsequently, drying at 60 °C. The Yb-TiO2HS samples were obtained after calcining the Yb-TiO2@MFCS samples in air at 500 °C for 2 h (ramped up at 4 °C min−1). The obtained samples with different ratios of Yb doping (Yb
Ti = 0.5%, 1%, and 1.5%), used as the source of Yb was mixed with 1 mL of deionized water and then added to the reaction system. After stirring at 80 °C for 4 h, the Yb-doped TiO2@MF composite microspheres (Yb-TiO2@MFCS) were obtained by centrifugation and washing three times with ethanol and deionized water, and subsequently, drying at 60 °C. The Yb-TiO2HS samples were obtained after calcining the Yb-TiO2@MFCS samples in air at 500 °C for 2 h (ramped up at 4 °C min−1). The obtained samples with different ratios of Yb doping (Yb![[thin space (1/6-em)]](https://www.rsc.org/images/entities/char_2009.gif) :
:![[thin space (1/6-em)]](https://www.rsc.org/images/entities/char_2009.gif) Ti = 0.5%, 1%, and 1.5%) were defined as 0.5–1.5%Yb-TiO2HS. The TiO2@MF composite microspheres (TiO2@MFCS) were synthesized using a similar process, and only 1 mL of deionized water was induced into system of the reaction; TiO2 hollow spheres (TiO2HS) were prepared using a similar calcination process that was used for the preparation of Yb-TiO2HS.
Ti = 0.5%, 1%, and 1.5%) were defined as 0.5–1.5%Yb-TiO2HS. The TiO2@MF composite microspheres (TiO2@MFCS) were synthesized using a similar process, and only 1 mL of deionized water was induced into system of the reaction; TiO2 hollow spheres (TiO2HS) were prepared using a similar calcination process that was used for the preparation of Yb-TiO2HS.
2.3 Characterization of Yb-TiO2HS
The crystal structures of the resulting products were determined using powder X-ray diffraction (XRD, Bruker D8 Advance, Cu-Kα radiation, λ = 0.15418 nm). Fourier transform infrared spectroscopy (FT-IR) was performed via a PerkinElmer Spectrum Two FT-IR Spectrometer using the potassium bromide (KBr) pellet technique. The morphology and structure of the samples were obtained by scanning electron microscopy (SEM, JSM-5510LV) and transmission electron microscopy (TEM, JEOL, JEM-2100, 200 kV). X-ray photoelectron spectroscopy (XPS) was carried out via a KRATOS AXIS-ULTRA DLD-600 W X-ray photoelectron spectrometer using Al-Kα radiation, and the binding energy reference was taken at 284.6 eV for the C 1s peak. The luminescence spectra were obtained using a fluorescence spectrophotometer (Hitachi, F-4600), with an excitation wavelength of 275 nm. Ultraviolet-visible-light diffused reflection spectra (UV-DRS) were obtained using a PerkinElmer lambda 35 UV/VIS spectrometer with an integration sphere using BaSO4 as the reference sample. Nitrogen (N2) adsorption–desorption isotherms and pore size distribution curves were obtained at liquid N2 temperature using a Nova 2000e surface area and pore size analyzer.2.4 Photocatalytic activity measurements
The photocatalytic performance of Yb-TiO2HS was estimated by the degradation of a methyl orange (MO) dye solution with a concentration of 20 mg L−1 under visible-light irradiation. The photocatalytic reaction device was prepared in the laboratory by our group, as shown in Fig. S1.† A 150 W halogen tungsten lamp was used as the light source. A beaker equipped with a UV cut-off filter cutting the light below 450 nm was used as the photoreactor. In each experiment, 0.05 g of sample was ultrasonically dispersed in 50 mL of the MO solution for 10 s. Then, 5 mL of hydrogen peroxide (H2O2), as the promotor, was added to the reaction system under magnetic stirring for 30 min in the dark to achieve an adsorption–desorption equilibrium. Then, the solution was exposed to visible-light irradiation (λ = 450 nm) in the photoreactor under magnetic stirring. At a given irradiation time interval, 5 mL of the suspension was taken out and centrifuged at 8000 rpm for 10 min to separate the dye solution. The concentration (C) of the centrifuged solution and the initial concentration (C0) of the MO solution were represented by the absorbance (A0) and A, respectively, which were obtained using a UV/vis spectrophotometer (PerkinElmer lambda 35 UV/VIS Spectrometer). The degradation rate of MO solution was calculated as 1 − C/C0.3. Results and discussion
3.1 XRD analysis
The XRD patterns of Yb-TiO2HS with different molar ratios of Yb doping after calcination at 500 °C are shown in Fig. 1. All the samples exhibited typical diffraction peaks according to the standard card data of anatase phase TiO2 (JCPDS no. 21-1272). No other peaks were observed, except for a weak peak at 2θ = 30.8° corresponding to the brookite plane (121) of the brookite phase TiO2 in the XRD pattern of 1.5%Yb-TiO2HS. No ytterbium oxide crystalline phase was found most likely due to the low doping ratios used, which was beyond the detection limitation of XRD. When compared with that of TiO2HS, the (101) diffraction peak of Yb-TiO2HS shifted to a high angle region, as shown in Fig. S2.†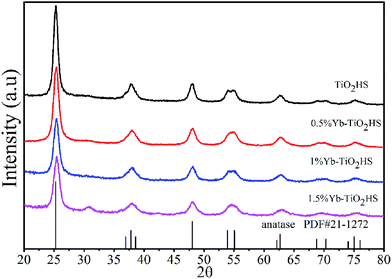 | ||
| Fig. 1 The XRD patterns of TiO2HS and Yb-TiO2HS with different ratios of Yb doping calcined at 500 °C. | ||
The crystalline grain sizes at the anatase diffraction peak (101) were calculated using the Scherrer equation as follows:
 | (1) |
The lattice parameters and the unit cell volumes (V) of the unit cell of the anatase phase for both the doped and undoped TiO2 samples were calculated by the lattice parameter eqn (2) of the tetragonal system and cell volumes formula (3), respectively, The results are presented in Table 1.
 | (2) |
| V = a2c | (3) |
| Samples | a (Å) | c (Å) | V (Å3) |
|---|---|---|---|
| TiO2HS | 3.79181 | 9.50629 | 136.67975 |
| 0.5%Yb-TiO2HS | 3.78068 | 9.47971 | 135.49863 |
| 1%Yb-TiO2HS | 3.7764 | 9.45127 | 134.78642 |
| 1.5%Yb-TiO2HS | 3.75132 | 9.57773 | 134.78166 |
As summarized in Table 1, the volume of the unit cell gradually decreased upon increasing the ratio of Yb3+ doping.
Because the ionic radius of Yb3+ (0.086 nm) is larger than that of Ti4+ (0.068 nm), it is more difficult for Yb3+ to enter into the TiO2 lattice. Yb3+ is preferentially stacked at the grain boundaries and grain junctions. The crystalline grain sizes of Yb-TiO2HS are smaller than those of TiO2HS due to the fact that the doped Yb inhibits the growth of crystalline TiO2 via the formation of a barrier of Yb–O–Ti bonds.
Fig. 2 shows the XRD patterns of 1%Yb-TiO2HS and TiO2HS after calcination at different temperatures. When compared with TiO2HS, the 1%Yb-TiO2HS sample after being calcined at 800 °C exhibited all the diffraction peaks belonging to the anatase phase of TiO2 and the peaks of the rutile phase TiO2 were absent. This phenomenon indicates that Yb doping effectively prevents the phase conversion of TiO2 from the anatase to rutile phase.
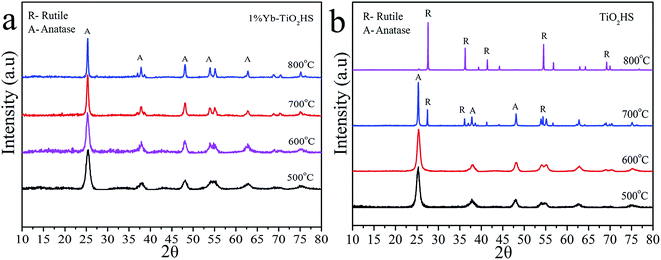 | ||
| Fig. 2 The XRD patterns of 1%Yb-TiO2HS (a) and TiO2HS (b) after calcination at difference temperatures. | ||
3.2 FT-IR analysis
Fig. S4† shows the FT-IR spectra of each sample. As shown in the curve of MF, the absorption peaks at 3361 and 2961 cm−1 are assigned to the vibration of hydroxy/amino (–OH/–NH–) groups. The peaks at 1558, 1494, and 1353 cm−1 are assigned to the vibration of the –NH2 groups and the peaks at 1164, 1007, and 813 cm−1 should be attributed to the C–N, C–O–C, and C–N–C vibrations, respectively. These results indicate that the MF resins were successfully synthsized.33 The FT-IR spectrum of TiO2@MFCS is similar to that of the MF template, except for a decrease in intensity occurred at some peaks such as the peak corresponding to the ether groups (1007 cm−1). This decrease in the peak intensity can be attributed to the coating of the precursor nanoparticles on the surfaces of the MF. As shown in the spectra of TiO2HS and 1%Yb-TiO2HS, the peak at 496 cm−1 is the vibrant absorption peak of Ti–O–Ti34 and the peaks in the range of 3400–3300 cm−1 and around 1630 cm−1 are the absorption peaks of free –OH in water and adsorbed –OH on the surface of TiO2.35 The absorption peaks at 1384 cm−1 and 1317 cm−1 correspond to the symmetrical vibration of COO–.36,37 On comparing the spectrum of 1%Yb-TiO2HS with TiO2HS, it was observed that the FT-IR spectrum of 1%Yb-TiO2HS exhibits stronger absorptions corresponding to –OH on the surface of TiO2 (1636 cm−1). Furthermore, two weak absorption peaks at 1384 cm−1 and 1317 cm−1 corresponding to COO– were observed after Yb doping. These phenomena indicate that the surface active groups of TiO2 increased after Yb doping, which is a result of the formation of Lewis acid–base complexes between ytterbium ions containing f-orbitals in the Yb-TiO2HS and various Lewis bases (such as alcohols, aldehydes, amines, etc.).38–413.3 XPS analysis
Fig. 3 illustrates the XPS results of the 1%Yb-TiO2HS after calcination at 500 °C. As shown in Fig. 3a, the peaks at 530.08 eV, 286.08 eV, 185.21 eV, and 458.78 eV corresponding to O 1s, C 1s, Yb 4d, and Ti 2p, respectively, indicate that the product consists of Ti, Yb, O, and C. The C 1s peak at 286.08 eV was attributed to residual carbon from the calcined MF and adventitious hydrocarbons from the XPS instrument itself. The high-resolution XPS of Ti 2p is shown in Fig. 3b. The peaks at 458.78 eV and at 464.58 eV are assigned to Ti 2p3/2 and Ti 2p1/2, respectively, indicating that the main valence of Ti in the obtained sample was +4. Fig. 3c presents the high-resolution XPS of Yb 4d. The peaks of Yb 4d5/2 at 185.21 eV and Yb 4d3/2 at 194.72 eV prove the existence of Yb3+. As shown in Fig. 3d, three second splits of the O 1s peaks at 530.05 eV, 530.48 eV, and 531.98 eV are assigned as the bonding energies for the TiOx, Ti–OH, and C–OH bonds, respectively.42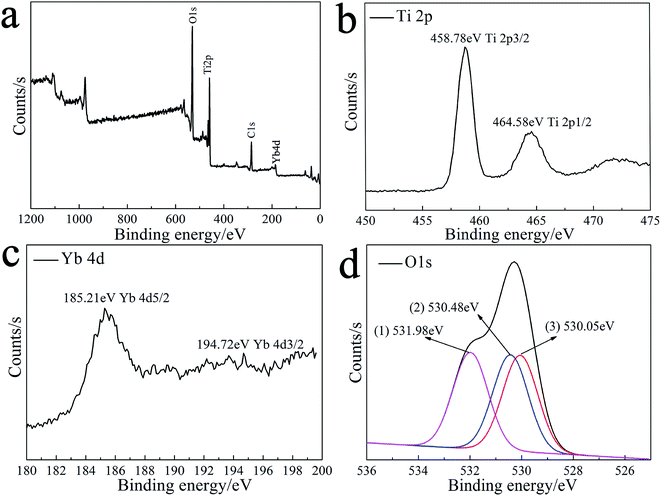 | ||
| Fig. 3 The XPS spectra of 1%Yb-TiO2HS: the general XPS survey spectrum (a) and Ti 2p (b), Yb 4d (c) and O 1s (d) spectra. | ||
3.4 Morphology, specific surface area, and porosity analysis
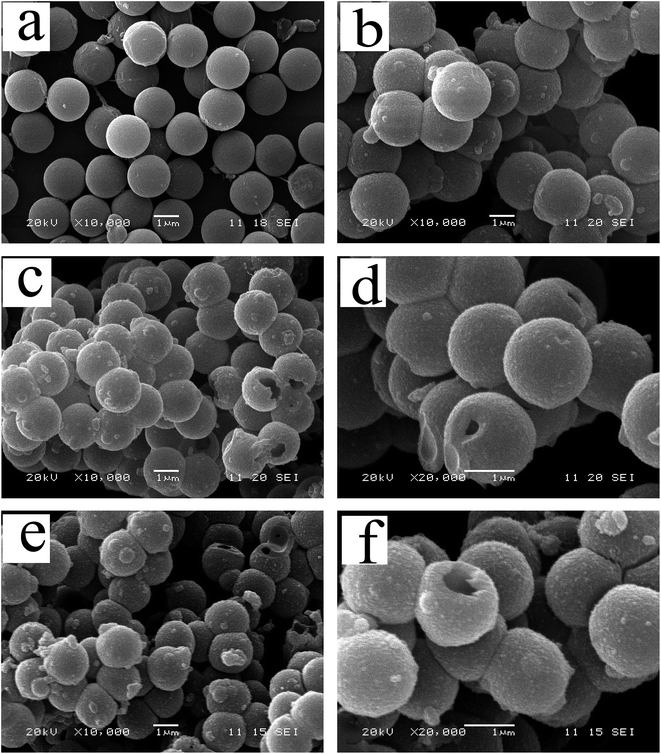
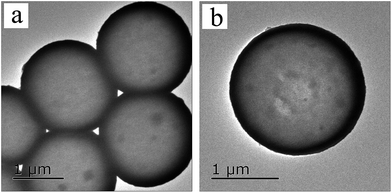
The TEM and the SEM images indicate that each sample has a uniform spherical morphology with a size about 1.8–2 μm. The SEM images of the MF with smooth surfaces are shown in Fig. 4a. As shown in Fig. 4b, the TiO2@MFCS inherit the spherical morphology of the MF templates, but the surface of the composite microspheres are much rougher than those of pure MF due to the TBOT hydrolysis reaction, which generated the MF templates coated with the TiO2 colossal particles; thus, the size of the TiO2@MFCS (about 2 μm) became slightly larger than that of MF (about 1.8 μm) (Fig. 4b). Fig. 4c, d and e, f show the SEM images of TiO2HS and 1%Yb-TiO2HS, respectively. The crushed microspheres shown in Fig. 4c and e revealed that the microspheres are hollow structures. The obtained microspheres have an average particle size of about 1.8 μm. As shown in the TEM images of 1%Yb-TiO2HS (Fig. 5), the strong contrast between the dark edges and the pale center further confirms that all the microspheres have a large hollow cavity of about 1.8 μm size, which is in agreement with the TEM observations. Overall, the 1%Yb-TiO2HS was successfully fabricated by a sol–gel template method using the MF as the template.The N2 adsorption–desorption curves of 1%Yb-TiO2HS and TiO2HS are shown in Fig. S5a and b,† respectively; the curves exhibit isotherms with a clear hysteresis loop, indicating the existence of mesoporous structures of 1%Yb-TiO2HS and TiO2HS. The specific surface areas of 1%Yb-TiO2HS and TiO2HS, determined by the Brunauer–Emmett–Teller method, are 64.655 m2 g−1 and 23.814 m2 g−1, respectively. This indicates that Yb doping can increase the surface area to some extent. The pore size distribution curves of 1%Yb-TiO2HS and TiO2HS, shown in Fig. S5c and d,† were calculated from the desorption branch obtained by Barrett–Joyner–Halenda method. In both cases, the most abundant peaks appeared at around 5 nm, indicating that most of the pores in 1%Yb-TiO2HS and TiO2HS have a size of 5 nm. The abovementioned results confirmed the mesoporous structures of 1%Yb-TiO2HS and TiO2HS.
3.5 Luminescence and UV-vis diffuse reflection spectrum (UV-DRS)
The optical absorption abilities of the samples were demonstrated by diffuse reflectance spectroscopy (DRS) in the optical wavelength range of 300–800 nm, as shown in Fig. S6.† When compared with commercial P25 TiO2 powder (P25), the absorption peaks of TiO2HS and Yb-TiO2HS exhibit a significant enhancement in intensity in the region of visible-light. The K–M function transformed spectra of the samples were obtained using the Kubelka–Munk function method (K–M function),43 as shown in Fig. S7.†The corresponding values of the band gap (Eg) were calculated according to tangent valuation method, as shown in Table 2. Upon Yb doping, the Eg value gradually decreased.
| Sample | P25 | TiO2HS | 0.5%Yb-TiO2HS | 1%Yb-TiO2HS | 1.5%Yb-TiO2HS |
|---|---|---|---|---|---|
| Eg/eV | 3.04 | 2.98 | 2.93 | 2.95 | 2.94 |
Although the electrons (e−) and holes (h+) separate under light irradiation (λex = 275 nm), the e− and h+ combined, generating a luminescence phenomenon. The intensity of the luminescence reflects the recombination ratio of the e− and h+. The shapes of the luminescence spectra of each sample are quite similar, as shown in Fig. S8.† The lowest intensity of 1%Yb-TiO2HS indicates the lowest recombination ratio of the e− and h+.
3.6 Visible-light photocatalytic activity
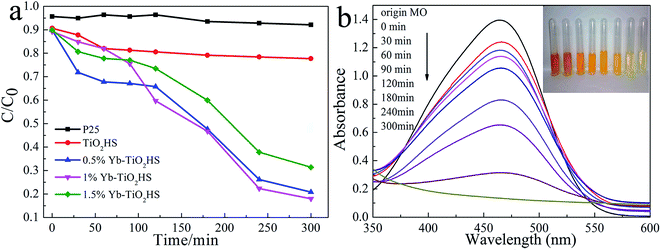
The visible-light (λ > 450 nm) photocatalytic activities of the samples were estimated using degradation of MO dye, as shown in Fig. 6a. The photocatalytic activity of TiO2HS is better than that of P25. Upon Yb doping, the photocatalytic activity of the Yb-TiO2HS is further improved and reaches a maximum of 89% MO degradation at the doping ratio of 1%. Fig. 6b shows that the MO was almost completely degraded with 1%Yb-TiO2HS after 5 h. Since excessive Yb will form a new center for the recombination of electron–hole pairs, the photocatalytic activity will decrease if the doping ratio of Yb is significantly increased. Fig. S9† shows the cyclic activity of 1%Yb-TiO2HS under visible-light irradiation. After three cycles, the degradation of MO remained at 89%.Fig. 7a and b show the photocatalytic decomposition rates and the surface absorption abilities of the MO solution at pH of 1, 3, 5, 7, and 9 with 1%Yb-TiO2HS, respectively. Upon increasing the pH, the decomposition rate and the surface absorption ability decreased. These results prove that the positive surface charge of TiO2 under an acid environment is beneficial for TiO2 to absorb the anionic MO and the enhancement of its photocatalysis ability.27 As shown in Fig. 7c, the effect of photocatalysis without H2O2 is lower than that with H2O2. H2O2 can provide not only O2 and OH−, but also H+ to increase the acidity of the reaction system, which can improve the photocatalytic effect.
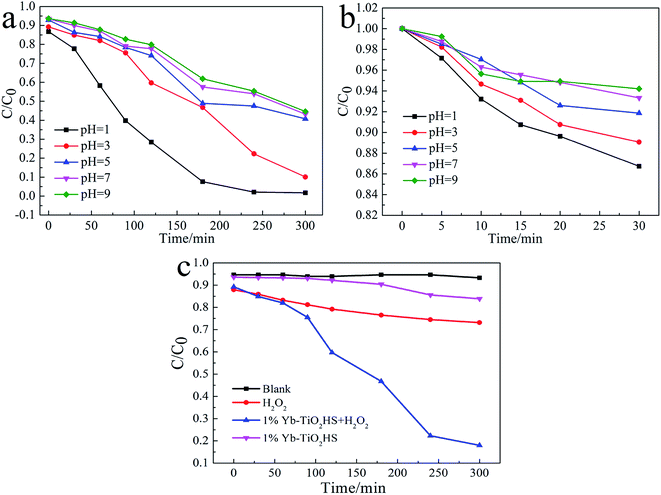 | ||
| Fig. 7 The photocatalytic decomposition rates (a), surface absorption abilities of the MO solution at different pH values with 1%Yb-TiO2HS (b) and the effects of H2O2 on MO degradation (c). | ||
3.7 Mechanism for the enhanced visible-light photocatalytic activity of Yb-TiO2HS
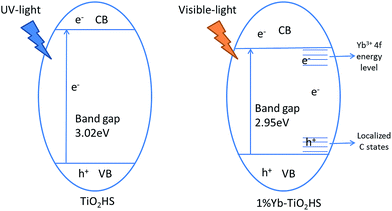
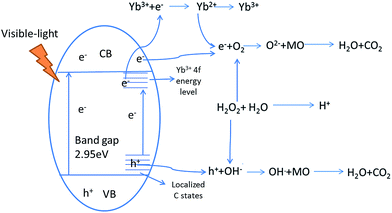
Extending the light absorption of TiO2 to the visible region and narrowing the band gap of TiO2 are effective methods for enhancing visible-light photocatalytic activity. As mentioned in the UV-DRS analysis (Fig. S6†) and the data obtained for the band gaps (Table 2), Yb-TiO2HS exhibited a wider absorption range in the visible region and a narrower band gap than pristine TiO2. These results were attributed to two reasons, as shown in Scheme 1. The first reason is the band gap narrowing, in which Yb doping leads to the appearance of oxygen vacancy defects.44 In addition, a small amount of residual carbon atom doping in TiO2 replaced the oxygen state in the TiO2HS lattice via the calcination of MF at 500 °C, which also leads to a narrowing of the band gap.45The second reason is the separation of electron–hole pairs; the luminescence spectra (Fig. S8†) indicates that Yb3+ doped in TiO2 can form centres for electron capture, promoting the separation of the electron–hole pairs. The reason for this was attributed to the formation of an empty 4f impurity energy level in the rare earth ions between the conduction and valence bands in the TiO2 energy band structure.44,46,47 However, the luminescence intensity of 1.5%Yb-TiO2HS was stronger than that of 1%Yb-TiO2HS, which shows that an excessive Yb3+ in TiO2 will form a new center for the recombination of the e− and h+.
The XPS (Fig. 3d) and the FT-IR (Fig. S4†) spectra show species such as –OH and COO– on the surface of TiO2 after Yb doping. These species can promote the degradation of dye under light irradiation. Moreover, Yb doped in TiO2 can restrain the phase transition of TiO2 from anatase to rutile (Fig. 2). The crystalline grain sizes of Yb-TiO2HS (Fig. S3†) calculated using the Scherrer equation indicate that a certain ratio of Yb dopant can lead to crystalline grain size thinning. The small crystalline grain size can increase the surface area of TiO2HS, which was proven in the BET analysis (Fig. S5†).
3.8 The mechanism of the visible-light photocatalytic reaction of Yb-TiO2HS
The photocatalytic process of Yb-TiO2HS is shown in Scheme 2. H2O2 can form O2, OH−, and H+ upon light irradiation, electron (e−)–hole (h+) pairs can be generated at the valence band after visible-light irradiation, and the e− can be captured by the 4f impurity energy level of Yb3+ or cross the band gap to transfer to the conduction band. After transferring to the conduction band or being captured by the 4f energy level of Yb3+, the e− can react with O2 to produce the O2−. Moreover, the h+ at the valence band and localized C state will react with OH− formed from the decomposition of H2O2 to produce the OH˙.10 O2− and OH˙ can oxidize MO to CO2 and H2O.48–50 In addition, the acidic environment prompts the photodegradation of MO under visible-light irradiation, and the decomposition of H2O2 can provide a certain amount of H+.4. Conclusions
In summary, Yb-doped TiO2 hollow spheres (Yb-TiO2HS) and TiO2 hollow spheres (TiO2HS) were successfully prepared via a sol–gel template method using melamine–formaldehyde polymer microspheres (MF) as the template. When compared with P25 TiO2 powder (P25), Yb-TiO2HS exhibited an enhanced absorption in the visible region and a lower recombination of electron–hole pairs. The photocatalytic activities of Yb-TiO2HS, TiO2HS, and P25 under visible-light irradiation were estimated using the photocatalytic degradation of MO dye. Yb-TiO2HS and the TiO2HS show better photocatalytic activities than P25, indicating that Yb doping and the hollow sphere structure can enhance the photocatalytic activity of TiO2 under visible-light irradiation. In addition, H2O2 plays a crucial role as a promotor, providing O2, OH−, and H+ to the photocatalytic reaction system, thus promoting the photodegradation effect of Yb-TiO2HS.Acknowledgements
This work was supported by the National Natural Science Foundation of China (grant number 51273154), the Natural Science Foundation of Hubei (grant number 2011CBD220), and the Graduate student Education Innovation Foundation of Wuhan Institute of Technology (grant number CX2016003).References
- K. Sridharan, E. Jang and T. J. Park, Appl. Catal., B, 2013, 142–143, 718–728 CrossRef CAS.
- J. Santiago-Morales, A. Agüera, M. D. M. Gómez, A. R. Fernández-Alba, J. Giménez, S. Esplugas and R. Rosal, Appl. Catal., B, 2013, 129, 13–29 CrossRef CAS.
- D. Dolat, S. Mozia, B. Ohtani and A. W. Morawski, Chem. Eng. J., 2013, 225, 358–364 CrossRef CAS.
- C. Ye, B. Tian and J. Zhang, Appl. Catal., B, 2011, 101, 376–381 CrossRef.
- N. Aman, P. K. Satapathy, T. Mishra, M. Mahato and N. N. Das, Mater. Res. Bull., 2012, 47, 179–183 CrossRef CAS.
- C. L. Muhich, J. Y. Westcott, T. Fuerst, A. W. Weimer and C. B. Musgrave, J. Phys. Chem. C, 2014, 118, 27415–27427 CAS.
- X. Fan, X. Chen, S. Zhu, Z. Li, T. Yu, J. Ye and Z. Zou, J. Mol. Catal. A: Chem., 2008, 284, 155–160 CrossRef CAS.
- C. Xu, A. Cui, Y. Yuan, Z. Chen, R. Yuan and X. Fu, J. Mater. Sci., 2013, 48, 3428–3435 CrossRef CAS.
- H. Li, Y. Hao, H. Lu, L. Liang, Y. Wang, J. Qiu, X. Shi, Y. Wang and J. Yao, Appl. Surf. Sci., 2015, 344, 112–118 CrossRef CAS.
- J. W. Shi, X. Zong, X. Wu, H. J. Cui, B. Xu, L. Wang and M. L. Fu, ChemCatChem, 2012, 4, 488–491 CrossRef CAS.
- L. Zhang, J. Luo, M. Wu, H. Jiu and Q. Chen, Mater. Lett., 2007, 61, 4452–4455 CrossRef CAS.
- N. Aman, P. K. Satapathy, T. Mishra, M. Mahato and N. N. Das, Mater. Res. Bull., 2011, 47, 179–183 CrossRef.
- J. Wang and P. A. Tanner, J. Am. Chem. Soc., 2009, 132, 947–949 CrossRef PubMed.
- H. Jiu, Y. Fu, L. Zhang and Y. Sun, Micro Nano Lett., 2012, 7, 287–291 Search PubMed.
- J. Zhou, L. Xu, J. Sun, D. He and H. Jiao, Surf. Coat. Technol., 2015, 271, 119–126 CrossRef CAS.
- T. Liu, X. Bai, C. Miao, Q. Dai, W. Xu, Y. Yu, Q. Chen and H. Song, J. Phys. Chem. C, 2014, 118, 3258–3265 CAS.
- D. D. L. C. Romero, G. T. Torres, J. C. Arévalo, R. Gomez and A. Aguilar-Elguezabal, J. Sol-Gel Sci. Technol., 2010, 56, 219–226 CrossRef.
- M. Borlaf, M. T. Colomer, R. Moreno and A. L. Ortiz, J. Am. Ceram. Soc., 2014, 34, 4457–4462 CrossRef CAS.
- L. Cheng, X. Xu, Y. Fang, Y. Li, J. Wang, G. Wan, X. Ge, L. Yuan, K. Zhang and L. Liao, Sci. China: Chem., 2015, 58, 850–857 CrossRef CAS.
- Y. Liu, Nanoscale, 2016, 8, 46–54 Search PubMed.
- Y. Lv, Z. Xu, H. Asai, N. Shimada and K. Nakane, RSC Adv., 2016, 6, 21043–21047 RSC.
- X. Lin, D. Fu, L. Hao and D. Zhen, J. Environ. Sci., 2013, 25, 2150–2156 CrossRef CAS.
- Z. Q. Li, Y. P. Que, L. E. Mo, W. C. Chen, Y. Ding, Y. M. Ma, L. Jiang, L. H. Hu and S. Y. Dai, ACS Appl. Mater. Interfaces, 2015, 7, 10928–10934 CAS.
- P. Liu, Y. Li, Y. Hu, X. Hou and C. Li, Ind. Eng. Chem. Res., 2015, 54, 6692–6697 CrossRef CAS.
- J. W. Shi, H. J. Cui, X. Zong, S. Chen, J. Chen, B. Xu, W. Yang, L. Wang and M. L. Fu, Appl. Catal., A, 2012, 435–436, 86–92 CrossRef CAS.
- M. L. Sang, K. H. Park and S. C. Hong, Chem. Eng. J., 2012, 195–196, 323–331 Search PubMed.
- X. Qu, X. Yan, Y. Hou, P. Wang, H. Song and F. Du, J. Sol-Gel Sci. Technol., 2015, 76, 699–707 CrossRef CAS.
- J. Zhang, L. Li, Z. Xiao, D. Liu, S. Wang, J. Zhang, Y. Hao and W. Zhang, ACS Sustainable Chem. Eng., 2016, 4, 2037–2046 CrossRef CAS.
- X. Jiang, L. Yu, C. Yao, F. Zhang, J. Zhang and C. Li, Materials, 2016, 9, 323 CrossRef.
- Y. Y. Wang, G. Q. Zhou, J. Guo and T. Q. Liu, Ceram. Int., 2016, 42, 12467–12474 CrossRef CAS.
- M. Mozafari, F. Moztarzadeh, A. M. Seifalian and L. Tayebi, J. Lumin., 2013, 133, 188–193 CrossRef CAS.
- S. Gai, L. Wang, M. Zhang, S. Huang and P. Yang, Inorg. Chem., 2013, 52, 9184–9191 CrossRef PubMed.
- Y. Wu, Y. Li, L. Qin, F. Yang and D. Wu, J. Mater. Chem. B, 2012, 1, 204–212 RSC.
- C. Song, W. Yu, B. Zhao, H. Zhang, C. Tang, K. Sun, X. Wu, L. Dong and Y. Chen, Catal. Commun., 2009, 10, 650–654 CrossRef CAS.
- Y. S. Li, F. L. Jiang, Q. Xiao, R. Li, K. Li, M. F. Zhang, A. Q. Zhang, S. F. Sun and Y. Liu, Appl. Catal., B, 2010, 101, 118–129 CrossRef CAS.
- C. P. Sibu, S. R. Kumar, A. P. Mukundan and K. G. K. Warrier, Chem. Mater., 2002, 14, 2876–2881 CrossRef CAS.
- A. D. Weisz, L. G. A. Rodenas, P. J. Morando, A. E. Regazzoni and M. A. Blesa, Catal. Today, 2002, 76, 103–112 CrossRef CAS.
- P. Ji, M. Takeuchi, T. M. Cuong, J. Zhang, M. Matsuoka and M. Anpo, Res. Chem. Intermed., 2010, 36, 327–347 CrossRef CAS.
- K. T. Ranjit, I. Willner, A. S. H. Bossmann and A. M. Braun, Environ. Sci. Technol., 2001, 35, 1544–1549 CrossRef CAS PubMed.
- T. D. Nguyen-Phan, M. B. Song, E. J. Kim and E. W. Shin, Microporous Mesoporous Mater., 2009, 119, 290–298 CrossRef CAS.
- H. Shi, T. Zhang, T. An, B. Li and X. Wang, J. Colloid Interface Sci., 2012, 380, 121–127 CrossRef CAS PubMed.
- A. Rjeb, S. Letarte, L. Tajounte, M. C. E. Idrissi, A. Adnot, D. Roy, Y. Claire and J. Kaloustian, J. Electron Spectrosc. Relat. Phenom., 2000, 107, 221–230 CrossRef CAS.
- D. Reyes-Coronado, G. Rodríguez-Gattorno, M. E. Espinosa-Pesqueira, C. Cab, C. R. De and G. Oskam, Nanotechnology, 2008, 19, 145605 CrossRef CAS PubMed.
- P. Yan, H. Jiang, S. Zang, J. Li, Q. Wang and Q. Wang, Mater. Chem. Phys., 2013, 139, 1014–1022 CrossRef CAS.
- Z. Ying, Z. Zhao, J. Chen, C. Li, J. Chang, W. Sheng, C. Hu and S. Cao, Appl. Catal., B, 2015, 165, 715–722 CrossRef.
- J. Castañeda-Contreras, V. F. Marañón-Ruiz, R. Chiu-Zárate, P. L. D. Guevara, R. Rodriguez and C. Michel-Uribe, Mater. Res. Bull., 2012, 47, 290–295 CrossRef.
- J. Reszczyńska, T. Grzyb, J. W. Sobczak, W. Lisowski, M. Gazda, B. Ohtani and A. Zaleska, Appl. Catal., B, 2014, 163, 40–49 CrossRef.
- Y. Shen, W. Wang and K. Xiao, J. Environ. Chem. Eng., 2016, 4, 1259–1266 CrossRef CAS.
- Y. Jiang, W. N. Wang, P. Biswas and J. D. Fortner, ACS Appl. Mater. Interfaces, 2014, 6, 303–313 Search PubMed.
- R. Palominos, J. Freer, M. A. Mondaca and H. D. Mansilla, J. Photochem. Photobiol., A, 2008, 193, 139–145 CrossRef CAS.
Footnote |
| † Electronic supplementary information (ESI) available. See DOI: 10.1039/c7ra02165h |
| This journal is © The Royal Society of Chemistry 2017 |

