 Open Access Article
Creative Commons Attribution 3.0 Unported Licence
Microwave-assisted synthesis of cobalt sulphide nanoparticle clusters on activated graphene foam for electrochemical supercapacitors
Tshifhiwa Moureen Masikhwa,
Moshawe Jack Madito,
Abdulhakeem Bello,
Joel Lekitima and
Ncholu Manyala *
*
Department of Physics, Institute of Applied Materials, SARCHI Chair in Carbon Technology and Materials, University of Pretoria, Pretoria 0028, South Africa. E-mail: ncholu.manyala@up.ac.za; Fax: +27 12 420 2516; Tel: +27 12 420 3549
First published on 7th April 2017
Abstract
Cobalt sulphide (Co9S8) nanoparticle clusters embedded in an activated graphene foam (AGF) structure were prepared using microwave-assisted hydrothermal synthesis. Morphological characterization of the as-prepared Co9S8/AGF showed that Co9S8 composed of cluster (sphere)-like nanoparticles was embedded in the matrix of a porous sheet-like AGF. The synergy between the Co9S8 nanoparticles and AGF in the Co9S8/AGF composite showed predominantly an improvement in the porous nature (surface area and pore volume) of the Co9S8 and the electrical conductivity of the composite electrode. The composite exhibited a specific capacitance of 1150 F g−1 as compared to Co9S8 with a specific capacitance of 507 F g−1 at a scan rate of 5 mV s−1 and good cycling stability in 6 M KOH electrolyte. The Co9S8/AGF composite showed significant improvement in the specific capacitance compared to pure Co9S8 and specific capacitance values found in previously published reports by other studies for cobalt sulphide-based composites.
Introduction
The constantly increasing energy and power demands in energy storage applications have caused important research exertions on the improvement of new electrode materials for advanced energy storage devices. The main electrode materials for electrical double layer capacitors (EDLCs) are carbon based materials and faradic materials, such as transitional metal oxide/hydroxides, transition metal disulphides and conducting polymers, which are explored for redox or hybrid based supercapacitors.1–3 EDLCs with good conductivity and a tunable porous network can deliver a long cycle life but relatively low energy density which is necessary for various supercapacitor applications. In contrast, faradic based materials show higher capacitance than EDLCs due to their fast, reversible electrosorption and redox processes occurring on the electrode surface. Therefore, increasingly, study on electrochemical capacitors has been focused on combining the unique advantages of different capacitive materials for better electrochemical performance.4 Recently, porous carbon materials such as activated carbon (AC) have been used as electrode materials in the production of EDLCs due to their good electrical conductivities, long cycle-life and large surface area.5–8Transition metal chalcogenides such as cobalt sulphide,9–11 molybdenum disulphide,12–14 nickel sulphide,15–17 and copper sulphide18 are potential electrode materials for supercapacitor applications because they are known to be electrochemically active. However, cobalt sulphide which exists in different stoichiometric ratios like Co1−xS, CoS, CoS2, Co9S8, and Co3S4, is considered to be a suitable candidate for electrochemical supercapacitor applications due to its good electrochemical activity, high thermal conductivity, and low cost compared to other metal sulphides. Amongst different cobalt sulphide stoichiometries, Co9S8 is a typical transitional metal chalcogenide which has great potential in battery and supercapacitor application.11,19 However, the poor electrical conductivity and mechanical instability of Co9S8 limit its energy storage application. In order to improve the properties of Co9S8, its various nanostructures have been investigated, for example, 3D flower-like, nanoflakes, nanotubes and rose-like structures.20–25 It has been established that modifying the Co9S8 with carbon materials by preparing Co9S8/carbon composites is one of the most effective strategies to increase the electrical conductivity as well as the electrochemical properties of Co9S8. Carbon materials provide interconnecting mesostructured supports that can facilitate good nanoparticle dispersion and electron transport. For example, Ramachandran et al. have produced Co9S8 nanoflakes on graphene to form Co9S8/G nanocomposites, for high-performance supercapacitors.21 So far no work has been done on the microwave-assisted hydrothermal synthesis of Co9S8 nanoparticles clusters on activated graphene foam (AGF) derived from polymer-based materials in an aqueous electrolyte media for electrochemical supercapacitor application.
Herein, we report a microwave-assisted hydrothermal synthesis of Co9S8 nanoparticles clusters on a porous sheet-like AGF derived from polymer-based materials in an aqueous electrolyte media. Microwave-assisted hydrothermal synthesis is a promising preparation method since the microwave synthesis process consists of high reaction rate and fast heating, and is capable of reducing reaction time drastically and saving energy thus lowering the cost of final product. In addition, microwave-assisted hydrothermal synthesis also has many other unique advantages, such as the homogeneous volumetric heating, the high penetration depth of microwave, and high selectivity. We also explore the potential of the composite as an electrode for supercapacitor applications. An electrochemical performance of as-prepared Co9S8 and Co9S8/AGF electrodes was evaluated in a three-electrode cell configuration using 6 M KOH. The specific capacitance of Co9S8/AGF electrode was obtained as 1150 F g−1 and that of the Co9S8 electrode as 507 F g−1 at a scan rate of 5 mV s−1. Co9S8/AGF electrode showed a good cycling stability with 94% capacitance retention over 1000 charge–discharge cycles.
Experimental
Materials
Cobalt(II) nitrate hexahydrate (Co(NO3)2·6H2O, purity >99.99%), hydrochloric acid (HCl, ≥32%), thiourea (CH4N2S, purity ≥99%) and polyvinyl alcohol (PVA, 99+% hydrolyzed) were purchased from Sigma-Aldrich. Polycrystalline Ni foam (3D scaffold template with an areal density of 420 g m2 and with a thickness of 1.6 mm) was purchased from Alantum (Munich, Germany). Potassium hydroxide (KOH, min 85%) was purchased from Merck (South Africa).Synthesis of activated graphene foam
The graphene foam (GF) was prepared using CVD and polycrystalline Ni foam substrate placed at a centre of a CVD quartz tube. GF was grown at 1000 °C for 10 min under a mixture of argon (Ar), hydrogen (H2) and methane (CH4) gases at flow rates of 300, 200 and 10 sccm respectively. After growth, the graphene/nickel foam samples were rapidly cooled by pushing the quartz tube to lower temperature region of the furnace. After removing the samples from CVD at room temperature, the samples were dipped in 3 M HCl at 80 °C to etch nickel foam. After complete etching of the nickel, the recovered GF was washed several times with deionized water and dried at 60 °C.Furthermore, GF was activated to produce porous activated graphene foam (AGF) as follows: a hydrogel was synthesised by dispersing a 100 mg of GF in 0.1 g ml−1 of polyvinyl alcohol (PVA) in a vial glass by ultrasonication followed by addition of 1.5 ml of hydrochloric acid (HCl) to the solution. The resultant mixture was hydrothermally treated in a sealed Teflon-lined stainless-steel autoclave at a temperature of 190 °C for 12 h to polymerize the mixture, and then cooled to room temperature. The recovered product, hydrogel, was washed with deionized water and dried for 6 h. Furthermore, the as-prepared hydrogel was soaked in aqueous KOH solution (KOH/hydrogel mass ratio = 7) for 24 h, and then the KOH/hydrogel mixture was placed in a horizontal tube furnace (for activation) and heated up to 800 °C at heating rate of 10 °C min−1 under argon gas flow for 1 h. Finally, the recovered AGF was neutralized with 0.1 ml of HCl, washed with deionised water and dried at 120 °C for 12 h. A detailed preparation and characterization of AGF is given by Bello et al.26
Synthesis of Co9S8 and Co9S8/AGF composite using microwave-assisted approach
In the synthesis of Co9S8, all the chemical reagents were used without any further purification. A 0.3 mmol of Co(NO3)2·6H2O was dissolved in 30 ml of deionized water under vigorous stirring for 20 min, then a 0.6 mmol thiourea (CH4N2S) was added to this solution and the mixture was further stirred for 30 min. After stirring, the mixture was carefully transferred into a quartz vessel in a microwave reactor (Anton Paar Synthos 3000 multimode reactor, 1400 W magnetron power) equipped with a wireless pressure and temperature sensor. The reactor was operated in the pressure mode using a power of 700 W; the sample temperature was ramped at a heating rate of 10 °C min−1 to 160 °C and maintained for 30 min at a pressure of 8.0 × 10⁶ Pa. Finally, after cooling the reaction chamber to room temperature the recovered product was filtered and washed several times with deionized water and ethanol, and dried at 60 °C for 6 h to obtain Co9S8 nanoparticles clusters.Similar to the synthesis of Co9S8, the Co9S8/AGF composite was prepared using a microwave reactor as demonstrated in Scheme 1. In the synthesis of Co9S8/AGF composite, a 15 mg of AGF was dispersed in 30 ml of water by ultrasonication for 12 h at room temperature. Thereafter, a 0.3 mmol of Co(NO3)2·6H2O and 0.6 mmol of CH4N2S was added to the AGF solution and the mixture was stirred for 10 min. After stirring, the mixture was transferred into a quartz vessel in a microwave reactor and the reactor settings used for the synthesis of Co9S8 as discussed above were repeated. After natural cooling of the reaction chamber to room temperature, the recovered product was filtered and washed several times with deionized water and ethanol, and dried at 60 °C for 6 h to obtain Co9S8/AGF composite which shows Co9S8 nanoparticles clusters on AGF as seen from a micrograph in Scheme 1.
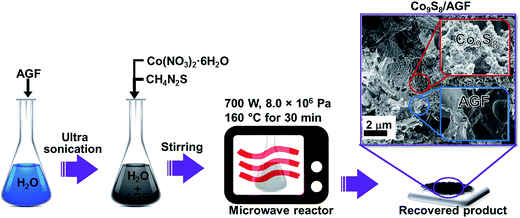 | ||
| Scheme 1 Preparation procedure of Co9S8 and its composite with AGF which shows Co9S8 nanoparticles clusters on AGF in the scanning electron microscope (SEM) micrograph. | ||
Structural and morphological characterization
X-ray diffraction (XRD) analysis of AGF, as-prepared Co9S8 and Co9S8/AGF composite was carried out using XPERT-PRO diffractometer (PANalytical BV, Netherlands) with theta/2 theta geometry, operating with a cobalt tube at 50 kV and 30 mA. Raman spectroscopy analysis was carried out using a Jobin Yvon Horiba TX 6400 micro-Raman spectrometer and the samples were analyzed using a 514 nm excitation laser and 1.5 mW laser power on the sample to avoid possible thermal effects and beam damage. X-ray photoelectron spectroscopy (XPS) measurements of the samples were conducted using a Physical Electronics VersaProbe 5000 spectrometer operating with a 100 μm monochromatic Al-Kα exciting source. The SEM images were obtained using a Zeiss Ultra Plus 55 field emission scanning electron microscope (FE-SEM) operated at an accelerating voltage of 2.0 kV.For high-resolution transmission electron microscopy (HRTEM) and the energy-dispersive X-ray spectrometer (EDS) spectra analysis the ethanol solution containing the as-prepared materials was dispersed on a formal-coated copper grid and the analysis was carried out on a Jeol JEM-2100F Field Emission Electron Microscope with a maximum analytical resolution of 200 kV and a probe size of <0.5 nm.
Electrode preparation and electrochemical characterization
The working electrodes were prepared as follows: 85 wt% of the Co9S8/AGF material was mixed with 10 wt% carbon black and 5 wt% polyvinylidene difluoride (PVDF) binder in an agate mortar. The mixture was then dissolved with 1-methyl-2-pyrrolidinone (NMP) to form a paste. Thereafter, a paste was coated homogeneously on Ni foam which served as a current collector and dried at 60 °C for 8 h to ensure complete evaporation of the NMP. The estimated mass per electrode after drying is 2.5 mg.The electrochemical properties were investigated using a Bio-Logic VMP300 potentiostat (Knoxville TN 37930, USA) controlled by the EC-Lab® V10.40 software in a three-electrode configuration. The Co9S8/AGF material served as the working electrode, glassy carbon plate as the counter electrode and Ag/AgCl (3 M KCl) as the reference electrode. A 6 M potassium hydroxide (KOH) electrolyte was used for analysis. The cyclic voltammetry (CV) tests were carried out in the potential window range of 0.0 to 0.6 V vs. Ag/AgCl at different scan rates ranging from 5 to 100 mV s−1. The electrochemical impedance spectroscopy (EIS) measurements were performed in the open circuit within a frequency range of 10 mHz to 100 kHz.
Results and discussion
Structural and morphological characterization
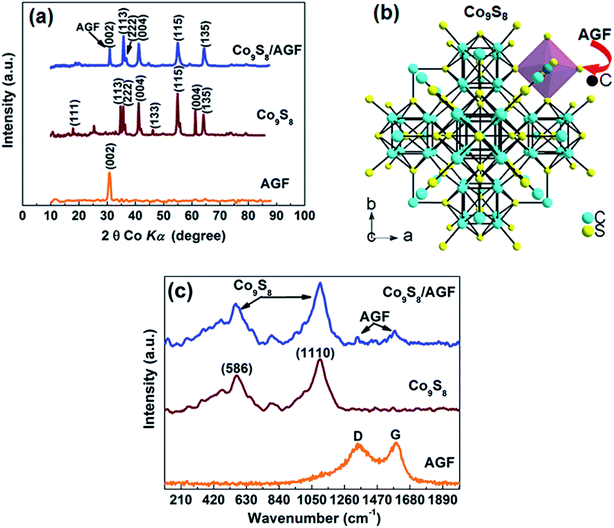
Fig. 1(a) shows the XRD patterns of the as-prepared AGF, Co9S8 and Co9S8/AGF composite. The typical diffraction peaks corresponding to Co9S8 were indexed using the best matching Inorganic Crystal Structure Database (ICSD) card number 23929 (crystal system: cubic; space-group: Fm![[3 with combining macron]](https://www.rsc.org/images/entities/char_0033_0304.gif) m and lattice parameter: a = 9.928 Å), and ICSD card number 31170 (crystal system: hexagonal, space-group: P63mc and cell parameters: a = 2.470 Å, c = 6.790 Å, a/b = 1.000, b/c = 1.000 and c/a = 1.000) for AGF. XRD pattern of the composite shows well-defined crystalline peaks with different diffraction planes suggesting that the as-prepared Co9S8 nanoparticles clusters are polycrystalline with good crystallinity. A (002) peak at 31.2° which corresponds to AGF confirms the presence of AGF in the composite.
m and lattice parameter: a = 9.928 Å), and ICSD card number 31170 (crystal system: hexagonal, space-group: P63mc and cell parameters: a = 2.470 Å, c = 6.790 Å, a/b = 1.000, b/c = 1.000 and c/a = 1.000) for AGF. XRD pattern of the composite shows well-defined crystalline peaks with different diffraction planes suggesting that the as-prepared Co9S8 nanoparticles clusters are polycrystalline with good crystallinity. A (002) peak at 31.2° which corresponds to AGF confirms the presence of AGF in the composite.
In a view of a molecular structure of Co9S8, Fig. 1(b) was obtained using ICSD card number 23929 and diamond crystal structure software. Fig. 1(b) shows a Co9S8 molecule viewed in (004) plane and the molecule depicts that the arrangement of the S atoms around the Co completes a tetrahedron (S atoms at 2.13 and 2.21 Å) and octahedron coordination (S atoms at 2.39 Å) for each of the Co atoms, and Co–Co interatomic distances is 2.51 Å which is slightly higher than those of Co–S suggesting that Co–S bond is more energetically favourable in the molecule.27 In Fig. 1(b), it can be seen that S dominates the edges of the Co9S8 molecule which are most likely to be the active sites hence making S an active site for chemical interaction between the Co9S8 and the carbon (C) from AGF during composite synthesis, as demonstrated by arrows. Both C (in graphene) and S are known to be reactive mainly due to unpaired π-electron in C and high electronegativity of S, hence a chemical interaction between C and S in Co9S8/AGF would have occurred during composite synthesis leading to a material with dominating metallic behaviour.28 Fig. 1(c) shows the Raman spectra of the as-prepared AGF, Co9S8 and Co9S8/AGF composite. In the Raman spectrum of the as-prepared Co9S8/AGF, the bands at 586 cm−1 and 1110 cm−1 arise from Co9S8 vibrational modes and low-intensity features at 1384 cm−1 and 1583 cm−1 are AGF signatures which agree well with the bands observed from the as-prepared AGF and Co9S8 confirming the presence of both AGF and Co9S8 in the composite.
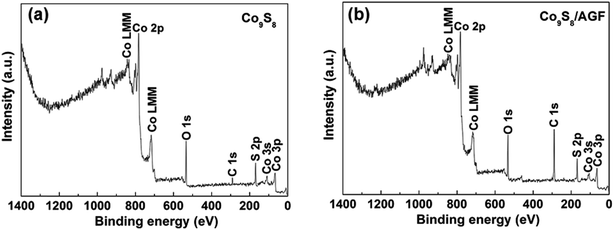
The surface elemental composition of the as-prepared Co9S8 and Co9S8/AGF composite was analyzed by XPS. Fig. 2(a) and (b) show the wide scan XPS spectra of the as-received Co9S8 and Co9S8/AGF composite respectively, which displays the main elements (Co, S, and C) of the composition of the samples. The presence of O and C elements in the XPS spectrum of Co9S8 may be due to the surface-adsorbed CO2 and O2. Similarly, the O in the XPS spectrum of the composite could be due to the surface-adsorbed CO2 and O2. A Co9S8 sample shows 40.1 at% of Co 2p, 37.2 at% S 2p, 8.2 at% C 1s and 14.5 at% O 1s suggesting that a sample is predominantly composed of Co and S. On the other hand, a composite sample shows 22.4 at% of Co 2p, 25.6 at% S 2p, 41.7 at% C 1s and 10.3 at% O 1s. A high concentration of C suggests that a surface of the composite sample is predominantly C.
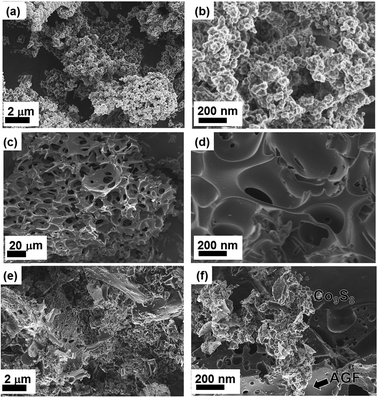
Fig. 3(a) and (b) show the SEM images of the as-prepared Co9S8 sample at low and high magnifications respectively. A high magnification SEM image of the as-prepared Co9S8 sample (Fig. 3(b)) shows that the product is composed of clustered nanoparticles.
Fig. 3(c) and (d) show the SEM micrographs of the as-prepared AGF, and the morphology of this sample reveal the large density of interconnected porous cavities which will provide sufficient reservoirs for an electrolyte. The nanoparticles clusters in Co9S8/AGF composite are densely anchored on the surface of the AGF as shown in Fig. 3(e) and (f) which show the SEM images of the as-prepared Co9S8/AGF sample at low and high magnifications respectively. During the composite synthesis reaction, the nuclei formation and crystal growth of Co9S8 nanoparticles with similar shape and size are attributable to the constant heating by the microwave irradiation. Generally, the reaction kinetics is fast in microwave synthesis owing to the high depth penetration of microwave irradiation, hence uniform-sized nanoparticles could be obtained.29
The morphology of the obtained Co9S8 with and without AGF were also examined by TEM, as shown in Fig. 4(a) and (b) respectively. These TEM images confirm the observation made under SEM that Co9S8 is anchored in the AGF matrix. The nanostructures of the samples seen in TEM images were dispersed on the TEM copper grids. The EDS analysis is shown in Fig. 4(c) as carried out inside TEM system and confirms the presence of C, Co, and S in the Co9S8/AC composite. Additional elements (Fe, Cu, Cr) observed in Fig. 4(c) arise from the TEM copper grid.
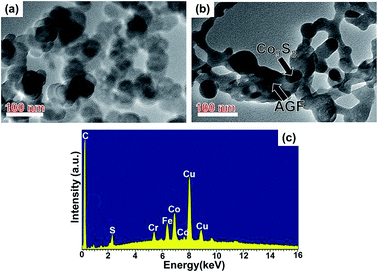 | ||
| Fig. 4 (a) and (b) TEM images of the as-prepared Co9S8 and Co9S8/AGF samples respectively. (c) EDS spectra of the as-prepared Co9S8/AGF sample. | ||
The nitrogen adsorption–desorption isotherm of the Co9S8 shows a type III behaviour (Fig. 5(a)), indicating a weak interaction between the N2 adsorbent and the material. Furthermore, inset to Fig. 5(a) shows a pore size distribution ranging from 2 to 4 nm suggesting that pores in Co9S8 are mainly mesopores. Fig. 5(b) shows the N2 adsorption–desorption isotherm of the as-prepared AGF which displays a type IV adsorption–desorption with H4 hysteresis isotherm. Inset to Fig. 5(b) shows a pore size distribution below 3 nm which is an indication of the existence of micropore in the AGF sample.
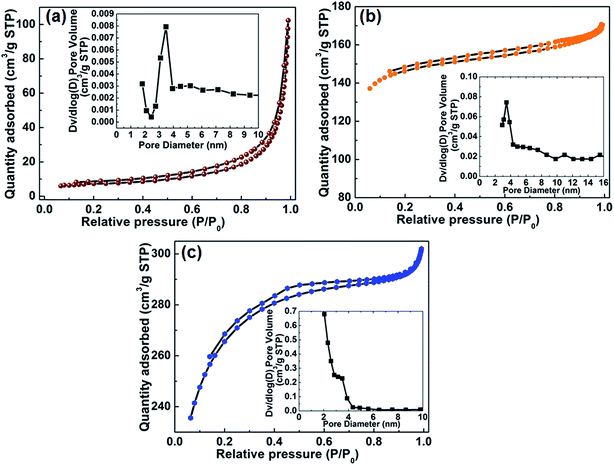 | ||
| Fig. 5 (a) (b) and (c) N2 absorption/desorption isotherms of Co9S8, AGF and Co9S8/AGF samples respectively (insets show pore size distribution). | ||
On the other hand, the N2 adsorption–desorption isotherm of the Co9S8/AGF (Fig. 5(c)) shows a typical type II adsorption–desorption with H4 hysteresis isotherm that characterizes complex materials containing micropores and mesopores. The presence of micro- and mesopores in the composite material is supported by inset to Fig. 5(c) where a pore size distribution is observed around 3 nm. Furthermore, the pore size distribution around 2 nm indicates the presence of micropores in this material. The formation of micropores in the composite can be attributed to the addition of AGF to the Co9S8 material. The N2 absorption/desorption isotherms of Co9S8, AGF and Co9S8/AGF samples show that Co9S8/AGF has a higher specific surface area of 787.9 m2 g−1 as compared to AGF with specific surface area of 498.2 m2 g−1 and Co9S8 with specific surface area of 33.8 m2 g−1.
Electrochemical characterization
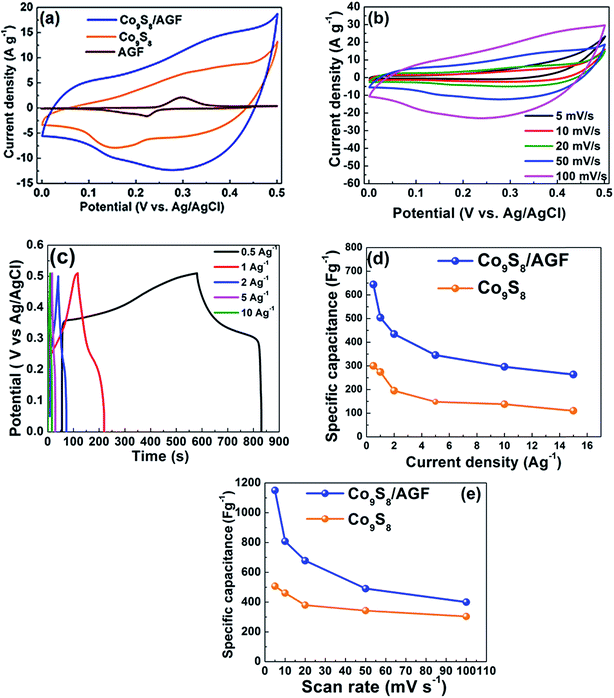
Furthermore, the Co9S8 and Co9S8/AGF materials prepared as electrodes were evaluated in a three-electrode configuration using 6 M KOH electrolyte for electrochemical supercapacitor. In electrochemical characterization, CV measurements are carried out to assess the macroscopic electrochemical surface reactions of the electrode material during supercapacitor operation. Fig. 6(a) shows a comparison of the CV curves obtained in a three-electrode cell for the Co9S8 and Co9S8/AGF electrodes at a scan rate of 50 mV s−1 in a potential window range of 0.0 to 0.5 V vs. Ag/AgCl. For Co9S8 electrode, there are two weak redox peaks at ∼0.15 and 0.35 V which correspond to anodic and cathodic respectively, and these redox peaks are attributed to a reversible electron transfer process of the Co2+/Co3+ redox couple.30 These redox peaks correspond to the conversion between different cobalt oxidation states, according to the following reaction equations:| Co9S8 + OH− ↔ Co9S8OH + e− | (1) |
| Co9S8OH + OH− ↔ Co9S8O + H2O + e− | (2) |
Furthermore, the Co9S8/AGF electrode also shows similar peaks. However, the Co9S8/AGF electrode exhibited a better capacitive behaviour compared to the Co9S8 and AGF electrodes as shown by the high current response of Co9S8/AGF electrode in Fig. 6(a), and therefore, further electrochemical characterization will focus only on the composite electrode. A high current response of Co9S8/AGF compared to Co9S8 electrode is due to the synergistic effect of Co9S8 and AGF in the composite electrode. The CV curves of the Co9S8 and Co9S8/AGF electrodes both showing a high current response, and anodic and cathodic features indicate the pseudocapacitive behaviour of the electrodes. Of course, similar to metal-oxides, metal-sulphides also have pseudocapacitive behaviour due to sulphur ions in the metal sulphides owing to the fact that both sulphur and oxygen belong to the same group in the periodic table. Fig. 6(b) shows the CV curves of the Co9S8/AGF electrode at different scan rates of 5, 10, 20, 50 and 100 mV s−1. These CV curves have similar shapes, however, the current response increases with increasing scan rates showing good capacitive feature of the electrode.
To demonstrate the effect of AGF in composite the specific capacitance Csp (F g−1) were calculated from the galvanostatic charge–discharge (GCD) and CV curves using the following equations:
 | (3) |
 | (4) |
Fig. 6(c) shows the galvanostatic charge–discharge (GCD) curves of Co9S8/AGF electrodes at different current densities of 0.5, 1, 2, 5 and 10 A g−1. The discharge curves clearly show two voltage steps, a fast potential drop in the range of 0.5–0.33 V and a slow potential drop in the range of 0.33–0.26 V. The voltage drop at around 0.33 V shows a faradic behaviour which is in agreement with the CV curves in Fig. 6(b). The plot of the specific capacitance as a function of scan rate and current density for Co9S8 and Co9S8/AGF electrodes is shown in Fig. 6(d) and (e), respectively. From all the results of Co9S8/AGF composites including the pristine Co9S8 the Co9S8/AGF is showing the highest specific capacitance. A specific capacitance of 1150 F g−1 and 507 F g−1 was obtained for Co9S8 and Co9S8/AGF electrodes respectively at a scan rate of 5 mV s−1, and these specific capacitance values decreases as the scan rate increases as shown in Fig. 6(e). It is worth mentioning that at a low scan rate and current density in KOH electrolyte, negative ions (OH−) can easily diffuse into most active sites available through the electrode material leading to sufficient insertion reaction, however, at a high scan rate and current density, these ions have sufficient time to reach only the outer (surface) active sites of the electrode material and not the inner sites hence inner sites have no or little contribution to the capacitive behaviour of the electrode leading to a less capacitance. Fig. 6(d) and (e) clearly shows that the electrode with AGF has a high specific capacitance which is clear evidence that the incorporation of AGF in Co9S8 provides better electrical conductivity due to improved metallic behaviour of the electrode.
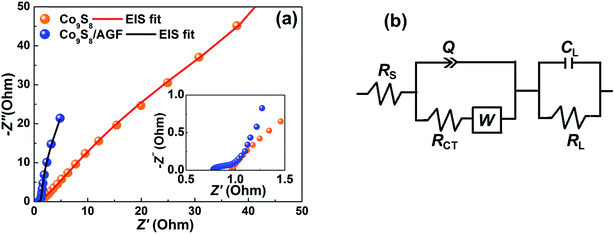
Furthermore, EIS measurements were carried out at an open circuit potential in a frequency range of 10 mHz to 100 kHz to investigate the impedance behaviour at the electrode/electrolyte interface. Fig. 7(a) shows the Nyquist plot (imaginary component, Z′′ vs. the real component, Z′ of the impedance) of the Co9S8 and Co9S8/AGF electrodes, and the inset to the figure (magnified high-frequency region of the EIS) shows the equivalent series resistance (ESR – the combined resistance of electrolyte, intrinsic resistance of substrate and contact resistance at the active material/current collector). This indicates that a composite electrode has a lower diffusion resistance compared to the pure electrode. In addition, the composite electrode displays a shorter diffusion length descriptive of the easiness of the movement of ions towards the electrode/electrolyte interface and the transfer of the charge to the electrode. EIS data of both electrodes show slightly tilted vertical lines indicating a deviation from ideal capacitive behaviour, but also suggesting low diffusion resistance of ions within the structure of the electrode material.
Fig. 7(b) show the equivalent circuit used for fitting the EIS data (solid-lines in Fig. 7(a)) using ZFIT software.31 The best fitting parameters of the EIS data are listed in Table 1 for both electrodes. In the circuit (Fig. 7(b)), the equivalent series resistance, RS is in series with the constant phase element, Q, and charge transfer resistance, RCT. EIS data of the composite (Fig. 7(a)) shows a small or nearly semi-circular arc in the high-frequency to mid-frequency region which is modelled by RCT and Q, and is accountable for the ideal capacitance of the electrode. In addition, this region (high-frequency to mid-frequency) can be represented by the Warburg element which is expressed as Warburg impedance, W.
| Electrode materials | Parameters | ||||
|---|---|---|---|---|---|
| RS (Ω) | RCT (Ω) | CL (F) | N | Q | |
| Co9S8 | 0.94 | 14.16 | 1.0 | 0.91 | 1.0 |
| Co9S8/AGF | 0.79 | 0.55 | 1.14 | 0.98 | 0.47 |
The Warburg impedance is formulated as  , where A is the Warburg coefficient and ω is the angular frequency.32 Warburg impedance illustrates that the ion diffusion in the solution and the adsorption of ions onto the electrode surface occur swiftly. The impedance of the constant phase element Q, can be expressed as:
  , where T is the frequency independent constant with dimensions of (F cm−2)n related to the roughness and pseudocapacitive kinetics of the electrode, n value varies from −1 to 1 and can be calculated from the slope of the log
![[thin space (1/6-em)]](https://www.rsc.org/images/entities/char_2009.gif) Z vs. log
Z vs. log![[thin space (1/6-em)]](https://www.rsc.org/images/entities/char_2009.gif) f.33 For values of n = 0, Q acts as a pure resistor while for n = 1, Q acts as a pure capacitor and for n = −1, Q acts as an inductor.34
f.33 For values of n = 0, Q acts as a pure resistor while for n = 1, Q acts as a pure capacitor and for n = −1, Q acts as an inductor.34
For very low-frequency values, an ideal electrode produces a vertical line parallel to the imaginary axis with a mass capacitance represented as Q. The deviation from this ideal behaviour is linked with a leakage resistance RL which is parallel to the CL in the equivalent circuit (Fig. 7(b)). In Table 1, the RS and RCT values (RS = 0.79 Ω and RCT = 0.55 Ω) show that a composite electrode has a lower diffusion resistance and charge-transfer resistance compared to a pure electrode (RS = 0.94 Ω and RCT = 14.16 Ω). The CL-values (i.e., ≈1) for both electrodes denotes the pseudocapacitance arising from the faradic charge transfer process.35
The n-values for Co9S8 and Co9S8/AGF electrodes (0.94 and 0.79 respectively) indicate a capacitive behaviour of the electrodes. The Co9S8/AGF electrode shows low Q-value (0.47) compared to Co9S8 electrode (1.0) indicating less deviation from ideal capacitive behaviour since an ideal electrode would produce a vertical line parallel to the imaginary axis. In brief, both Co9S8 and Co9S8/AGF electrodes show capacitive behaviour, however, the composite electrode outperforms the pure electrode clearly showing the electrochemical enhancing effect of AGF in the Co9S8/AGF electrode.
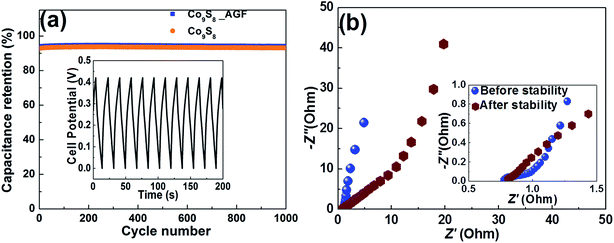
Moreover, the cyclic stability of the electrode materials is an essential and important parameter to rank the performances of the energy storage applications. Fig. 8(a) shows the electrochemical cycling stability of the Co9S8 and Co9S8/AGF electrode at a high current density of 4 A g−1 which depicts no obvious loss in the capacitance over 1000 charge–discharge cycles. The capacitance retention of the Co9S8 is recorded at value of 93%. However, capacitance retention of the Co9S8/AGF electrode after 1000 cycles is 94% suggesting excellent rate stability of the electrode material. The excellent cycling stability of this electrode can be attributed to the nature of the Co9S8 nanoparticles and the synergy between these particles and AGF in the composite which enhanced the cycling stability of the electrode material. This synergistic effect has predominantly improved the porous nature of the Co9S8 resulting in ions utilizing most of the composite matrix, and also has significantly improved the electrical conductivity of the composite electrode resulting in a high current response of the electrode. Fig. 8(b) shows the Nyquist plots of the Co9S8/AGF electrode before and after cycling stability. After cycling stability, there is a slight change to the electrode material with the RS value slightly increasing to 0.82 Ω, with an increase in diffusion path length attributed to the repeated cycling effect because of the high current density used.
In brief, this work have shown that a microwave-assisted synthesis of Co9S8/AGF result in Co9S8 nanoparticles clusters embedded in AGF matrix and this composite shows significant improvement on the specific capacitance compared to pure Co9S8, even when compared to the specific capacitance values found in some of the previously published reports by other studies for cobalt sulphide-based composites, as shown in Fig. 9.
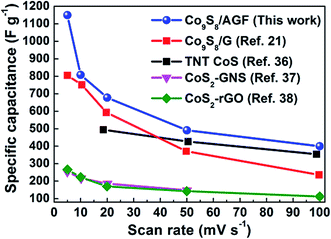 | ||
| Fig. 9 A comparison of specific capacitance vs. scan rate of Co9S8/AGF composite electrode and those of cobalt sulphide-based composite electrodes reported by Ramachandran et al.,21 Ray et al.,36 Wang et al.,37 and Tang et al.38 | ||
Conclusions
In this work, a microwave-assisted synthesis of Co9S8/AGF composite showed Co9S8 nanoparticles clusters embedded in AGF matrix. The incorporation of AGF into the Co9S8 clearly improved the electrical conductivity and the electrochemical response of the Co9S8/AGF electrode. This was indicated by the significant increase in the specific capacitance from 507 Fg−1 (Co9S8 electrode) to 1150 F g−1 (Co9S8/AGF electrode) at a scan rate of 5 mV s−1, and good cycling stability with 94% capacitance retention over 1000 charge–discharge cycles. The good electrochemical performance coupled with the low cost and simple preparation process focuses Co9S8/AGF as a promising electrode for electrochemical supercapacitors application.Acknowledgements
This work is based upon research supported by the South African Research Chairs Initiative (SARChI) of the Department of Science and Technology and National Research Foundation (NRF) of South Africa (Grant No. 61056). T. M. Masikhwa and M. J. Madito acknowledge financial support from the University of Pretoria and the NRF for their Postdoctoral fellowship.References
- C. Tan and H. Zhang, Chem. Soc. Rev., 2015, 44, 2713–2731 RSC.
- J. P. Cheng, J. Zhang and F. Liu, RSC Adv., 2014, 4, 38893–38917 RSC.
- Y. Zhai, Y. Dou, D. Zhao, P. F. Fulvio, R. T. Mayes and S. Dai, Adv. Mater., 2011, 23, 4828–4850 CrossRef CAS PubMed.
- S. Bose, T. Kuila, A. K. Mishra, R. Rajasekar, N. H. Kim and J. H. Lee, J. Mater. Chem., 2012, 22, 767–784 RSC.
- K. Hung, C. Masarapu, T. Ko and B. Wei, J. Power Sources, 2009, 193, 944–949 CrossRef CAS.
- C. Portet, J. Chmiola, Y. Gogotsi, S. Park and K. Lian, Electrochim. Acta, 2008, 53, 7675–7680 CrossRef CAS.
- A. Celzard, F. Collas, J. F. Marêché, G. Furdin and I. Rey, J. Power Sources, 2002, 108, 153–162 CrossRef CAS.
- T. C. Weng and H. Teng, J. Electrochem. Soc., 2001, 148, A368–A373 CrossRef CAS.
- L. Zhang, H. Bin Wu and X. W. (David) Lou, Chem. Commun., 2012, 48, 6912–6914 RSC.
- F. Luo, J. Li, H. Yuan and D. Xiao, Electrochim. Acta, 2014, 123, 183–189 CrossRef CAS.
- Q. Wang, L. Jiao, H. Du, J. Yang, Q. Huan, W. Peng, Y. Si, Y. Wang and H. Yuan, CrystEngComm, 2011, 13, 6960–6963 RSC.
- P. Ilanchezhiyan, G. Mohan Kumar and T. W. Kang, J. Alloys Compd., 2015, 634, 104–108 CrossRef CAS.
- A. Ramadoss, T. Kim, G.-S. Kim and S. J. Kim, New J. Chem., 2014, 38, 2379–2385 RSC.
- L.-Q. Fan, G.-J. Liu, C.-Y. Zhang, J.-H. Wu and Y.-L. Wei, Int. J. Hydrogen Energy, 2015, 40, 10150–10157 CrossRef CAS.
- H. Pang, C. Wei, X. Li, G. Li, Y. Ma, S. Li, J. Chen and J. Zhang, Sci. Rep., 2014, 4, 3577 Search PubMed.
- T. Zhu, Z. Wang, S. Ding, J. S. Chen and X. W. D. Lou, RSC Adv., 2011, 1, 397–400 RSC.
- A. Wang, H. Wang, S. Zhang, C. Mao, J. Song, H. Niu, B. Jin and Y. Tian, Appl. Surf. Sci., 2013, 282, 704–708 CrossRef CAS.
- C. J. Raj, B. C. Kim, W.-J. Cho, W.-G. Lee, Y. Seo and K.-H. Yu, J. Alloys Compd., 2014, 586, 191–196 CrossRef.
- W. Shi, J. Zhu, X. Rui, X. Cao, C. Chen, H. Zhang, H. H. Hng and Q. Yan, ACS Appl. Mater. Interfaces, 2012, 4, 2999–3006 CAS.
- L. Yin, L. Wang, X. Liu, Y. Gai, L. Su, B. Qu and L. Gong, Eur. J. Inorg. Chem., 2015, 2015, 2457–2462 CrossRef CAS.
- R. Ramachandran, M. Saranya, C. Santhosh, V. Velmurugan, B. P. C. Raghupathy, S. K. Jeong and A. N. Grace, RSC Adv., 2014, 4, 21151–21162 RSC.
- J. Yu, H. Wan, J. Jiang, Y. Ruan, L. Miao, L. Zhang, D. Xia and K. Xu, J. Electrochem. Soc., 2014, 161, A996–A1000 CrossRef CAS.
- R. Jin, J. Liu, Y. Xu, G. Li and G. Chen, J. Mater. Chem. A, 2013, 1, 7995–7999 CAS.
- J. Yang, Y. Zhang, C. Sun, G. Guo, W. Sun, W. Huang, Q. Yan and X. Dong, J. Mater. Chem. A, 2015, 3, 11462–11470 CAS.
- Y. Zhang, M. Ma, J. Yang, C. Sun, H. Su, W. Huang and X. Dong, Nanoscale, 2014, 6, 9824–9830 RSC.
- A. Bello, F. Barzegar, D. Momodu, J. Dangbegnon, F. Taghizadeh and N. Manyala, Electrochim. Acta, 2015, 151, 386–392 CrossRef CAS.
- S. Geller, Acta Crystallogr., 1962, 15, 1195–1198 CrossRef CAS.
- P. A. Denis, R. Faccio and A. W. Mombru, ChemPhysChem, 2009, 10, 715–722 CrossRef CAS PubMed.
- L. Xu, Y.-S. Ding, C.-H. Chen, L. Zhao, C. Rimkus, R. Joesten and S. L. Suib, Chem. Mater., 2007, 20, 308–316 CrossRef.
- J. Pu, Z. Wang, K. Wu, N. Yu and E. Sheng, Phys. Chem. Chem. Phys., 2014, 16, 785–791 RSC.
- B. E. Conway, Electrochemical Supercapacitors: Scientific Fundamentals and Technological Applications, Kluwer Academic/Plenum, New York, 1999 Search PubMed.
- Y. Zhou, H. Xu, N. Lachman, M. Ghaffari, S. Wu, Y. Liu, A. Ugur, K. K. Gleason, B. L. Wardle and Q. M. Zhang, Nano Energy, 2014, 9, 176–185 CrossRef CAS.
- D. Pech, M. Brunet, H. Durou, P. Huang, V. Mochalin, Y. Gogotsi, P.-L. Taberna and P. Simon, Nat. Nanotechnol., 2010, 5, 651–654 CrossRef CAS PubMed.
- C. Masarapu, H. F. Zeng, K. H. Hung and B. Wei, ACS Nano, 2009, 3, 2199–2206 CrossRef CAS PubMed.
- H. Guan, L.-Z. Fan, H. Zhang and X. Qu, Electrochim. Acta, 2010, 56, 964–968 CrossRef CAS.
- R. S. Ray, B. Sarma, A. L. Jurovitzki and M. Misra, Chem. Eng. J., 2015, 260, 671–683 CrossRef CAS.
- B. Wang, J. Park, D. Su, C. Wang, H. Ahn and G. Wang, J. Mater. Chem., 2012, 22, 15750–15756 RSC.
- J. Tang, J. Shen, N. Li and M. Ye, Ceram. Int., 2014, 40, 15411–15419 CrossRef CAS.
| This journal is © The Royal Society of Chemistry 2017 |

