 Open Access Article
A strategy to speed up formation and strengthen activity of biofilms at low temperature†
Huizhi Hua,
Junguo He *a,
Huarong Yua,
Jian Liub and
Jie Zhanga
aSchool of Municipal and Environmental Engineering, Harbin Institute of Technology, 73 Huanghe Road, Harbin, China. E-mail: junguohe@263; Fax: +86-0451-86289099; Tel: +86-0451-86289099
bCentral and Southern China Municipal Engineering Design and Research Institute Co., Ltd., 41 Jiefang Park Rord, Wuhan, China
First published on 26th April 2017
Abstract
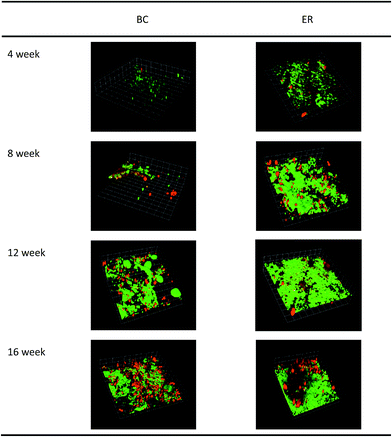
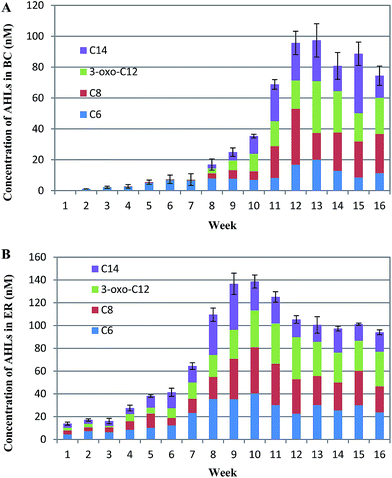
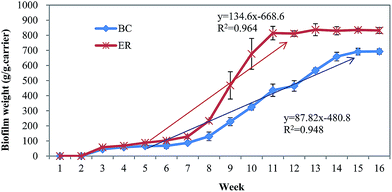
The start-up period of biofilm reactors often takes a long time to obtain a mature and stable biofilm, especially at low temperature. We performed a long-term study to investigate a strategy to improve biofilm formation and activity at low temperature (about 14 °C). A 25% increase in the speed of biofilm formation was observed with addition of a 50 nM N-acylhomoserine lactone (AHL) mixture, yielding a sustained increase of more than 20% in biofilm activity and pollutant removal, finally resulting in shortening the start-up phase. Enhanced bacterial attachment to the suspended carrier's surface was confirmed with confocal laser scanning microscopy (CLSM). The low level of polysaccharides (PS)/proteins (PN) at the end of biofilm formation with AHL addition also suggested that the effects of AHLs on PS production are more obvious than for PN. Analyses of the bacterial community by high-throughput sequencing showed a decrease in species diversity and a marked increase in most of the AHL-related microbial community members in an experimental reactor (ER). This work may offer a feasible approach to shorten the start-up phase of biofilm reactors and enhance biofilm performance at low temperature.
1 Introduction
Biofilm reactors have been widely used in the degradation of industrial and municipal wastewater for more than 20 years. The results from laboratory and field pilot-scale studies have consistently illustrated the technical advantage of biofilms over most other suspended systems.1 The main advantages of a biofilm reactor are derived from its ability to retain a high reactor biomass concentration.2 Meanwhile, it occupies little space compared to other reactors with similar capacity. Thus, cultivating a good biofilm is the core of achieving the best performance of biofilm reactors. Numerous studies have been performed on the factors affecting biofilm formation during the early period of operation. The start-up period often takes a long time to obtain mature attached biofilms in the system, sometimes up to half a year, especially at low temperature. In the northeast and north China, the temperature of the water can decrease to approximately 10 °C in winter. The performance of biological wastewater treatment is variable during this time. Low temperatures can decrease biological activity and prolong the generation time of biofilms.3 Moreover, in the initial phase of biofilm formation, adhesion to the carrier is fragile and the early biofilm is often dislodged, further reducing reactor efficiency. Accelerating the stable formation of biofilm will shorten the start-up time and increase removal efficiency of a reactor in cold areas, significantly improving the wastewater treatment process.Biofilm is a highly structured microbial community in which functionally synergistic microbes are frequently self-immobilized. Although biofilm formation is a multiple-step process and determined by a variety of physicochemical forces (hydrodynamic force, diffusion force, gravity force, etc.) and biological forces (production of extracellular polymer, growth of cellular clusters, metabolic changes, etc.),4 aggregation of microbes can be the key to the biofilm development. Biofilm formation and behavior depends not only on environmental conditions but also on bacterial species modifying their behavior in a coordinated fashion by a type of cell-to-cell signaling known as quorum sensing (QS).5 The signals are synthesized by bacteria and detected as a means to gauge population density. When the population density reaches a threshold, signal molecules regulate gene expression. Structurally, QS signal molecules fall into a wide range of chemical classes including oligopeptides, N-acylhomoserine lactones (AHLs), and autoinducer-2s (AI-2). QS auto-inducers in Gram negative bacteria generally belong to the AHL family.6 Previous studies have indicated that AHLs are strongly associated with the processes of biofilm formation.7,8 With appropriate molecular structures AHLs are therefore likely to improve microbial activity, and regulate extracellular polymeric substances (EPS) production, thus improving reactor performance.9
An ongoing question is if AHL effects are significant in complex culture biofilm in water, and wastewater treatment systems at the launch stage. In such systems, initial biofilm formation and subsequent biofilm behavior may be mediated by non-AHL species due to not all of the community members are capable of QS. Thus, it is important to elucidate the role of AHLs and AHL-related bacteria in biofilm formation process. Previous studies have focused primarily on AHL production in pure cultures, or the role of AHLs in microbial communities.10,11 In contrast, little is known about exogenous AHL signals facilitating biofilm formation in complex communities, and to our knowledge, few prior publications have studied the relationship of artificially strengthening QS and biofilm formation in the initial phase at low temperature. Although the role of AHLs on biofilm formation has been characterized, the effect of low temperature on AHLs mediating the attached-growth and formation efficiency of biofilm with a complex microbial community needs a deeper understanding.
Previously, we performed a long-term study to investigate the links between AHLs and the organization and composition of complex microbial communities when biofilm develop.12 Further research found that the concentration of AHLs regulate the activity of biofilm, characteristics of sludge, and increases pollutant removal performance in mature biofilm systems.13 In the present study, a laboratory-scale sequencing batch biofilm reactor (SBBR) operating at 14 °C was dosed with AHLs at the start of reactor running, to determine the impact of exogenous AHLs on biofilm formation in the initial phase at low temperature. The aims of this research were to gauge the importance of exogenous AHLs in biofilm formation at low temperature, thus providing a strategy for achieving strengthened biofilm activity and reduced start-up times in cold areas.
2 Materials and methods
2.1 Bioreactor operation
In this study two identical sequencing batch biofilm reactors were constructed. The reactors consisted of polypropylene sphere fillers (diameter of 80 mm, mean specific surface area of 350 m2 m−3 and specific weight of 8.3 kg m−3) and were operated for 120 days at low temperature. Temperature was maintained approximately at 14 °C by a thermostat (GDH-4006, SCIENTZ) with circulating cool water. Next, 50 nM AHL mixture was added to SBBR-1 (ER) at each day during the feeding phase, and no AHLs were added to SBBR-2 which was a blank control (BC). Four kinds of AHL (C6-HSL, C8-HSL, 3-oxo-C12-HSL and C14-HSL) mixed together with the same concentration (50 nM). Each AHL was dissolved in deionized water and stored at −20 °C. Common QS signal threshold values are in the nanomolar range, although higher threshold concentrations have been reported.14 The types added were determined based on the AHL types in the BC and the concentration was based on the results of our previous research. The adding AHL are equivalent to 17.2–44.4 μg L−1 of COD. The bioreactor operation involved an 8 h cycle with two continuous phases of feeding (0.25 h), anaerobic (1.75 h), aerobic (4 h), anoxic (1 h), settling (0.75 h), and decanting (0.25 h). Seeding sludge used in this study was taken from the returned sludge of settling tank in Harbin wastewater treatment plant (Harbin, China). The sludge traits: sludge volume index (SVI) was 78, mixed liquor suspended solids (MLSS) was 9.3 g L−1 and mixed liquor volatile suspended solids (MLVSS) was 6.5 g L−1.A total of 6 L synthetic wastewater (†) was fed to the bioreactor during the feeding stages and 6 L of treated effluent was discharged at the end of the cycle. The feed water properties were in ESI Table S3.† Air was supplied through diffusers placed at the bottom of the tank. The dissolved oxygen (DO) concentrations were maintained in the range of 2–4 mg L−1 (aerobic period) and 0.2–0.5 mg L−1 (anoxic period), respectively, measuring with a multi-parameter water quality digital analyzer (HQ30D, HACH).
2.2 Analytical methods
Influent and effluent samples were collected weekly and analyzed for chemical oxygen demand (COD), ammonia nitrogen (NH4+–N), total nitrogen (TN), total phosphorus (TP), SVI, MLSS, and MLVSS analysis according to standard methods.15 Five milliliter aliquots of mixed sludge suspension were collected at the end of the anoxic stage and stored at −20 °C for subsequent extracellular polymeric substances (EPS) analysis. Similarly, 1 L aliquots of treated effluent were kept at −80 °C after sampling for later extraction of AHLs.To calculate the mean biofilm weight, the samples were scraped out from the suspended carrier to a beaker to analyze weight from the second week of operation.12
2.3 EPS analysis
Extraction of EPS from the sludge biomass was performed using the cation exchange resins (CER) method as described by Frolund et al.16 Polysaccharides were quantified by the phenol-sulfuric acid method with glucose as the standard reference,17 and protein component was measured by the modified Lowry method18 with bovine serum albumin (Sigma-Aldrich, America) as the standard. All quantification was conducted in triplicate and averaged.2.4 Detection of AHLs by solid phase extraction (SPE) – ultra performance liquid chromatography/tandem mass spectrometry (UPLC-MS/MS)
Extraction of AHLs from sludge supernatants was conducted as described by Hu et al.12 All samples were detected by Waters Acquity UPLC (Waters, America) coupled with mass spectrometry at a flow rate of 0.15 mL min−1. The targets were separated on BEH C18 column (2.1 × 50 mm) filled with packing material with 1.7 μm particle size.The parameters of electrospray ionization were shown in ESI Table S4.† N-Hexanoyl-L-homoserine lactone (C6-HSL), N-octanoyl-L-homoserine lactone (C8-HSL), N-(3-oxododecanoyl)-L-homoserine lactone (3-oxo-C12-HSL), and N-tetradecanoyl-DL-homoserine lactone (C14-HSL) were purchased from Sigma-Aldrich (America) and stored at −20 °C.
2.5 Genomic DNA extraction and sequencing analysis for community composition
Total DNA was extracted from activated sludge using PowerSoil DNA Isolation Kit (MoBio, USA) according to the manufacturer's instructions. DNA quality concentrations were determined by a spectrophotometer (NanoDrop 2000, USA). Sequencing of the bacterial 16S rDNA was carried out on the Ion Torrent system by Sangon Biotech (Shanghai, China) company. The V3 hypervariable region of bacterial 16S rDNA gene was amplified using the universal primers BSF8 (5′-AGA GTT TGA TCC TGG CTC AG-3′) and BSR534 (5′-ATT ACC GCG GCT GCT GG-3′) with 10 nt barcodes (Sangon, China). PCR amplification was performed with an ABI Veriti system (Applied Biosystems, USA) according to a previous study.122.6 Determining the capability and activity of the biofilm
Dehydrogenase activity measurements were carried out according to Jurecska et al.19 To evaluate the biofilm pollutant removal ability, 10 g of biofilm was washed from two reactors after the biofilm completed forming and resuspended in synthetic wastewater. The incubation temperature and operation method were the same as mentioned above in 2.1. Two bottles were incubated for four experimental cycles. The test was calculated by comparing the changes in the removal rate for NH4+–N, TN, TP and COD. Each experiment was analyzed in triplicate and data significance was evaluated with independent-samples T test.2.7 Image collection and analysis
The three-dimensional structure of biofilm was visually monitored with confocal laser scanning microscope (CLSM, Nikon, Japan). Samples were cut into 1 cm length and rinsed with phosphate-buffered saline (PBS) three times, then stained with a two nucleic acid-binding stains mixture: SYTO9 (10 μM) (Molecular Probes, America) and Concanavalin A (Molecular probes, America) conjugate with tetramethylrhodamine (200 μg mL−1). SYTO9 stains all viable bacteria in green, while Concanavalin A stains EPS polysaccharides. After 30 mins of colonization in the dark, the non-adhering stains were removed by PBS three times. Immediately after, samples were analyzed by CLSM coupled with the UltraVIEW VoX imaging system. Image analysis was performed using Volocity software (PerkinElmer, America).2.8 Statistical analysis
All statistical analyses were carried out with SPSS software version 17.0 for Windows (SPSS, Chicago, IL, USA). ANOVAs was conducted to examine differences between various samples, and correlations were considered statistically significant at a confidence interval (p < 0.05). Every experiment was repeated 3 times for the statistical tests.3 Results and discussions
3.1 Biofilm growth process
The pollutant removal rates also merit consideration as AHLs dosing may have an impact on bioreactor performance.23 We quantified removal rates of COD, NH4+–N, TN, and TP during the development of biofilm. From results reported in ESI Fig. S1,† removal of COD, TN and TP were rather erratic during biofilm formation. At the beginning of biofilm formation, the mean removal efficiency of COD and nutrients were at relatively low levels (<80%). This was followed by an increase in removal rates of COD and nutrients as biofilm formed. Stable and high removal efficiency for COD and nutrients were achieved once the compact biofilm was formed and had increased in biomass. Compared with the BC, the addition of the signal molecules accelerated COD and ammonia degradation via improving the biofilm activity, indicating that the signal molecules played a clear role in enhancing removal efficiency. The removal efficiency of COD in ER increased approximately 10% compared with BC at the end of experiment. Additionally, nitrification of NH4+–N was found to be 5% higher in ER than BC (p < 0.05). However, the removal performance of TP did not have significant difference between two bioreactors (p > 0.05), which showed that the addition of the AHLs has no positive impact on the TP removal. In addition to faster biofilm formation in ER, this indicates that quorum sensing molecules contributed to improved performance of the biofilm reactor at low temperature. Notably, in addition to a shortening in reactor start-up time by about 4 weeks, biofilms in ER were strengthened and displayed greater adhesion, resulting in improved stability and reactor efficiency. Previous study has verified that AHLs can affect bacteria communities, likely through immobilizing other functional microorganisms, and consequently, facilitate granulation and performance of reactors.23 The phenomenon in this study also indicates artificially intensified QS system may be a feasible way to regulate the bacteria behavior and promote biofilm formation at low temperature.
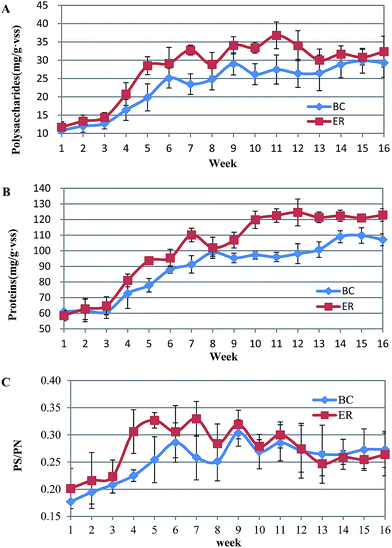
The ratio of the polysaccharide to protein ratio (PS/PN) derived at different reactors was significantly different. Consistent with the EPS profile, PS/PN increased during initial phase of biofilm formation (BC: 0.18 ± 0.03 (week 1) vs. 0.25 ± 0.04 (week 5), p = 0.085; ER: 0.20 ± 0.03 (week 1) vs. 0.32 ± 0.01 (week 5), p = 0.009) followed by a slight fluctuation from week 6. Specifically, a promising high level of PS/PN occurred when incubated with AHLs. ER activated sludge contained a higher PS/PN ratio and the differences were maintained until week 11. For the later phase, the PS/PN ratio in BC ranged among 0.26 to 0.29 whereas that of ER decreased to around 0.25 (Fig. 4C). The significant (p < 0.05) difference indicated that the negative effects of AHLs on PS production are more obvious than PN. Polysaccharides are hydrophilic polymers, with the ability to absorb and exude water or biological fluids, and contribute to gel-like properties of biofilm. A high content of polysaccharide is usually viewed as being detrimental to settling and dewatering properties. Some studies have suggested that EPS composition and properties rather than the quantity, are more important in sludge flocculation. Note that in the present study although AHLs addition promoted the production of EPS, it is more likely to achieve the purpose of optimizing the biofilm structure by controlling the secretion of polysaccharide.
3.2 Biofilm formed completely
Although we obtained direct evidence for biofilm increase in the AHL-mediated reactor, a more crucial question about whether these AHLs affect biofilm characteristics and the bacteria at low temperature remained to be determined. It is very important to clarify the roles of the QS communication system in biofilm reactors. Therefore, completely formed biofilms were selected for the following batch test, and the biofilm characteristics and microbial population were compared.| Parameters | BC | ER | Increase (%) | P |
|---|---|---|---|---|
| Biofilm density | 448.33 ± 17.62 | 632.67 ± 15.5 | 41.21 ± 4.61 | 0.022 |
| Total-TTC (μg TPF per g carrier) | 4.79 ± 0.21 | 5.87 ± 0.18 | 22.73 ± 3.22 | 0.003 |
| EPS | 129.03 ± 3.98 | 146.92 ± 4.43 | 13.97 ± 4.79 | 0.006 |
| PS | 27.61 ± 2.22 | 30.69 ± 1.73 | 12.20 ± 3.35 | 0.01 |
| PN | 107.08 ± 3.28 | 122.90 ± 3.26 | 14.78 ± 0.49 | 0.01 |
| PS/PN | 0.26 ± 0.03 | 0.25 ± 0.03 | −2.34 ± 4.92 | 0.01 |
| COD removal rate (mg COD g per biofilm per day) | 27.05 ± 1.37 | 35.26 ± 2.43 | 30.33 ± 4.02 | 0.007 |
| NH4+–N removal rate (mg NH4−–N g per biofilm per day) | 1.82 ± 0.03 | 2.11 ± 0.03 | 16.55 ± 3.27 | 0.009 |
| TN removal rate (mg TN g per biofilm per day) | 2.35 ± 0.02 | 2.57 ± 0.03 | 9.36 ± 0.85 | 0.109 |
| TP removal rate (mg TP g per biofilm per day) | 0.20 ± 0.06 | 0.24 ± 0.06 | 39.14 ± 5.64 | 0.363 |
With the aim to further clarify the effects of exogenous AHLs on the activities of biofilm, especially whether it changes pollutants removal capacity, a batch test was explored in this investigation (Table 1). By comparing the pollutant efficiency of two reactors, we can see the values in AHL-mediated biofilm clearly increased. Biofilm performance was maintained around 27.05 mg COD g per biofilm per day in BC, while a significant (p = 0.007) increase in biofilm treatment efficiency occurred in ER, to 35.26 mg COD g per biofilm per day. The more than 30% enhancement indicates the positive effects of AHLs on biofilm activity. The addition of AHLs also produced a notable increase (p < 0.01) biofilm activity on ammonia nitrogen removal from 1.82 to 2.11 mg NH+4–N g per biofilm per day, meaning more than 15% increase. However, the TN and TP removal performance of biofilm between two reactors did not have a significant difference (p > 0.05), which was consistent with the study on pollutant removal efficiency above. Increasing evidence has indicated that nitrifying bacteria are strongly affiliated with quorum sensing signal molecules, especially to AHLs. Addition of AHLs to nitrifying biofilm can increase the biomass and accelerate the recovery of damaged biofilm rapidly.10,27 Furthermore, one gene (nmuI) was identified as playing a role in generating a protein with high levels of similarity to N-acyl homoserine lactone (AHL) synthase protein families in Nitrosospira multiformis. Two AHLs (C14-HSL and 3-oxo-C14-HSL) were detected using an AHL biosensor and liquid chromatography-mass spectrometry (LC-MS) when nmuI, producing a LuxI homolog, was introduced into Escherichia coli.28 We also found that additional signal molecules affected the ratio of nitrifying bacteria in total bacteria in our previous experiments.13 Consequently, it is reasonable that the addition of AHLs could improve the activity of biofilm. Then, the enhanced biofilm would contribute to improving the bioreactor performance. Additionally, adding the AHLs might just increase the activity of certain bacteria for the reason that nitrogen and COD removal rates increase apparently in AHL-medicated biofilm.
| Sample ID | *Seq num | *OTU num | Shannon index | Chao1 index | Coverage |
|---|---|---|---|---|---|
| a *Seq num = sequence number; *OTU num = operational taxonomic unit number; *BC = blank control; *ER = experimental reactor. | |||||
| *BC1 | 11![[thin space (1/6-em)]](https://www.rsc.org/images/entities/char_2009.gif) 894 894 |
703 | 7.32 | 931.37 | 0.9821 |
| BC2 | 12![[thin space (1/6-em)]](https://www.rsc.org/images/entities/char_2009.gif) 948 948 |
688 | 7.47 | 862.45 | 0.9704 |
| BC3 | 12![[thin space (1/6-em)]](https://www.rsc.org/images/entities/char_2009.gif) 132 132 |
631 | 7.59 | 1001.39 | 0.9832 |
| Average BC | 12![[thin space (1/6-em)]](https://www.rsc.org/images/entities/char_2009.gif) 324 324 |
674 | 7.46 | 931.74 | 0.9786 |
| *ER1 | 12![[thin space (1/6-em)]](https://www.rsc.org/images/entities/char_2009.gif) 032 032 |
640 | 7.69 | 838.24 | 0.9844 |
| ER2 | 11![[thin space (1/6-em)]](https://www.rsc.org/images/entities/char_2009.gif) 384 384 |
760 | 8.14 | 907.11 | 0.9739 |
| ER3 | 11![[thin space (1/6-em)]](https://www.rsc.org/images/entities/char_2009.gif) 271 271 |
707 | 7.67 | 849.00 | 0.9865 |
| Average ER | 11![[thin space (1/6-em)]](https://www.rsc.org/images/entities/char_2009.gif) 562 562 |
702 | 7.83 | 864.78 | 0.9816 |
At the genus level, top 54 most abundant community members (relative abundance > 0.5%) were calculated to state the changes in microbial species abundance in two reactors. The microbial community members were divided into four clusters: QQ, QS, QQ&QS/none (bacteria can both produce and degrade quorum signal, or can neither produce nor degrade it) and others (bacteria that have not been tested in terms of its ability on quorum signal production and degradation) according to previous research.29,30 Community members in Fig. 5A showed QQ activity. N-Acyl homoserine lactone-degrading bacteria are very diverse and the most prevalent genus in three samples was: Brevundimonas, Microbacterium, Comamonas, Pedobacter, Mesorhizobium and Variovorax. Abundances of the QQ bacteria were significantly changed (p < 0.05), which suggested that the formation of biofilm has a great impact on the community structure of the reactor, with or without addition of AHLs. The Variovorax bacterium, representing cluster 1, has been isolated from soil and has been demonstrated to utilize N-(3-oxohexanoyl)-L-homoserine lactone as the sole source of energy and nitrogen.31 Members in Fig. 5B represented AHL-producing bacteria. Although only five genera were identified in this cluster, all the levels of them in the ER samples were considerably higher than in the blank reactor expect Xanthomonadaceae (p < 0.01), which indicates that adding signal molecules positively affects AHL-producing bacteria. Microorganisms in cluster 3, which accounted for >25% of the top 54 most abundant community members, were QQ&QS/none bacteria (Fig. 5C). This kind of bacteria is highly diverse and falls within a large number of species among α-, β-, γ-proteobacteria.32 AHLs addition positively affects cluster 3 bacteria for the numbers of most bacteria in ER were significantly higher than that of in the initial phase and in BC, especially for Flavobacterium, Rhizobium and Thermomonas (p < 0.05). In Fig. 5D, there was no obvious trend between two bioreactors in each genus. The value of bacteria that have not been tested in terms of its ability on quorum signal production and degradation didn't increase after AHL addition. This indicated that the effect of adding AHL on QS/QQ irrelevant bacteria was not significant.
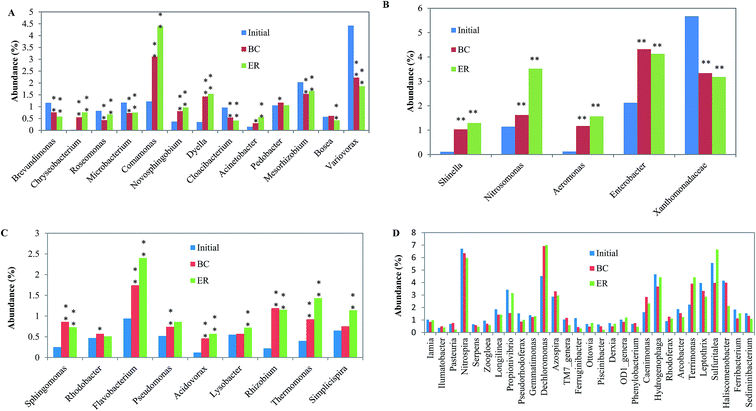 | ||
| Fig. 5 Taxonomic classification of the bacterial communities at genus level. *: p < 0.05; **: p < 0.01. | ||
The ratios of most abundant microbial community members significantly changed after addition of AHLs. For example, Acinetobacter and Propionivibrio were found to increase ratio in the community by above 86% and 103% than that of in BC, respectively. The addition of these AHLs also resulted in the decrease of some dominant bacteria, such as Piscinibacter and Pasteuria, for the ratio from 0.49 to 0.22 and from 0.76 to 0.24 compared with BC. The addition of AHLs was in such low concentration that the observed changes are unlikely to cause by using AHLs as a carbon and/or nitrogen source. This might be associated with AHL regulating gene expression in the reactor and the ensuing expression of the AHL-regulated phenotypes leading to changes in community composition and function. Signaling molecules were verified to have profound effects on the stability and balance of the original microbiological community. The addition of AHLs to sludge samples changed the community composition. Furthermore, exogenous signal molecular could activate bacteria by inducing the production of endogenous signal molecular by anammox cultures.11 These studies indicate that the parameters of the microbial community could be tuned through selectively manipulating AHL activity. This study also emphasizes the importance of QQ and QS as well as their roles in activated sludge system. QQ and QS are two antagonistic processes that extensively exist in the environment. When considerable quantities of AHLs were introduced, the balance of the original ecosystem was ended, and, subsequently produced a new balance. The antagonism between QQ and QS bacteria in a bioreactor provides a promising target for tuning operational performance.33 Therefore, control of QQ and QS in the system could be a promising solution for the existing problem of biofilm reactor.
4 Conclusions
In this study, the effect of exogenous AHLs on promoting biofilm formation at low temperature was confirmed. The addition of AHL could not only shorten biofilm formation time, but also improve the performance of biofilm. The changes in microbial community demonstrate that AHL-mediated gene expression plays a role in mediating the composition of a biofilm community by strengthening the function of quorum sensing related bacteria. The addition of exogenous AHLs also changed the balance between QS and QQ, and in this way influenced the efficiencies of the bioreactor. Our results clearly indicate that introduction of exogenous signaling molecules in biofilm reactors might provide a new approach to accelerate the biofilm start-up process and enhance biofilm performance at low temperature.Acknowledgements
Special acknowledgement is to Huarong Yu for technical assistance.References
- S. V. Mohan, B. V. Lalit, B. Y. Vijaya and P. N. Sarma, Bioresour. Technol., 2007, 98, 1373–1379 CrossRef CAS PubMed.
- P. Falås, A. Baillon-Dhumez, H. R. Andersen, A. Ledin and J. L. Cour Jansen, Water Res., 2012, 46, 1167–1175 CrossRef PubMed.
- R. Cresson, H. Carrere, J. P. Delgenes and N. Bernet, Biochem. Eng. J., 2006, 30, 55–62 CrossRef CAS.
- N. C. Boelee, H. Temmink, M. Janssen, C. J. N. Buisman and R. H. Wijffels, Water Res., 2011, 45, 5925–5933 CrossRef CAS PubMed.
- S. Raina, M. Odell and T. Keshavarz, J. Biotechnol., 2010, 148, 91–98 CrossRef CAS PubMed.
- K. Winzer, K. R. Hardie and P. Williams, Curr. Opin. Microbiol., 2002, 5, 216–222 CrossRef CAS PubMed.
- T. T. Ren, X. Y. Li and H. Q. Yu, Bioresour. Technol., 2013, 129, 655–658 CrossRef CAS PubMed.
- C. H. Tan, K. S. Koh, C. Xie, M. Tay, Y. Zhou, R. Williams, W. J. Ng, S. A. Rice and S. Kjelleberg, ISME J., 2014, 8, 1186–1197 CrossRef CAS PubMed.
- J. D. Shrout and R. Nerenberg, Environ. Sci. Technol., 2012, 46, 1995–2005 CrossRef CAS PubMed.
- X. Tang, S. Liu, Z. Zhang and G. Zhuang, Chem. Eng. J., 2015, 273, 184–191 CrossRef CAS.
- A. J. Li, B. L. Hou and M. X. Li, Bioresour. Technol., 2015, 196, 550–558 CrossRef CAS PubMed.
- H. Z. Hu, J. G. He, J. Liu, H. Y. Yu, J. Tang and J. Zhang, RSC Adv., 2016, 6, 11128–11139 RSC.
- H. Z. Hu, J. G. He, J. Liu, H. Y. Yu and J. Zhang, Bioresour. Technol., 2016, 211, 339–347 CrossRef CAS PubMed.
- Y. L. Huang, S. Dobretsov, J. S. Ki, L. H. Yang and P. Y. Qian, Microb. Ecol., 2007, 54, 384–392 CrossRef CAS PubMed.
- APHA, Standard Methods for the Examinations for Water and Wastewater (APHA), American Public Health Association, Washington, DC, USA, 21st edn, 2005 Search PubMed.
- B. Frolund, R. Palmgren, K. Keiding and P. H. Nielsen, Water Res., 1996, 30, 1749–1758 CrossRef.
- M. Dubois, K. A. Gilles, J. K. Hamilton, P. A. Rebers and F. Smith, Anal. Chem., 1956, 28, 350–356 CrossRef CAS.
- E. F. Hartree, Anal. Biochem., 1972, 48, 422–427 CrossRef CAS PubMed.
- L. Jurecska, K. Barkács, E. Kiss, G. Gyulai, T. Felföldi, B. Törő, R. Kovács and G. Záray, Microchem. J., 2013, 107, 108–114 CrossRef CAS.
- M. F. Siddiqui, M. Sakinah, L. Singh and A. W. Zularisam, J. Biotechnol., 2012, 161, 190–197 CrossRef CAS PubMed.
- Y. H. Dong and L. H. Zhang, J. Microbiol., 2005, 43, 101–109 CAS.
- X. N. Song, Y. Y. Cheng, W. W. Li, B. B. Li, G. P. Sheng, C. Y. Fang, Y. K. Wang, X. Y. Li and H. Q. Yu, Bioresour. Technol., 2014, 171, 472–476 CrossRef CAS PubMed.
- L. Li, M. Zheng, H. Ma, S. Gong, G. Ai, X. Liu, J. Li, K. Wang and X. Dong, Appl. Microbiol. Biotechnol., 2015, 99, 6471–6480 CrossRef CAS PubMed.
- L. Yang, Y. Hu, Y. Liu, J. Zhang, J. Ulstrup and S. Molin, Environ. Microbiol., 2011, 13, 1705–1717 Search PubMed.
- B. K. Hwang, W. N. Lee, K. M. Yeon, P. K. Park, C. H. Lee, I. S. Chang, A. Drews and M. Kraume, Environ. Sci. Technol., 2008, 42, 3963–3968 Search PubMed.
- A. Caravelli, L. Giannuzzi and N. Zaritzky, Water Res., 2004, 38, 2395–2405 Search PubMed.
- S. Batchelor, M. Cooper, S. Chhabra, L. Glover, G. Stewart, P. Williams and J. Prosser, Appl. Environ. Microbiol., 1997, 63, 2281–2286 Search PubMed.
- J. Gao, A. Ma, X. Zhuang and G. Zhuang, Appl. Environ. Microbiol., 2014, 80, 951–958 Search PubMed.
- H. Lade, D. Paul and J. H. Kweon, Int. J. Mol. Sci., 2014, 15, 2255–2273 Search PubMed.
- C. H. Tan, K. S. Koh, C. Xie, J. Zhang, X. H. Tan, G. P. Lee, Y. Zhou, W. J. Ng, S. A. Rice and S. Kjelleberg, Npj Biofilms and Microbiomes., 2015, 1, 15006 Search PubMed.
- J. R. Leadbetter and E. P. Greenberg, J. Bacteriol., 2000, 182, 6921–6926 CrossRef CAS PubMed.
- C. D. Angelo-Picard, D. Faure, I. Penot and Y. Dessaux, Environ. Microbiol., 2005, 7, 1796–1808 CrossRef PubMed.
- H. R. Yu, G. R. Xu, F. S. Qu, G. B. Li and H. Liang, Appl. Microbiol. Biotechnol., 2016, 100, 7887–7897 CrossRef CAS PubMed.
Footnote |
| † Electronic supplementary information (ESI) available. See DOI: 10.1039/c7ra02223a |
| This journal is © The Royal Society of Chemistry 2017 |

