 Open Access Article
Sorghum core-derived carbon sheets as electrodes for a lithium-ion capacitor†
Xiaonan Xu,
Yongpeng Cui,
Jing Shi*,
Wei Liu ,
Shougang Chen,
Xin Wang and
Huanlei Wang
 *
*
Institute of Materials Science and Engineering, Ocean University of China, Qingdao 266100, China. E-mail: shijing@ouc.edu.cn; huanleiwang@gmail.com; Tel: +86 532 66781906
First published on 20th March 2017
Abstract
We use sorghum core-derived carbon sheets (SCDCS) as electrodes for a lithium-ion capacitor due to their large specific surface area (1122 m2 g−1) and sheet-like structure. A lithium-ion capacitor with high energy density is fabricated using SCDCS as both the negative and positive electrodes, in which the potential of the electrode is adjusted to obtain equal capacity in both the negative and positive electrodes. The lithium-ion capacitor demonstrates a high energy density of 124.8 W h kg−1 at a power density of 107 W kg−1, and maintains 59.5 W h kg−1 at a high power density of 10![[thin space (1/6-em)]](https://www.rsc.org/images/entities/char_2009.gif) 508 W kg−1. The capacity retention ratio is 66% for the fabricated lithium-ion capacitor after 5000 cycles at a current of 10 A g−1, indicating that this lithium-ion capacitor is promising for fast energy storage.
508 W kg−1. The capacity retention ratio is 66% for the fabricated lithium-ion capacitor after 5000 cycles at a current of 10 A g−1, indicating that this lithium-ion capacitor is promising for fast energy storage.
Introduction
In modern society, electric vehicles, mobile phone batteries and other electronic devices are widely used. Electrochemical energy storage systems play a vital role in powering these devices. Lithium-ion batteries and supercapacitors are the two main types of energy storage systems.1,2 The energy density of lithium-ion batteries is high, but lithium-ion batteries also face the disadvantages of low power density and poor cycle stability. Conversely, supercapacitors can provide high power density and long cycle stability, but their energy density is relatively low.3,4 In order to achieve both high energy and high power, one of the promising approaches is to assemble a hybrid device, which combines the advantages of lithium-ion batteries and supercapacitors.5,6 The hybrid device is usually defined as a lithium-ion capacitor, which consists of two parts: the lithium-ion rechargeable battery negative part and double-layer capacitor positive part.7,8 Usually, the charges (q) stored at the negative and positive electrodes should be equivalent. At present, adjusting the electrode potential and controlling the mass ratio of positive and negative electrodes are the two main ways to achieve charge balance in both electrodes.6,9 It is well-acknowledged that the charge balance between the two electrodes follows q+ = q−, where the charge stored in the electrode depends on the specific capacity (Q) and the mass (m) of the electrode (q = Q × m).9 In order to obtain q+ = q−, the mass ratio between the positive and negative electrodes should be expressed as: m+/m− = Q−/Q+. It is worth noting that the maximum capacity of lithium-ion capacitors can be achieved when Q+ = Q− and m+ = m−.10 Therefore, adjusting the potential of the electrodes to get an equivalent specific capacity at both positive and negative electrodes with the same mass is a more efficient way to obtain high energy and power devices.11Currently, carbon materials, including carbon nanotubes,12 graphene,6 and porous carbons,13 are the dominant electrodes for electrochemical energy storage. Tuning the structure of the carbons is important for achieving favorable electrochemical properties. At present, graphene, a two-dimensional carbon material with good electrical conductivity and a high surface area (theoretically 2630 m2 g−1), is favored for fast charge storage.14 However, the synthesis of graphene is still relatively complex, and low-cost industrial production of high-quality graphene is still facing some challenges.6 Therefore, designing low-cost graphene-like carbon as a substitute for graphene is desirable. Recently, low-cost biomass has been widely used to design graphene-like carbon based on the intrinsic structure of the precursor.15 Moreover, the intrinsic composition of the precursor can also result in functionalized carbons, which can introduce additional reversible capacity to the electrodes.13 For example, oxygen-containing functional groups in the carbon matrix can contribute to the pseudocapacity of the electrode, enhancing its total capacity.16 In this work, we demonstrate a facile method to prepare sheet-like carbon using the core of sorghum. Previously, sorghum was one of the five major cereals for human food. Sorghum rods including sorghum core, which are rich in crystalline cellulose, hemicellulose and lignin, can be collected as by-products.17 As previously reported, carbon obtained from carbonization of cellulose-based biomass usually has a high specific surface area, large pore volume and abundant acidic surface groups.18 Therefore, the cellulose-based sorghum core can be expected to be used as a precursor for the preparation of nanocarbons. The synthesis process of sorghum core-derived carbon is illustrated in Scheme 1. The sorghum core is firstly collected from sorghum rods, then the sorghum core is directly carbonized at high temperature. Finally, the carbonized sample is activated under air. The final product is designated Sorghum Core-Derived Carbon Sheet (SCDCS). SCDCS samples with high surface area and sheet-like morphology are beneficial for improving electrochemical performance. A lithium-ion capacitor is fabricated using SCDCS as both the positive and negative electrode, and a high energy density of 124.8 W h kg−1 can be obtained by optimizing the electrode potential.
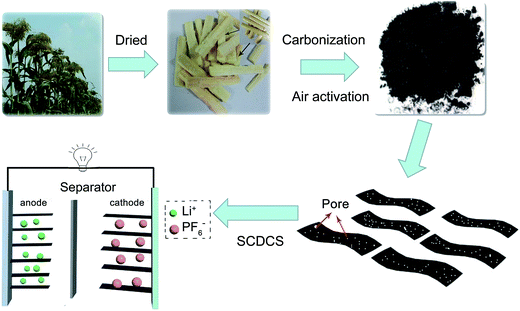 | ||
| Scheme 1 Schematic illustration of the preparation of SCDCS and the fabrication of SCDCS//SCDCS lithium-ion capacitor. | ||
Experimental
Material synthesis
The clean sorghum cores used in this work were collected from a sorghum field in Shandong Province, China. In this study, the outside rod of sorghum was removed, leaving the inside soft core. The collected sorghum cores were treated with deionized water at 80 °C for 1 hour, washed several times with ethanol and deionized water, then dried at 60 °C for 24 h to remove water-soluble inorganic salts. Next, the sorghum cores were carbonized in a tubular furnace at 1300 °C for 1 h with a heating rate of 3 °C min−1 under a nitrogen atmosphere. After cooling to room temperature, the resulting carbon material was further activated by air in a tubular furnace at 300 °C for 1 h. The obtained carbon was further recovered and washed with 2 M HCl and sufficient distilled water. Finally, the resultant carbon was dried at 100 °C overnight.Material characterization
Transmission electron microscopy (TEM) was carried out on a JEOL JEM-2010 transmission electron microscope. Scanning electron microscopy (SEM) was conducted on a Hitachi S-4800 scanning electron microscope. Nitrogen adsorption–desorption isotherms were measured using a Micromeritics 3 Flex™ analyzer at 77 K. The Raman spectra were measured at room temperature by Laser Confocal Micro-Raman Spectroscopy (LabRAM HR800). X-ray photoelectron spectroscopy (XPS) analysis was performed on a Thermo ESCALAB 250 XI multifunctional imaging electron spectrometer. X-ray diffraction (XRD) analysis was carried out on a Bruker D8 Advance powder diffractometer with a Cu-Kα radiation source.Electrochemical measurements
For the carbon electrode, a slurry of 80 wt% active material, 10 wt% poly(vinylidene fluoride), and 10 wt% super P in N-methyl-2-pyrrolidinone was well pressed on a stainless steel current collector. The mass loading of the active material was about 1 mg cm−2 for all the electrodes. All the electrochemical measurements were performed in CR2032 coin cells using 1 M LiPF6 (solution with a 1![[thin space (1/6-em)]](https://www.rsc.org/images/entities/char_2009.gif) :
:![[thin space (1/6-em)]](https://www.rsc.org/images/entities/char_2009.gif) 1 v/v mixture of ethylene carbonate/dimethyl carbonate) as the electrolyte. The half coin cells were fabricated using the as-prepared carbon as the working electrode, polyethene as the separator, and Li metal foil as the counter and reference electrode. The lithium-ion capacitor was assembled with two symmetrical pre-tuned carbon electrodes (charged to the optimized electrode potential) separated by a polyethene separator. Cyclic voltammetry (CV) and electrical impedance spectroscopy (EIS) were performed on a Gamry Interface 1000 electrochemical workstation. Galvanostatic charge–discharge measurements were performed with a LAND CT2001A battery test system at the current density of 0.1–50 A g−1 (or 0.1–50 mA cm−2).
1 v/v mixture of ethylene carbonate/dimethyl carbonate) as the electrolyte. The half coin cells were fabricated using the as-prepared carbon as the working electrode, polyethene as the separator, and Li metal foil as the counter and reference electrode. The lithium-ion capacitor was assembled with two symmetrical pre-tuned carbon electrodes (charged to the optimized electrode potential) separated by a polyethene separator. Cyclic voltammetry (CV) and electrical impedance spectroscopy (EIS) were performed on a Gamry Interface 1000 electrochemical workstation. Galvanostatic charge–discharge measurements were performed with a LAND CT2001A battery test system at the current density of 0.1–50 A g−1 (or 0.1–50 mA cm−2).
The CV and the galvanostatic charge–discharge curves of the lithium-ion capacitor were both recorded from 0 V to 4.3 V. The capacitance of the electrode was calculated according to the following formula:
 | (1) |
| P = Vave × I/m |
| E = P × t |
| Vave = (Vmax + Vmin)/2. |
Results and discussion
Structural characteristics of SCDCS
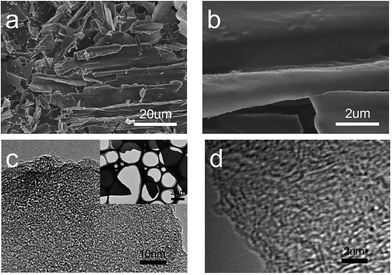
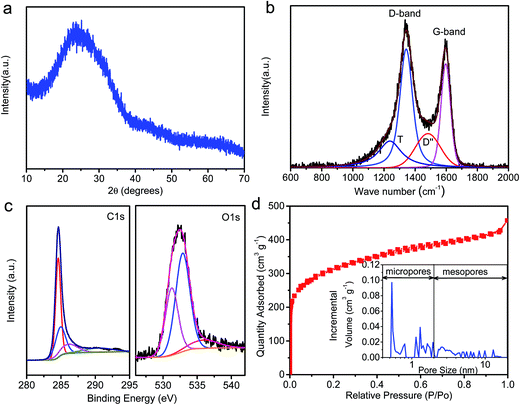
Fig. 1a and b show the SEM images of SCDCS, indicating the sheet-like morphology. The TEM image in Fig. 1c confirms that the SCDCS sample has a 2D morphology with randomly distributed micropores and mesopores in the carbon matrix. The carbons with interconnected hierarchical porosity and two-dimensional sheet-like structure are favorable for facilitating ion transport.19 The high-resolution TEM image (Fig. 1d) clearly evidences the amorphous structure of the carbon sheets with partially graphitic ribbons. This is further certified by the XRD and Raman analysis. As shown in Fig. 2a, SCDCS has two peaks at about 2θ = 25° and 45°, corresponding to the (002) and (100) planes of graphite.20 It is noteworthy that the (002) peak is very broad, indicating that the active substance has a disordered structure.17,21 The interlayer distance of graphitic layers (d002) is calculated to be 0.35 nm, which is higher than that of equilibrium graphite (0.3354 nm).22 Based on the well-known Scherrer equation, the thickness of the graphitic domains (Lc) is estimated to be 0.61 nm, suggesting that the carbonized product is composed of 1–2 stacked graphitic layers (i.e., 0.61/0.35 ≈ 1.74),23 in agreement with the TEM observation. In the Raman spectra (Fig. 2b), two typical bands for SCDCS at around 1350 and 1580 cm−1 are observed, which represent the disordered D-band and the graphitized G-band.23 Two additional peaks for the T-band (1240 cm−1) and the D′′-band (1480 cm−1) are usually observed in poorly organized carbons, which can be assigned to the graphitic disordered lattice/sp3 carbon and the amorphous sp2 carbon.24,25 The integrated ratio of IG/ID is 0.56, indicating that the graphitic layers in the carbon are highly defective.19,26,27XPS analysis was performed to evaluate the near-surface elemental composition and chemical states of the heteroatoms in the SCDCS sample, as shown in Fig. S1.† It is clear that SCDCS is rich in carbon and oxygen, with a small amount of nitrogen. The atomic ratio of carbon![[thin space (1/6-em)]](https://www.rsc.org/images/entities/char_2009.gif) :
:![[thin space (1/6-em)]](https://www.rsc.org/images/entities/char_2009.gif) nitrogen
nitrogen![[thin space (1/6-em)]](https://www.rsc.org/images/entities/char_2009.gif) :
:![[thin space (1/6-em)]](https://www.rsc.org/images/entities/char_2009.gif) oxygen is 93.82
oxygen is 93.82![[thin space (1/6-em)]](https://www.rsc.org/images/entities/char_2009.gif) :
:![[thin space (1/6-em)]](https://www.rsc.org/images/entities/char_2009.gif) 0.29
0.29![[thin space (1/6-em)]](https://www.rsc.org/images/entities/char_2009.gif) :
:![[thin space (1/6-em)]](https://www.rsc.org/images/entities/char_2009.gif) 5.89 for SCDCS (Table S1†). From Fig. 2c, we can see that the C 1s spectrum can be divided into four peaks, which are C
5.89 for SCDCS (Table S1†). From Fig. 2c, we can see that the C 1s spectrum can be divided into four peaks, which are C![[double bond, length as m-dash]](https://www.rsc.org/images/entities/char_e001.gif) C/C–C (284.6 eV), C–O/C–N (285–286 eV), C
C/C–C (284.6 eV), C–O/C–N (285–286 eV), C![[double bond, length as m-dash]](https://www.rsc.org/images/entities/char_e001.gif) O (288–289 eV) and COOH (290 eV).28 The O 1s spectrum can be divided into three peaks, including C
O (288–289 eV) and COOH (290 eV).28 The O 1s spectrum can be divided into three peaks, including C![[double bond, length as m-dash]](https://www.rsc.org/images/entities/char_e001.gif) O (O-I, 531–532 eV), C–OH and/or C–O–C (O-II, 533 eV), and COOH (O-III, 535–536 eV).16 The oxygen-containing functional groups can provide pseudocapacitance through oxidation and reduction of quinone (O-I) groups.9 As shown in Fig. 2d, the nitrogen adsorption isotherm of SCDCS is type I/IV with strong nitrogen uptake at a relatively low pressure range (P/Po < 0.01) and slightly steeper adsorption in a wide pressure range of 0.1–1.0, indicating that it contains both micropores and mesopores. According to the Brunauer–Emmett–Teller (BET) formula, the specific surface area of SCDCS is 1122 m2 g−1. Fig. 2d also shows the pore size distribution of the SCDCS sample. We found that SCDCS has a micropore proportion of 59.75% and a mesopore proportion of 40.25%. The hierarchical pore structure and large specific surface area can make the surface of SCDCS completely accessible by the electrolyte, which can facilitate ion transportation and ion intercalation.
O (O-I, 531–532 eV), C–OH and/or C–O–C (O-II, 533 eV), and COOH (O-III, 535–536 eV).16 The oxygen-containing functional groups can provide pseudocapacitance through oxidation and reduction of quinone (O-I) groups.9 As shown in Fig. 2d, the nitrogen adsorption isotherm of SCDCS is type I/IV with strong nitrogen uptake at a relatively low pressure range (P/Po < 0.01) and slightly steeper adsorption in a wide pressure range of 0.1–1.0, indicating that it contains both micropores and mesopores. According to the Brunauer–Emmett–Teller (BET) formula, the specific surface area of SCDCS is 1122 m2 g−1. Fig. 2d also shows the pore size distribution of the SCDCS sample. We found that SCDCS has a micropore proportion of 59.75% and a mesopore proportion of 40.25%. The hierarchical pore structure and large specific surface area can make the surface of SCDCS completely accessible by the electrolyte, which can facilitate ion transportation and ion intercalation.
Electrochemical performance of SCDCS for lithium-ion capacitor
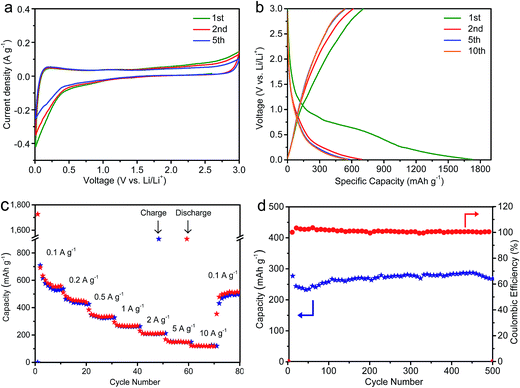
The SCDCS, with a high surface area, hierarchical porous structure, dilated and highly defective graphitic layer, and 2D sheet-like morphology, is quite promising for lithium-ion battery applications. To confirm this, the SCDCS was evaluated as a lithium-ion battery anode. Fig. 3a displays the CV curves of the SCDCS electrode at a scan rate of 0.1 mV s−1. A cathodic peak can be observed at 0–0.5 V; this peak is more pronounced in the first cycle, which is ascribed to the decomposition of the electrolyte, the formation of the solid electrolyte interface (SEI) layer, and the irreversible trapping of lithium ions in the carbon electrode.29 Moreover, a “box-like” CV curve can be observed at a potential higher than 0.5 V, suggesting a capacitive lithium storage behavior. Fig. 3b shows the galvanostatic charge–discharge curves of SCDCS for the 1st, 2nd, 5th, and 10th cycles at 0.1 A g−1. With the decrease of the potential window, the capacity is achieved by the electric double layer, the surface redox reaction of lithium ions with oxygen functional groups (i.e., –C![[double bond, length as m-dash]](https://www.rsc.org/images/entities/char_e001.gif) O + Li+ + e− → –C–O–Li), the faradic adsorption at the defective graphitic layers, and the lithium intercalation between the graphitic layers.9 The first discharge/charge capacity is 1726/709 mA h g−1, indicating an initial Coulomb efficiency of 41.1%. The irreversible capacity is due to the formation of the SEI layer on the carbon surface and the trapping of lithium ions in the carbon sheet. The SCDCS electrode shows a reversible high capacity of 559 mA h g−1 at the 10th cycle, which is much higher than the theoretical capacity of commercial graphite (374 mA h g−1).26 Fig. 3c exhibits the rate performance of the SCDCS electrode. The reversible capacities are about 454, 344, 266, 211, 150, and 119 mA h g−1 at 0.2, 0.5, 1, 2, 5, and 10 A g−1. When the current is returned to 0.1 A g−1, the capacity recovers to 514 mA h g−1, suggesting good reversibility and highly stable cyclability. The cycling stability of SCDCS is further confirmed by cycling at 1 A g−1 (Fig. 3d). The cycling coulombic efficiency is close to 100% after the initial 7 cycles. After 500 cycles, the SCDCS electrode can still maintain a high capacity of 269 mA h g−1 with no sign of degradation.
O + Li+ + e− → –C–O–Li), the faradic adsorption at the defective graphitic layers, and the lithium intercalation between the graphitic layers.9 The first discharge/charge capacity is 1726/709 mA h g−1, indicating an initial Coulomb efficiency of 41.1%. The irreversible capacity is due to the formation of the SEI layer on the carbon surface and the trapping of lithium ions in the carbon sheet. The SCDCS electrode shows a reversible high capacity of 559 mA h g−1 at the 10th cycle, which is much higher than the theoretical capacity of commercial graphite (374 mA h g−1).26 Fig. 3c exhibits the rate performance of the SCDCS electrode. The reversible capacities are about 454, 344, 266, 211, 150, and 119 mA h g−1 at 0.2, 0.5, 1, 2, 5, and 10 A g−1. When the current is returned to 0.1 A g−1, the capacity recovers to 514 mA h g−1, suggesting good reversibility and highly stable cyclability. The cycling stability of SCDCS is further confirmed by cycling at 1 A g−1 (Fig. 3d). The cycling coulombic efficiency is close to 100% after the initial 7 cycles. After 500 cycles, the SCDCS electrode can still maintain a high capacity of 269 mA h g−1 with no sign of degradation.
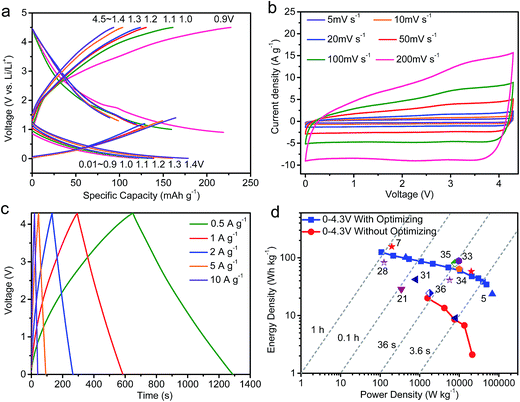
In order to obtain the ideal electrode potential for fabrication of the lithium-ion capacitor, we assembled a series of half-cells to adjust the electrode potential, making the capacity of the positive and negative parts the same (Fig. 4a and S2†). It was found that the capacity of the negative and positive electrodes is balanced when the electrode potential is set to about 1.07 V. To fabricate the lithium-ion capacitor, first, the positive electrode was discharged from 4.5 to 1.07 V, then held at 1.07 V for 3 hours for the charge injection. The negative electrode was charged/discharged between 0.01 V and 1.07 V, then the voltage was maintained at 1.07 V for 3 hours, which facilitated the formation of a stable solid-electrolyte interphase film. Next, two separate electrodes with the same electrode potential were disassembled from the half-cells, and assembled into the lithium-ion capacitor. Fig. 4b exhibits the CV curves of the lithium-ion capacitor at scan rates from 5 to 200 mV s−1. The applied voltage range is 0–4.3 V; 4.3 V was selected to avoid decomposition of the electrolyte at a high current density.7,9 The shapes of the CV curves deviate from the ideal rectangle shape, which indicates that the capacitive behavior, redox reaction, and the insertion/extraction of lithium ions occurred during the charging–discharging process.9,30,31 Fig. 4c displays the charge–discharge curves of the SCDCS-based lithium-ion capacitor, and the nearly linear curves indicate that the device is favorable for high-rate operations.32 At 0.1 A g−1, the capacity is as high as 195 F g−1, and a high capacity of 135 F g−1 can be maintained at 1 A g−1 (Fig. S3†). At 50 A g−1, the capacity retention ratio is 34%, indicating a good high-rate performance. The optimized lithium-ion capacitor exhibits a high energy density of 124.8 W h kg−1 at a power density of 107 W kg−1, while the device can still reach an energy density of 59.5 W h kg−1 at a very high power density of 10![[thin space (1/6-em)]](https://www.rsc.org/images/entities/char_2009.gif) 508 W kg−1, as shown in Fig. 4d. The energy-power characteristics of our fabricated lithium-ion capacitor are comparable or superior to previously reported hybrid devices (Fig. 4d and Table S2†).5,7,21,28,31,33–36 For comparison, a lithium-ion capacitor was also assembled without tuning the potential of the positive and negative electrodes (Fig. S4†). It can be seen that the energy density of the lithium-ion capacitor without optimization is only 20 W h kg−1 (Fig. 4d), which is much lower than that of the optimized lithium-ion capacitor, suggesting that adjusting the potential of the electrode is a promising way to improve the energy density of the capacitor.
508 W kg−1, as shown in Fig. 4d. The energy-power characteristics of our fabricated lithium-ion capacitor are comparable or superior to previously reported hybrid devices (Fig. 4d and Table S2†).5,7,21,28,31,33–36 For comparison, a lithium-ion capacitor was also assembled without tuning the potential of the positive and negative electrodes (Fig. S4†). It can be seen that the energy density of the lithium-ion capacitor without optimization is only 20 W h kg−1 (Fig. 4d), which is much lower than that of the optimized lithium-ion capacitor, suggesting that adjusting the potential of the electrode is a promising way to improve the energy density of the capacitor.
The cycling stability of the SCDCS-based lithium-ion capacitor, tested at 10 A g−1, is shown in Fig. S5.† It can be seen that a capacity retention of 66% is achieved after 5000 cycles. The loss of capacity during cycling can be explained by the EIS analysis (Fig. S6†). The equivalent series resistance increased from 2.7 Ω before cycling to 3.8 Ω after 5000 cycles, while the charge transfer resistance increased from 18.8 Ω before cycling to 28.8 Ω after 5000 cycles. This observation indicates that cycling-induced resistance impedes the ion/charge transfer, leading to a decrease in capacity during cycling.
Conclusions
To summarize, we synthesized sheet-like carbon by a simple carbonization-activation process. The obtained sorghum core-derived carbon sheet has a high surface area and a hierarchical porous structure, which are beneficial for improving lithium storage. By adjusting the potential of the positive and negative electrodes, the energy density of the fabricated lithium-ion capacitor can reach up to 124.8 W h kg−1. With the electrode weight of the lithium-ion capacitor being one-fourth of the total device,37 the mass based energy density of the total device is 31.2 W h kg−1, which is comparable to that of Ni/MH batteries. We believe this strategy provides a promising method for the fabrication of high energy capacitors without sacrificing the power density.Acknowledgements
Financial support for this work from National Natural Science Foundation of China (No. 21471139, and 51402272), Shandong Province Outstanding Youth Scientist Foundation Plan (No. BS2014CL024), Seed Fund from Ocean University of China (No. 841412005), and Fundamental Research Funds for the Central Universities (No. 841562011) is gratefully acknowledged.Notes and references
- R. U. R. Sagar, N. Mahmood, F. J. Stadler, T. Anwar, S. T. Navale, K. Shehzad and B. Du, Electrochim. Acta, 2016, 211, 156–163 CrossRef.
- W. Lu, M. Liu, L. Miao, D. Zhu, X. Wang, H. Duan, Z. Wang, L. Li, Z. Xu, L. Gan and L. Chen, Electrochim. Acta, 2016, 205, 132–141 CrossRef CAS.
- P. Simon, Y. Gogotsi and B. Dunn, Science, 2014, 343, 1210–1211 CrossRef CAS PubMed.
- L. Zhang, Y. Jiang, L. Wang, C. Zhang and S. Liu, Electrochim. Acta, 2016, 196, 189–196 CrossRef CAS.
- H. W. Wang, Y. Zhang, H. X. Ang, Y. Q. Zhang, H. T. Tan, Y. F. Zhang, Y. Y. Guo, J. B. Franklin, X. L. Wu, M. Srinivasan, H. J. Fan and Q. Y. Yan, Adv. Funct. Mater., 2016, 26, 3082–3093 CrossRef CAS.
- Y. Ma, H. Chang, M. Zhang and Y. Chen, Adv. Mater., 2015, 27, 5296–5308 CrossRef CAS PubMed.
- W. S. V. Lee, E. Peng, M. Li, X. Huang and J. M. Xue, Nano Energy, 2016, 27, 202–212 CrossRef CAS.
- H. Wang, Z. Xu, Z. Li, K. Cui, J. Ding, A. Kohandehghan, X. Tan, B. Zahiri, B. C. Olsen, C. M. Holt and D. Mitlin, Nano Lett., 2014, 14, 1987–1994 CrossRef CAS PubMed.
- Z. Weng, F. Li, D. W. Wang, L. Wen and H. M. Cheng, Angew. Chem., Int. Ed., 2013, 52, 3722–3725 CrossRef CAS PubMed.
- C. Peng, S. Zhang, X. Zhou and G. Z. Chen, Energy Environ. Sci., 2010, 3, 1499–1502 Search PubMed.
- X.-Y. Shan, F. Li, D.-W. Wang and H.-M. Cheng, Energy Storage Materials, 2016, 3, 66–68 CrossRef.
- S. W. Lee, N. Yabuuchi, B. M. Gallant, S. Chen, B. S. Kim, P. T. Hammond and Y. Shao-Horn, Nat. Nanotechnol., 2010, 5, 531–537 CrossRef CAS PubMed.
- B. Babu, P. G. Lashmi and M. M. Shaijumon, Electrochim. Acta, 2016, 211, 289–296 CrossRef CAS.
- X. Huang, Z. Zeng, Z. Fan, J. Liu and H. Zhang, Adv. Mater., 2012, 24, 5979–6004 CrossRef CAS PubMed.
- J. Guo, J. Zhang, F. Jiang, S. Zhao, Q. Su and G. Du, Electrochim. Acta, 2015, 176, 853–860 CrossRef CAS.
- W. Yu, H. Wang, S. Liu, N. Mao, X. Liu, J. Shi, W. Liu, S. Chen and X. Wang, J. Mater. Chem. A, 2016, 4, 5973–5983 CAS.
- G. Ma, F. Hua, K. Sun, Z. Zhang, E. Feng, H. Peng and Z. Lei, RSC Adv., 2016, 6, 103508–103516 RSC.
- N. H. Phan, S. Rio, C. Faur, L. Le Coq, P. Le Cloirec and T. H. Nguyen, Carbon, 2006, 44, 2569–2577 CrossRef CAS.
- T. Ouyang, K. Cheng, Y. Gao, S. Kong, K. Ye, G. Wang and D. Cao, J. Mater. Chem. A, 2016, 4, 9832–9843 CAS.
- C. Bommier, T. W. Surta, M. Dolgos and X. Ji, Nano Lett., 2015, 15, 5888–5892 CrossRef CAS PubMed.
- X. Han, P. Han, J. Yao, S. Zhang, X. Cao, J. Xiong, J. Zhang and G. Cui, Electrochim. Acta, 2016, 196, 603–610 CrossRef CAS.
- M. Sevilla, C. Sanchís, T. Valdés-Solís, E. Morallón and A. B. Fuertes, Carbon, 2008, 46, 931–939 CrossRef CAS.
- Y. Cao, L. Xiao, M. L. Sushko, W. Wang, B. Schwenzer, J. Xiao, Z. Nie, L. V. Saraf, Z. Yang and J. Liu, Nano Lett., 2012, 12, 3783–3787 CrossRef CAS PubMed.
- M. Sevilla and A. B. Fuertes, ACS Nano, 2014, 8, 5069–5078 CrossRef CAS PubMed.
- S. Yamauchi and Y. Kurimoto, J. Wood Sci., 2003, 45, 235–240 CrossRef.
- J. Ding, Z. Li, K. Cui, S. Boyer, D. Karpuzov and D. Mitlin, Nano Energy, 2016, 23, 129–137 CrossRef CAS.
- X. Yang, H. Huang, G. Zhang, X. Li, D. Wu and R. Fu, Mater. Chem. Phys., 2015, 149–150, 657–662 CrossRef CAS.
- Z. Yang, H. Guo, X. Li, Z. Wang, Z. Yan and Y. Wang, J. Power Sources, 2016, 329, 339–346 CrossRef CAS.
- J. Xu, M. Wang, N. P. Wickramaratne, M. Jaroniec, S. Dou and L. Dai, Adv. Mater., 2015, 27, 2042–2048 CrossRef CAS PubMed.
- F. Zheng, Y. Yang and Q. Chen, Nat. Commun., 2014, 5, 5261 CrossRef CAS PubMed.
- H. Kim, M. Y. Cho, M. H. Kim, K. Y. Park, H. Gwon, Y. Lee, K. C. Roh and K. Kang, Adv. Energy Mater., 2013, 3, 1500–1506 CrossRef CAS.
- K. Leng, F. Zhang, L. Zhang, T. Zhang, Y. Wu, Y. Lu, Y. Huang and Y. Chen, Nano Res., 2013, 6, 581–592 CrossRef CAS.
- R. Yi, S. Chen, J. Song, M. L. Gordin, A. Manivannan and D. Wang, Adv. Funct. Mater., 2014, 24, 7433–7439 CrossRef CAS.
- R. Wang, J. Lang, P. Zhang, Z. Lin and X. Yan, Adv. Funct. Mater., 2015, 25, 2270–2278 CrossRef CAS.
- J. Zhang, X. Liu, J. Wang, J. Shi and Z. Shi, Electrochim. Acta, 2016, 187, 134–142 CrossRef CAS.
- J. H. Lee, H. K. Kim, E. Baek, M. Pecht, S. H. Lee and Y. H. Lee, J. Power Sources, 2016, 301, 348–354 CrossRef CAS.
- Y. Gogotsi and P. Simon, Science, 2011, 334, 917–918 CrossRef CAS PubMed.
Footnote |
| † Electronic supplementary information (ESI) available. See DOI: 10.1039/c7ra02279d |
| This journal is © The Royal Society of Chemistry 2017 |

