 Open Access Article
Creative Commons Attribution 3.0 Unported Licence
Notably enhanced thermoelectric properties of lamellar polypyrrole by doping with β-naphthalene sulfonic acid
Xianxian Tang,
Taoxiang Liu*,
Han Li,
Dongwang Yang,
Liangjun Chen and
Xinfeng Tang *
*
State Key Laboratory of Advanced Technology for Materials Synthesis and Processing, Wuhan University of Technology, Wuhan 430070, P. R. China. E-mail: tangxf@whut.edu.cn; cxzwut@126.com
First published on 6th April 2017
Abstract
Polypyrrole (PPy) is a type of potential organic thermoelectric material that has attracted extensive attention in recent years. Its application is mainly limited by the relatively low intrinsic electrical conductivity and Seebeck coefficient, so it is necessary to find an effective way to improve the electrical transport properties of PPy. In this work, lamellar PPy doped with β-naphthalene sulfonic acid (β-NSA) was synthesized chemically using ferric chloride (FeCl3) as the oxidant, and the thermoelectric performance of β-NSA doped PPy was significantly enhanced. FTIR, XRD, Raman and FESEM analyses indicated that the presence of β-NSA and FeCl3 could effectively control the morphology of PPy to form a lamellar structure during the polymerization process, which improves the thermoelectric properties of PPy greatly. The highest thermoelectric figure of merit ZT, 0.62 × 10⁻³, was obtained with the molar ratio of monomer pyrrole (py) to β-NSA of 1.0![[thin space (1/6-em)]](https://www.rsc.org/images/entities/char_2009.gif) :
:![[thin space (1/6-em)]](https://www.rsc.org/images/entities/char_2009.gif) 0.45 at 300 K, and was 10 times higher than that of pure PPy. Furthermore, the TGA, elastic modulus, Vickers hardness results showed that the thermal stability and mechanical properties of β-NSA doped PPy was better than that of pure PPy.
0.45 at 300 K, and was 10 times higher than that of pure PPy. Furthermore, the TGA, elastic modulus, Vickers hardness results showed that the thermal stability and mechanical properties of β-NSA doped PPy was better than that of pure PPy.
1. Introduction
With the exhaustion of traditional energy sources such as coal and oil, and increasingly serious environmental pollution, there is urgent need to develop new energy conversion materials and clean energy to solve these problems. Thermoelectric (TE) conversion technology is capable of converting thermal energy into electrical energy directly using TE materials.1–3 In recent years, TE materials have attracted much attention in the world because of their lack of pollution, noise, and moving parts, their high reliability and other significant advantages.4–6 The performance of thermoelectric materials can be characterized by the dimensionless figure of merit ZT = S2σT/κ, where S, σ, κ and T are the Seebeck coefficient, electrical conductivity, thermal conductivity, and absolute temperature, respectively.7Over the years, researches were mainly concentrated on inorganic thermoelectric materials due to the relatively high performance and good high-temperature stability. However, the high cost of raw materials and the complicated manufacturing as well as the poor processing performance limits its widespread use.8 In recent years, organic thermoelectric materials have been developed rapidly thanks to their abundant resources, low weight, low cost, low thermal conductivity, simple preparation process and flexible preparation of wearable products with different shapes, which made it become a high-profile international research field.9–11 For example, poly (3,4-ethylenedioxythiophene)/poly (styrenesulphonate) (PEDOT/PSS),12–14 polyaniline (PANI),15,16 polypyrrole (PPy),17,18 and other organic thermoelectric materials have been studied extensively.19 Kim et al. reported that the ZT value of PEDOT reaches 0.42 at room temperature after doping with PSS.20 Li et al. fabricated a series of hydrochloric acid-doped PANI, found that the ZTmax achieves 2.67 × 10⁻⁴ at 423 K when HCl-doping concentration is 1.0 M.21
In contrast with other conductive polymers, PPy has been widely reported in battery, super capacitor, electromagnetic shielding, biological sensors and so on22–25 in virtue of its non toxic, environmental protection, low thermal conductivity, good biocompatibility, good stability in air,26,27 and meanwhile these advantages also make PPy as a potential organic thermoelectric material.28,29 But the intrinsic electrical conductivity and Seebeck coefficient of PPy is relatively low, and its thermal stability is not good enough. To solve these issues, most researchers mainly focused on doping or combining with other materials. For example, Wang et al. successfully synthesized the composite of PPy and graphene nanosheets (GNs) with enhanced thermoelectric properties. The ZT value increased with increasing GNs content and the maximum ZT value of 2.80 × 10⁻³ is about 210 times higher than that obtained from pure PPy.30 Wang et al. prepared PPy/multi-walled carbon nanotubes (MWCNTs) composite powders in the presence of ferric chloride (FeCl3) as the oxidant, resulting in the surfaces of MWCNT coated with PPy nanoparticles. And the power factor of the PPy/MWCNTs composite is 2.079 μW m−1 K−2 when the MWCNTs content is 20%, which is about 26 times as high as that of pure PPy.31 Shen et al. mainly studied the solubility of the β-NSA doped PPy in m-cresol, and the PPy–NSA prepared by in situ doped polymerization method with ammonium persulfate (APS) as the oxidant exhibited fibrillar morphology, which was different from the typical granular morphology of PPy doped with DBSA, HCl, MBSA or CSA, while the PPy/β-NSA prepared by two-step method was also granular morphology. And the highest electrical conductivity of β-NSA doped PPy is 27 S cm−1 at room temperature.32 In another work, they investigated the solubility of the PPy doped with different sulfonic acid (BNSA, β-NSA, DBSA, CSA, MBSA and so on), and proposed that the solubility of PPy is connected with the solvating ability of sulfonic acid. They also studied the influences of the various polymerization medium (water, CHCl3, CH3NO2, THF) on the solubility and conductivity of PPy.33 Akinyeye et al. synthesized β-NSA doped PPy micro/nanotubes, they pointed out that the stability of the conducting cationic polypyrrole intermediate in the polymerization process is favoured in acidic medium. And the acidic media provided by the β-NSA dopant will significantly influence the conductivity of PPy.34 What's more, β-NSA can ionize hydrophilic group of naphthalene sulfonic acid ion (NSA−) in solution simultaneously, which may act as template to affect the micromorphology of PPy in the polymerization process, and affect the carrier transportation within intrachain and interchain. Thereby the electrical conductivity can be further improved.35
From the above, the microstructure of PPy has a great impact on its thermoelectric performance, and doping PPy with β-NSA may improve the thermoelectric performance of PPy. In this work, lamellar PPy doped with β-NSA was successfully prepared with various doping amount of β-NSA through the chemical oxidative polymerization method, using ferric chloride (FeCl3) as the oxidant and the β-NSA as the dopant, respectively. The formation mechanism of lamellar structure and the thermoelectric properties of the prepared samples were studied.
2. Experimental
Pyrrole (99%), β-naphthalene sulfonic acid (β-NSA) (98%), anhydrous ferric chloride (FeCl3) (AR), anhydrous ethanol (AR) and deionized water were the main raw materials. All the chemical reagents were of analytical grade and without any further purification. Typically, 0.97 g pyrrole monomer was dissolved in 80 mL deionized water, then a certain amount of β-NSA was added into the above solution, the molar ratios of pyrrole monomer to β-NSA were designed as 1.0![[thin space (1/6-em)]](https://www.rsc.org/images/entities/char_2009.gif) :
:![[thin space (1/6-em)]](https://www.rsc.org/images/entities/char_2009.gif) 0.4, 1.0
0.4, 1.0![[thin space (1/6-em)]](https://www.rsc.org/images/entities/char_2009.gif) :
:![[thin space (1/6-em)]](https://www.rsc.org/images/entities/char_2009.gif) 0.45, 1.0
0.45, 1.0![[thin space (1/6-em)]](https://www.rsc.org/images/entities/char_2009.gif) :
:![[thin space (1/6-em)]](https://www.rsc.org/images/entities/char_2009.gif) 0.5, 1.0
0.5, 1.0![[thin space (1/6-em)]](https://www.rsc.org/images/entities/char_2009.gif) :
:![[thin space (1/6-em)]](https://www.rsc.org/images/entities/char_2009.gif) 0.55, 1.0
0.55, 1.0![[thin space (1/6-em)]](https://www.rsc.org/images/entities/char_2009.gif) :
:![[thin space (1/6-em)]](https://www.rsc.org/images/entities/char_2009.gif) 0.6, respectively. After magnetic stirring for 30 min in ice bath (<5 °C), the oxidant solution obtained by dissolving 4.69 g FeCl3 in 80 mL deionized water was slowly dropped into the above reaction system via pear-shaped funnel. The reaction was carried out under continuously stirring for 12 h in ice bath (<5 °C). After the polymerization, the resulting precipitates were centrifuged and washed with anhydrous ethanol for several times until colorless. Finally, as-prepared products were dried under vacuum at 50 °C for 24 h. Pure PPy without β-NSA was also prepared under the similar procedure.
0.6, respectively. After magnetic stirring for 30 min in ice bath (<5 °C), the oxidant solution obtained by dissolving 4.69 g FeCl3 in 80 mL deionized water was slowly dropped into the above reaction system via pear-shaped funnel. The reaction was carried out under continuously stirring for 12 h in ice bath (<5 °C). After the polymerization, the resulting precipitates were centrifuged and washed with anhydrous ethanol for several times until colorless. Finally, as-prepared products were dried under vacuum at 50 °C for 24 h. Pure PPy without β-NSA was also prepared under the similar procedure.
Fourier transform infrared spectroscopy (FTIR, NEXUS/NEXUS, USA) measurements were conducted to test the characteristic absorption peaks of functional group, with the scanning range of 4000–400 cm−1. The X-ray diffraction (XRD) spectra of the all samples were checked on a PANalytical X'Pert Empyean X-ray diffractometer with Cu Kα (1.5406 Å) with the generator voltage and the tube current to be 40 kV and 40 mA, and scanning was carried out in the 2θ range from 3 to 50 degrees with a scan step size of 0.02 degree. Raman spectra were recorded on a Raman spectrometer (NVIA/INVIA, China) with an excitation wavelength of 633 nm. Field emission scanning electron microscopy (SEM, HITACHI SU8020, Japan) was employed to observe the microstructure of the powder sample. Comprehensive thermal analyzer (TG-DSC, STA449F3/STA449F3, Germany) was applied to investigate the thermal stability of the sample under nitrogen atmosphere at a heating rate of 10 °C min−1. The electrical conductivity and the Seebeck coefficient of the samples were acquired on a commercial ZEM-3 system (Ulvac Sinku-Riko, Japan) in helium in the temperature range of 300–400 K. The thermal conductivity of the sample was determined from κ = λCpd, where λ is the thermal diffusivity acquired by the laser flash method (Netzsch LFA 457, Germany), d is the density measured by the Archimedes method in alcohol, and Cp is the specific heat obtained by a differential scanning calorimeter (TA DSC Q20, USA) in argon. The measurement error of the electrical conductivity, the Seebeck coefficient and thermal conductivity were ±5%, ±2% and ±5%, respectively. Ultrasonic Pulse-echo Method (Tektronix, TDS2022 USA) was used to measure the transverse velocity (νt) and longitudinal velocity (νl) of the sample, and the elastic modulus was calculated by the following equations:36,37
| G = dvt2 |
where d is the density, G is the shear modulus, E is the Young's modulus, ν is the Poisson's ratio and B is the bulk modulus. Vickers hardness was measured by microhardness instrument (Qness, Q10A+, Austria) with the main load of 2.0 kg and the dwell time of 10 s.
3. Results and discussion
3.1 Structure and morphology of β-NSA doped PPy
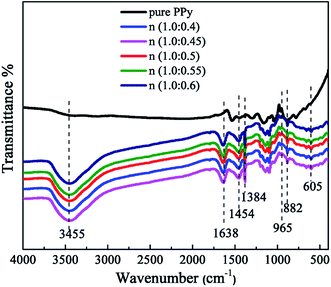
FTIR spectra of pure PPy and β-NSA doped PPy is shown in Fig. 1. In the spectrum of pure PPy, the peaks at 882 cm−1 and 965 cm−1 are attributed to the vibration of the C–H. The peaks located at 1384 cm−1 and 1454 cm−1 represent the C–N and C![[double bond, length as m-dash]](https://www.rsc.org/images/entities/char_e001.gif) C stretching vibration, respectively, which are also the characteristic peaks of pyrrole ring. The peak at 3455 cm−1 corresponds to the N–H stretching vibration.38 Compared with the pure PPy, two peaks located at 605 cm−1 and 1638 cm−1 can be noticed in the spectra of the PPy/β-NSA samples, which can be assigned to the characteristic vibrational peaks of SO3− and benzene ring, respectively.39 It can be concluded that the β-NSA has been doped into PPy successfully.
C stretching vibration, respectively, which are also the characteristic peaks of pyrrole ring. The peak at 3455 cm−1 corresponds to the N–H stretching vibration.38 Compared with the pure PPy, two peaks located at 605 cm−1 and 1638 cm−1 can be noticed in the spectra of the PPy/β-NSA samples, which can be assigned to the characteristic vibrational peaks of SO3− and benzene ring, respectively.39 It can be concluded that the β-NSA has been doped into PPy successfully.
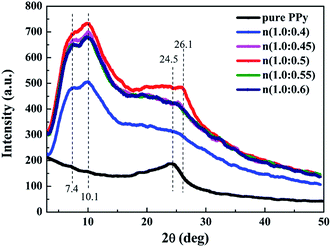
XRD analysis of the samples was showed in Fig. 2. For the pure PPy sample, there is only a broad characteristic peak at 24.5° correspond to the d spacing values of 3.6 Å, which originates from π–π stacking of pyrrole rings, indicating that pure PPy is amorphous.40,41 However, three characteristic peaks of β-NSA doped PPy samples can be observed at about 7.4°, 10.1° and 24.5°, corresponding to the d spacing values of 11.48, 8.67 and 3.4 Å, respectively. These d values can be associated with the interlayer distance of pyrrole rings, pyrrole ring to NSA− ion dopant and π–π stacking distance,42,43 which also can be ascribed to the crystallization peak of PPy.44 And the peak associated to π–π interaction shifted from 24.5° to 26.1° after doping β-NSA, which can be explained by the introduction of the large conjugated structure of β-NSA strengthened the π–π interaction.43 The crystallinity (Xc) of the samples can be calculated according to the peak area of the crystalline (Ac) and noncrystalline (Aa) parts, Xc = Ac/(Aa + Ac).45 The crystalline peak of pure PPy is too weak to calculate Xc, while the crystallinity of the β-NSA doped PPy samples are about 41%, 47%, 48%, 44% and 45%, respectively. From the above analysis, it is implied that the crystalline of PPy improved greatly after doping β-NSA.
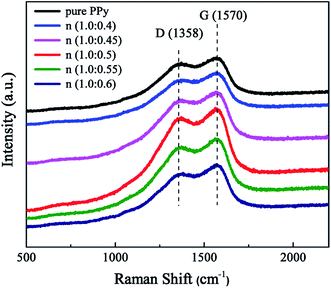
In order to further elucidate the influence on PPy molecular chain after doping β-NSA, the Raman spectrum of all samples was carried out and the results are depicted in Fig. 3. The Raman spectrum of pure PPy displays two peaks located at 1358 cm−1 (D peak) and 1570 cm−1 (G peak), which are related to the pyrrole ring and C![[double bond, length as m-dash]](https://www.rsc.org/images/entities/char_e001.gif) C molecular chain stretching vibration of PPy, respectively.46,47 And the calculated peak intensity ratio of D peak and G peak (ID/IG) is 0.92. As can be seen from the Raman spectrum, the peaks position of β-NSA doped PPy have no obvious shift compared with that of pure PPy. However, with the increasing of β-NSA, the peak intensity ratio (ID/IG) appears significant change. When molar ratios of py to β-NSA increase from 1.0
C molecular chain stretching vibration of PPy, respectively.46,47 And the calculated peak intensity ratio of D peak and G peak (ID/IG) is 0.92. As can be seen from the Raman spectrum, the peaks position of β-NSA doped PPy have no obvious shift compared with that of pure PPy. However, with the increasing of β-NSA, the peak intensity ratio (ID/IG) appears significant change. When molar ratios of py to β-NSA increase from 1.0![[thin space (1/6-em)]](https://www.rsc.org/images/entities/char_2009.gif) :
:![[thin space (1/6-em)]](https://www.rsc.org/images/entities/char_2009.gif) 0.4 to 1.0
0.4 to 1.0![[thin space (1/6-em)]](https://www.rsc.org/images/entities/char_2009.gif) :
:![[thin space (1/6-em)]](https://www.rsc.org/images/entities/char_2009.gif) 0.6, the ID/IG changes from 0.92 to 0.89, 0.63, 0.63, 0.89 and 0.88. Compared with pure PPy, the peak intensity ratios of D peak and G peak (ID/IG) are significantly reduced. The result indicates that the conjugated structure of PPy is enhanced, the order degree of molecular chain is increased, and the degree of defects is greatly decreased after doping β-NSA.29 With the augment of β-NSA, the growth of ID/IG is mainly attributed to the steric hindrance effect of NSA− ion weakened conjugated structure of PPy.48
0.6, the ID/IG changes from 0.92 to 0.89, 0.63, 0.63, 0.89 and 0.88. Compared with pure PPy, the peak intensity ratios of D peak and G peak (ID/IG) are significantly reduced. The result indicates that the conjugated structure of PPy is enhanced, the order degree of molecular chain is increased, and the degree of defects is greatly decreased after doping β-NSA.29 With the augment of β-NSA, the growth of ID/IG is mainly attributed to the steric hindrance effect of NSA− ion weakened conjugated structure of PPy.48
Fig. 4(a)–(e) presents the FESEM images of the pure PPy and PPy doped with various molar ratios of β-NSA. Fig. 4(a) shows the morphology of pure PPy, which exhibits irregular granular clusters. When the molar ratio of py to β-NSA is 1.0![[thin space (1/6-em)]](https://www.rsc.org/images/entities/char_2009.gif) :
:![[thin space (1/6-em)]](https://www.rsc.org/images/entities/char_2009.gif) 0.4, not only the granular structure exists, but also lamellar structure (Fig. 4(b)) can be observed; when the molar ratio of py to β-NSA increases to 1.0
0.4, not only the granular structure exists, but also lamellar structure (Fig. 4(b)) can be observed; when the molar ratio of py to β-NSA increases to 1.0![[thin space (1/6-em)]](https://www.rsc.org/images/entities/char_2009.gif) :
:![[thin space (1/6-em)]](https://www.rsc.org/images/entities/char_2009.gif) 0.45, it shows lamellar structures instead of the former granular structure (Fig. 4(c)). When the molar ratio reaches 1.0
0.45, it shows lamellar structures instead of the former granular structure (Fig. 4(c)). When the molar ratio reaches 1.0![[thin space (1/6-em)]](https://www.rsc.org/images/entities/char_2009.gif) :
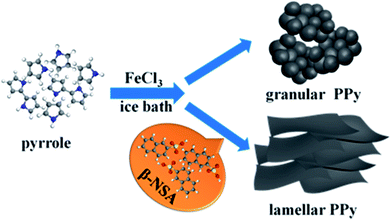
:![[thin space (1/6-em)]](https://www.rsc.org/images/entities/char_2009.gif) 0.5, the lamellar area is enlarged and 8–9 layers stack together (Fig. 4(d)). And the sheet is very thin and nearly transparent, which can be seen from the illustration inset Fig. 4(d). As the molar ratio further increases, the number of stacked layers is extended to several tens of layers (Fig. 4(e) and (f)). Thus, it can be inferred that different concentration of β-NSA in the solution has a great impact on the morphology of PPy. Well known, β-NSA contains a polar functional group of sulfonic acid and a naphthyl with rich electronic properties due to its π–π bond. It can greatly modify the conjugate of PPy molecular chain structure on account of the big conjugate structure of β-NSA.39,49 It is easy to form NSA micelles in aqueous solution due to the hydrophilic nature of NSA. Thus, it is reasonable to propose that NSA micelles might act as dopant and templates at the same time in the formation of PPy.35,50,51 When the amount of β-NSA is low, the formed NSA micelles are limited, only parts of the pyrrole monomers grew along the β-NSA micelles templates, thus granular and lamellar structures can coexist. When β-NSA reached a certain concentration, it can induce enough NSA micelles as templates for all the pyrrole monomers, thus only the lamellar structure can be observed. When the concentration of β-NSA is too high, the PPy sheets turned stacked together. However, the β-NSA doped PPy (or PANI) exhibited microtubular morphology when APS was used as oxidant, instead of FeCl3.52 It can be ascribed to the redox potential of APS is 2.05 V, and the redox potential of FeCl3 is 0.77 V, the oxidizing ability of the FeCl3 is weaker than APS,53 thus the polymerization rate of py monomer is slower, so that it preferred to form lamellar PPy rather than crinkle into tubular. Moreover, the concentration of py monomer is also important for the morphology. At a high concentration of py monomer, it turned to form granular morphology.54 And the concentration of py monomer in our work is low, this may also favored in producing lamellar PPy. In conclusion, the features of the dopant, the monomer concentration, and the type of oxidant, as well as polymerization conditions can affect the morphology of PPy. Both β-NSA and FeCl3 can effectively control the morphology of PPy to form a lamellar structure during the polymerization process. Based on the analysis of the FESEM images, a formation procedure of lamellar PPy is put forward in Fig. 5.
0.5, the lamellar area is enlarged and 8–9 layers stack together (Fig. 4(d)). And the sheet is very thin and nearly transparent, which can be seen from the illustration inset Fig. 4(d). As the molar ratio further increases, the number of stacked layers is extended to several tens of layers (Fig. 4(e) and (f)). Thus, it can be inferred that different concentration of β-NSA in the solution has a great impact on the morphology of PPy. Well known, β-NSA contains a polar functional group of sulfonic acid and a naphthyl with rich electronic properties due to its π–π bond. It can greatly modify the conjugate of PPy molecular chain structure on account of the big conjugate structure of β-NSA.39,49 It is easy to form NSA micelles in aqueous solution due to the hydrophilic nature of NSA. Thus, it is reasonable to propose that NSA micelles might act as dopant and templates at the same time in the formation of PPy.35,50,51 When the amount of β-NSA is low, the formed NSA micelles are limited, only parts of the pyrrole monomers grew along the β-NSA micelles templates, thus granular and lamellar structures can coexist. When β-NSA reached a certain concentration, it can induce enough NSA micelles as templates for all the pyrrole monomers, thus only the lamellar structure can be observed. When the concentration of β-NSA is too high, the PPy sheets turned stacked together. However, the β-NSA doped PPy (or PANI) exhibited microtubular morphology when APS was used as oxidant, instead of FeCl3.52 It can be ascribed to the redox potential of APS is 2.05 V, and the redox potential of FeCl3 is 0.77 V, the oxidizing ability of the FeCl3 is weaker than APS,53 thus the polymerization rate of py monomer is slower, so that it preferred to form lamellar PPy rather than crinkle into tubular. Moreover, the concentration of py monomer is also important for the morphology. At a high concentration of py monomer, it turned to form granular morphology.54 And the concentration of py monomer in our work is low, this may also favored in producing lamellar PPy. In conclusion, the features of the dopant, the monomer concentration, and the type of oxidant, as well as polymerization conditions can affect the morphology of PPy. Both β-NSA and FeCl3 can effectively control the morphology of PPy to form a lamellar structure during the polymerization process. Based on the analysis of the FESEM images, a formation procedure of lamellar PPy is put forward in Fig. 5.
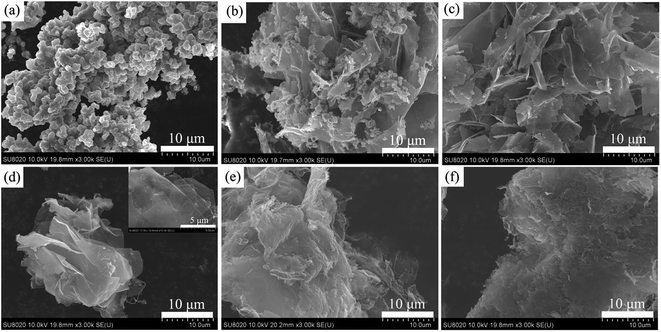 | ||
Fig. 4 FESEM images of all samples: (a) pure PPy and (b–f) PPy doped β-NSA with various molar ratios of py to β-NSA, (b) 1.0![[thin space (1/6-em)]](https://www.rsc.org/images/entities/char_2009.gif) : :![[thin space (1/6-em)]](https://www.rsc.org/images/entities/char_2009.gif) 0.4, (c) 1.0 0.4, (c) 1.0![[thin space (1/6-em)]](https://www.rsc.org/images/entities/char_2009.gif) : :![[thin space (1/6-em)]](https://www.rsc.org/images/entities/char_2009.gif) 0.45, (d) 1.0 0.45, (d) 1.0![[thin space (1/6-em)]](https://www.rsc.org/images/entities/char_2009.gif) : :![[thin space (1/6-em)]](https://www.rsc.org/images/entities/char_2009.gif) 0.5, (e) 1.0 0.5, (e) 1.0![[thin space (1/6-em)]](https://www.rsc.org/images/entities/char_2009.gif) : :![[thin space (1/6-em)]](https://www.rsc.org/images/entities/char_2009.gif) 0.55, (f) 1.0 0.55, (f) 1.0![[thin space (1/6-em)]](https://www.rsc.org/images/entities/char_2009.gif) : :![[thin space (1/6-em)]](https://www.rsc.org/images/entities/char_2009.gif) 0.6. 0.6. | ||
3.2 Thermoelectric properties of β-NSA doped PPy
Fig. 6(a)–(f) illustrates the electrical conductivity, Seebeck coefficient, thermal conductivity, power factor and ZT of PPy doped with different molar ratios of β-NSA in the temperature range of 300–400 K. For all samples, as we can see from Fig. 6(a), the electrical conductivity is enhanced dramatically with the rising temperature, showing the characteristic of nondegenerate semiconductor transport behavior. At the same time, when the molar ratio of monomer py to β-NSA increased from 1.0![[thin space (1/6-em)]](https://www.rsc.org/images/entities/char_2009.gif) :
:![[thin space (1/6-em)]](https://www.rsc.org/images/entities/char_2009.gif) 0.4 to 1.0
0.4 to 1.0![[thin space (1/6-em)]](https://www.rsc.org/images/entities/char_2009.gif) :
:![[thin space (1/6-em)]](https://www.rsc.org/images/entities/char_2009.gif) 0.6, the electrical conductivity of PPy first increases and then decreases with the increment of β-NSA doping concentration and reaches the maximum when the molar ratio is 1.0
0.6, the electrical conductivity of PPy first increases and then decreases with the increment of β-NSA doping concentration and reaches the maximum when the molar ratio is 1.0![[thin space (1/6-em)]](https://www.rsc.org/images/entities/char_2009.gif) :
:![[thin space (1/6-em)]](https://www.rsc.org/images/entities/char_2009.gif) 0.5. This phenomenon might be attributed to the following two reasons: one is the large conjugated structure of β-NSA, and the other is the steric hindrance effect of NSA− ion.55 Firstly, with the increasing of β-NSA content, the enhancement of electrical conductivity is mainly originated from the large conjugated structure of β-NSA. According to the Raman spectra and XRD pattern, the decline of ID/IG indicates that the degree of conjugation and the order of PPy molecular chain are strengthened after doping with β-NSA. In the meantime, the FESEM image shows that the microstructure of PPy transforms from granular to lamellar. The reinforcement of PPy molecular chain conjugation and the lamellar structure are favorable for the transport of carriers between interchain and intrachain, resulting in the increased electrical conductivity. When the molar ratio of py to β-NSA is 1.0
0.5. This phenomenon might be attributed to the following two reasons: one is the large conjugated structure of β-NSA, and the other is the steric hindrance effect of NSA− ion.55 Firstly, with the increasing of β-NSA content, the enhancement of electrical conductivity is mainly originated from the large conjugated structure of β-NSA. According to the Raman spectra and XRD pattern, the decline of ID/IG indicates that the degree of conjugation and the order of PPy molecular chain are strengthened after doping with β-NSA. In the meantime, the FESEM image shows that the microstructure of PPy transforms from granular to lamellar. The reinforcement of PPy molecular chain conjugation and the lamellar structure are favorable for the transport of carriers between interchain and intrachain, resulting in the increased electrical conductivity. When the molar ratio of py to β-NSA is 1.0![[thin space (1/6-em)]](https://www.rsc.org/images/entities/char_2009.gif) :
:![[thin space (1/6-em)]](https://www.rsc.org/images/entities/char_2009.gif) 0.5, the ID/IG dropped to a minimum value of 0.63 and the electrical conductivity achieves the maximum of 133 S cm−1 at 400 K. The electrical conductivity of β-NSA doped PPy is about 10 times larger than that of pure PPy (10.34 S cm−1) at room temperature. With the increasing of β-NSA, the anion steric hindrance effect of β-NSA plays a dominant role. Thus the degree of separation is aggravated and the degree of conjugation is weakened between the molecular chains of PPy which is consistent with the results of Raman analysis (namely ID/IG increases). The carrier hopping will be hindered between molecular chains, which lead to the decrease of electrical conductivity. Compared with others reported PPy composite samples, the electrical conductivity of β-NSA doped PPy is also considerable high.28–31
0.5, the ID/IG dropped to a minimum value of 0.63 and the electrical conductivity achieves the maximum of 133 S cm−1 at 400 K. The electrical conductivity of β-NSA doped PPy is about 10 times larger than that of pure PPy (10.34 S cm−1) at room temperature. With the increasing of β-NSA, the anion steric hindrance effect of β-NSA plays a dominant role. Thus the degree of separation is aggravated and the degree of conjugation is weakened between the molecular chains of PPy which is consistent with the results of Raman analysis (namely ID/IG increases). The carrier hopping will be hindered between molecular chains, which lead to the decrease of electrical conductivity. Compared with others reported PPy composite samples, the electrical conductivity of β-NSA doped PPy is also considerable high.28–31
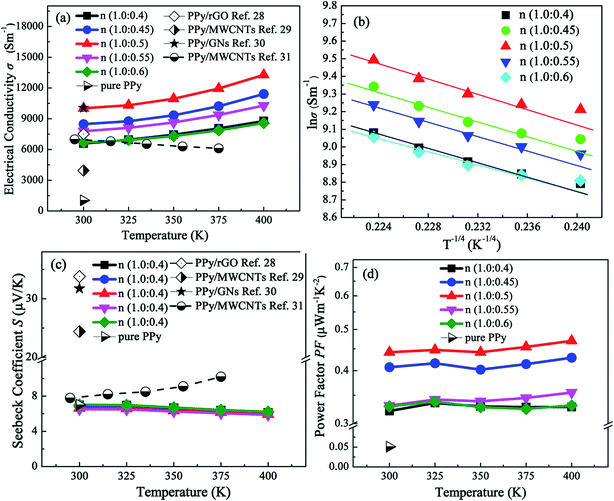 | ||
Fig. 6 Temperature dependence of thermoelectric properties of all samples, (a) electrical conductivity, (b) the plots of ln![[thin space (1/6-em)]](https://www.rsc.org/images/entities/char_2009.gif) σ vs. T−1/4, (c) Seebeck coefficient and (d) power factor. σ vs. T−1/4, (c) Seebeck coefficient and (d) power factor. | ||
The plots of ln![[thin space (1/6-em)]](https://www.rsc.org/images/entities/char_2009.gif) σ versus T−1/4 are shown in Fig. 6(b). It can be observed that ln
σ versus T−1/4 are shown in Fig. 6(b). It can be observed that ln![[thin space (1/6-em)]](https://www.rsc.org/images/entities/char_2009.gif) σ is linearly related to T−1/4, which is in accordance with Mott's 3D Variable Range Hopping (VRH) model, except that ln
σ is linearly related to T−1/4, which is in accordance with Mott's 3D Variable Range Hopping (VRH) model, except that ln![[thin space (1/6-em)]](https://www.rsc.org/images/entities/char_2009.gif) σ deviates linearly from T−1/4 slightly at room temperature. The equation can be expressed as follows: σ(T) = σ0
σ deviates linearly from T−1/4 slightly at room temperature. The equation can be expressed as follows: σ(T) = σ0![[thin space (1/6-em)]](https://www.rsc.org/images/entities/char_2009.gif) exp[−(T0/T)1/4], where σ0 is a constant, T0 is the Mott characteristic temperature, which can be calculated from the slope of the curve, T is the Kelvin temperature.56
exp[−(T0/T)1/4], where σ0 is a constant, T0 is the Mott characteristic temperature, which can be calculated from the slope of the curve, T is the Kelvin temperature.56
Fig. 6(c) displays the Seebeck coefficient of all samples. The Seebeck coefficient of all samples is positive, suggesting p-type conductive behavior. It is apparent that the Seebeck coefficient of all samples is similar to that of pure PPy (6.995 μV K−1), and the Seebeck coefficient does not change with the increasing of temperature and the doping amount of β-NSA. Because of the energy filtering effect at the interfaces between PPy and composite material, the Seebeck coefficient of PPy composite samples is high in comparison with doped with β-NSA.30,31
We know that the electrical conductivity is dependent on carrier mobility, which can be improved by the degree of crystallization of the polymer chain. A higher crystalline of the polymer resulted in a smaller barrier of carrier mobility within the intra-chain and the inter-chain.57,58 In general, the chains of conductive polymer are amorphous, showing the short-range order but long-range disorder. From the above analysis of FTIR, Raman spectra and FESEM image, when β-NSA was introduced into the polymerization system, β-NSA can not only act as soft template in the process of monomer polymerization to improve the microstructure of PPy, but also serve as dopant to heighten the conjugation degree of the molecular chain. As a result, both the carrier transition barrier and the degree of defects in the PPy chain are greatly reduced, which lead to a further improvement in the electrical conductivity.
Fig. 6(d) demonstrates the power factor (S2σ) of all the PPy samples. Because of much enhanced electrical conductivity by doping β-NSA, the power factor of PPy doped with β-NSA is strengthened to some extent and it reaches the maximum 0.47 μW m−1 K−2 when the molar ratio of py to β-NSA is 1.0![[thin space (1/6-em)]](https://www.rsc.org/images/entities/char_2009.gif) :
:![[thin space (1/6-em)]](https://www.rsc.org/images/entities/char_2009.gif) 0.5, which is 9 times higher than that of pure PPy (0.0506 μW m−1 K−2).
0.5, which is 9 times higher than that of pure PPy (0.0506 μW m−1 K−2).
As shown in Fig. 7, the thermal conductivity of PPy increases with the rise of temperature, and increases with the increment of β-NSA doping amount. When the molar ratio of py to β-NSA is 1.0![[thin space (1/6-em)]](https://www.rsc.org/images/entities/char_2009.gif) :
:![[thin space (1/6-em)]](https://www.rsc.org/images/entities/char_2009.gif) 0.5, the thermal conductivity obtained the maximum of 1.07 W m−1 K−1 at 400 K, but the thermal conductivity of all the samples are comparable to pure PPy (0.240 W m−1 K−1) at room temperature. Generally speaking, the thermal conductivity of thermoelectric materials derives from phonons (κp) and electrons (κe).59 However, the polymers with different crystalline, the contribution of the two parts to the thermal conductivity is different. According to Wiedemann–Franz's law: κe = LTσ, where L is the Lorentz factor, σ is the electrical conductivity, and T is the absolute temperature.60 For a typical conductive polymer, even the electrical conductivity reach up to 300 S cm−1, κe is almost negligible on account of quite low value. For instance, the study of PANI manifested that although the electrical conductivity increased more than nine orders of magnitude, the change of thermal conductivity was not significant.61 In addition, the thermal conductivity of organic thermoelectric materials is usually closely linked with the ordering degree of molecular chain arrangement and the charge carrier concentration, the higher degree of order, the greater thermal conductivity. The increase in thermal conductivity of PPy doped with β-NSA may be due to the following two reasons: on the one hand, the enhanced of order and conjugation of PPy chain makes phonons harder to scatter. On the other hand, after doping β-NSA, the density of charge carrier increases so as to promote the heat transfer.
0.5, the thermal conductivity obtained the maximum of 1.07 W m−1 K−1 at 400 K, but the thermal conductivity of all the samples are comparable to pure PPy (0.240 W m−1 K−1) at room temperature. Generally speaking, the thermal conductivity of thermoelectric materials derives from phonons (κp) and electrons (κe).59 However, the polymers with different crystalline, the contribution of the two parts to the thermal conductivity is different. According to Wiedemann–Franz's law: κe = LTσ, where L is the Lorentz factor, σ is the electrical conductivity, and T is the absolute temperature.60 For a typical conductive polymer, even the electrical conductivity reach up to 300 S cm−1, κe is almost negligible on account of quite low value. For instance, the study of PANI manifested that although the electrical conductivity increased more than nine orders of magnitude, the change of thermal conductivity was not significant.61 In addition, the thermal conductivity of organic thermoelectric materials is usually closely linked with the ordering degree of molecular chain arrangement and the charge carrier concentration, the higher degree of order, the greater thermal conductivity. The increase in thermal conductivity of PPy doped with β-NSA may be due to the following two reasons: on the one hand, the enhanced of order and conjugation of PPy chain makes phonons harder to scatter. On the other hand, after doping β-NSA, the density of charge carrier increases so as to promote the heat transfer.
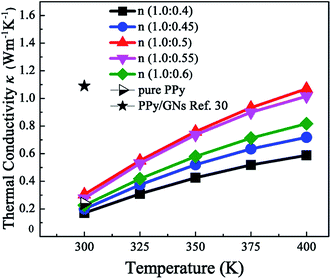 | ||
| Fig. 7 Temperature dependence of the thermal conductivity of all samples and PPy/GNs ref. 30. | ||
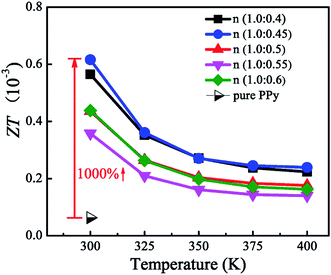
Fig. 8 depicts the ZT values of PPy doped with different molar ratios of β-NSA as a function of temperature. The maximum ZT value of 0.62 × 10⁻³ is obtained when the molar ratio of py to β-NSA is 1.0![[thin space (1/6-em)]](https://www.rsc.org/images/entities/char_2009.gif) :
:![[thin space (1/6-em)]](https://www.rsc.org/images/entities/char_2009.gif) 0.45 at 300 K, which is approximately 10 times higher than that of pure PPy (0.064 × 10⁻³). This is attributed to two aspects: firstly, the electrical conductivity is dramatically improved. Secondly, the thermal conductivity is maintained at a low level or even reduced at room temperature. Despite the electrical conductivity increases significantly at all test temperature range, the ZT value at high temperature is not improved, because the thermal conductivity shows an upward trend and the Seebeck coefficient is not developed.
0.45 at 300 K, which is approximately 10 times higher than that of pure PPy (0.064 × 10⁻³). This is attributed to two aspects: firstly, the electrical conductivity is dramatically improved. Secondly, the thermal conductivity is maintained at a low level or even reduced at room temperature. Despite the electrical conductivity increases significantly at all test temperature range, the ZT value at high temperature is not improved, because the thermal conductivity shows an upward trend and the Seebeck coefficient is not developed.
3.3 Thermal stability of β-NSA doped PPy
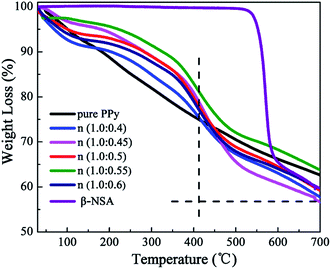
Thermal stability of conductive polymer is an important parameter, which determines the application temperature range. Therefore, TG analysis for all samples including pure β-NSA has been carried out from room temperature to 700 °C under heating rate of 10 °C min−1 in nitrogen atmosphere and the result is displayed in Fig. 9. From the figure, it can be seen that β-NSA is particularly stable and does not lose weight before 550 °C. And then it begins to decompose at 550 °C and the weight loss is about 40% between 550 °C and 700 °C, indicating that the thermal stability of β-NSA is very good before 550 °C. Besides, the TGA curves of pure PPy and PPy doped with β-NSA show a similar shape, suggesting that these samples display a similar degradation procedure. The initial weight loss up to 100 °C may stem from the removal of absorbed water.62 Compared with pure PPy, when the molar ratio is 1.0![[thin space (1/6-em)]](https://www.rsc.org/images/entities/char_2009.gif) :
:![[thin space (1/6-em)]](https://www.rsc.org/images/entities/char_2009.gif) 0.55, the thermal stability of PPy is the best. The weight loss rate of PPy doped with β-NSA is slower under 410 °C and the weight loss is about 25%, the weight loss rate is quicker above 410 °C and the weight loss is about 43% at 700 °C. This is primarily attributed to the thermal decomposition property of β-NSA. The results declared that the thermal stability of PPy could strengthen in the temperature range of RT–400 °C, and aggravate the degradation of PPy at high temperature (>400 °C) after doping β-NSA.
0.55, the thermal stability of PPy is the best. The weight loss rate of PPy doped with β-NSA is slower under 410 °C and the weight loss is about 25%, the weight loss rate is quicker above 410 °C and the weight loss is about 43% at 700 °C. This is primarily attributed to the thermal decomposition property of β-NSA. The results declared that the thermal stability of PPy could strengthen in the temperature range of RT–400 °C, and aggravate the degradation of PPy at high temperature (>400 °C) after doping β-NSA.
3.4 Mechanical properties of β-NSA doped PPy
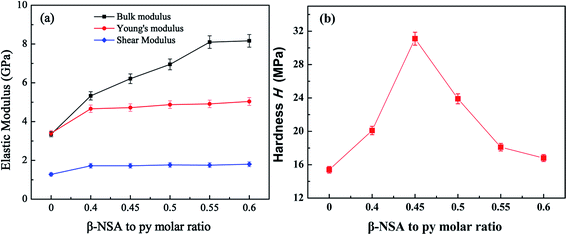
In addition to exploring the thermoelectric properties of PPy, we also studied the mechanical properties of PPy. The elastic modulus (bulk modulus, Yong's modulus and shear modulus) and Vickers hardness of the samples were carried out. It can be seen from the Fig. 10(a) that the elastic modulus of PPy is enhanced after doping β-NSA. And the Yong's modulus and shear modulus among the β-NSA doped PPy samples showed little difference, while the bulk modulus of the β-NSA doped PPy increased with the increasing of β-NSA. The enhanced elastic modulus is due to the microstructure of PPy changing from granular to lamellar and the enhancement of molecular chain arrangement tightness after doping β-NSA. And the molecular structure of β-NSA contains two benzene rings, which can further increase the rigidity of PPy when β-NSA are introduced into PPy chains.63Besides, Vickers hardness is the parameters evaluating the ability of the material to resist plastic deformation, it was showed in Fig. 10(b). It can be found that the hardness of PPy increased firstly after doping β-NSA, and then decreased with higher doping level of β-NSA. The hardness of pure PPy is 15.4 MPa, while the maximum hardness of 31.1 MPa was obtained when the molar ratio of monomer py to β-NSA is 1.0![[thin space (1/6-em)]](https://www.rsc.org/images/entities/char_2009.gif) :
:![[thin space (1/6-em)]](https://www.rsc.org/images/entities/char_2009.gif) 0.45, this is consistence with the thermoelectric properties of the samples. Compared with the pure PPy, the hardness of the β-NSA doped PPy was greatly improved, and it exhibited an enhanced ability to resist plastic deformation. This is due to the β-NSA template in favor of the formation of lamellar PPy, which possessed more regular and close arrangement of the molecular chains of PPy. The free volume of PPy can be promoted when excess NSA− ions were introduced into the main chain of PPy, resulting in a looser PPy backbone.64 Meanwhile, the wear resistance of the material is proportional to hardness. The higher the Vickers hardness, the better the wear resistance of the material.65
0.45, this is consistence with the thermoelectric properties of the samples. Compared with the pure PPy, the hardness of the β-NSA doped PPy was greatly improved, and it exhibited an enhanced ability to resist plastic deformation. This is due to the β-NSA template in favor of the formation of lamellar PPy, which possessed more regular and close arrangement of the molecular chains of PPy. The free volume of PPy can be promoted when excess NSA− ions were introduced into the main chain of PPy, resulting in a looser PPy backbone.64 Meanwhile, the wear resistance of the material is proportional to hardness. The higher the Vickers hardness, the better the wear resistance of the material.65
4. Conclusions
β-NSA doped lamellar polypyrrole (PPy) was successfully prepared via chemical oxidation polymerization method with varying the mole ratio of monomer py to β-NSA under ice bath (<5 °C). β-NSA can not only improve the microstructure of PPy effectively due to the formation of β-NSA micelles in the solution which acted as template in the polymerization process, but also enhance the ordering of the molecular chains and the conjugated degree of the PPy owing to the large conjugated structure of β-NSA, which are both led to the increase of the electrical conductivity. Meanwhile, the thermal conductivity is also kept at a low level even decreased with the increase of doping amount at room temperature. So that the highest thermoelectric figure of merit ZT is achieved 0.62 × 10⁻³ with the molar ratio of monomer py to β-NSA of 1.0![[thin space (1/6-em)]](https://www.rsc.org/images/entities/char_2009.gif) :
:![[thin space (1/6-em)]](https://www.rsc.org/images/entities/char_2009.gif) 0.45 at 300 K, which is 10 times higher than that of pure PPy. Moreover, the thermal stability and mechanical properties of PPy are also enhanced greatly after doping β-NSA. These results implied that organic thermoelectric materials become promising candidates for the applications of low-cost and low-density thermoelectric materials. There is still much space for further improvement of the thermoelectric performance in comparison with other organic thermoelectric materials, especially the enhancement of the Seebeck coefficient.
0.45 at 300 K, which is 10 times higher than that of pure PPy. Moreover, the thermal stability and mechanical properties of PPy are also enhanced greatly after doping β-NSA. These results implied that organic thermoelectric materials become promising candidates for the applications of low-cost and low-density thermoelectric materials. There is still much space for further improvement of the thermoelectric performance in comparison with other organic thermoelectric materials, especially the enhancement of the Seebeck coefficient.
Acknowledgements
The authors wish to acknowledge support from the National Basic Research Program of China (973 program) under project 2013CB632502, the Natural Science Foundation of China (Grant No. 51521001, 51632006) and the 111 Project of China (Grant No. B07040).Notes and references
- O. Bubnova and X. Crispin, Energy Environ. Sci., 2012, 5, 9345–9362 CAS.
- Q. Zhang, Y. Sun, W. Xu and D. Zhu, Adv. Mater., 2014, 26, 6829–6851 CrossRef CAS PubMed.
- M. S. Dresselhaus, G. Chen, M. Tang, R. Yang, H. Lee, D. Z. Wang, Z. F. Ren, J. P. Fleurial and P. Gogna, Adv. Mater., 2007, 19, 1043–1053 CrossRef CAS.
- F. J. DiSalvo, Science, 1999, 285, 703–706 CrossRef CAS PubMed.
- L. E. Bell, Science, 2008, 321, 1457–1461 CrossRef CAS PubMed.
- T. M. Tritt, H. Boettner and L. Chen, MRS Bull., 2008, 33, 366–368 CrossRef CAS.
- D. K. C. MacDonald, Thermoelectricity: an introduction to the principles, Courier Corporation, 2006 Search PubMed.
- R. B. Aich, N. Blouin, A. Bouchard and M. Leclerc, Chem. Mater., 2009, 21, 751–757 CrossRef CAS.
- N. Toshima, Macromol. Symp., 2002, 186, 81–86 CrossRef CAS.
- J.-H. Bahk, H. Fang, K. Yazawa and A. Shakouri, J. Mater. Chem. C, 2015, 3, 10362–10374 RSC.
- J. Zhao, D. Tan and G. Chen, J. Mater. Chem. C, 2017, 5, 47–53 RSC.
- N. Massonnet, A. Carella, O. Jaudouin, P. Rannou, G. Laval, C. Celle and J.-P. Simonato, J. Mater. Chem. C, 2014, 2, 1278–1283 RSC.
- M. He, F. Qiu and Z. Lin, Energy Environ. Sci., 2013, 6, 1352–1361 Search PubMed.
- O. Bubnova, Z. U. Khan, A. Malti, S. Braun, M. Fahlman, M. Berggren and X. Crispin, Nat. Mater., 2011, 10, 429–433 CrossRef CAS PubMed.
- L. Wang, Q. Yao, H. Bi, F. Huang, Q. Wang and L. Chen, J. Mater. Chem. A, 2015, 3, 7086–7092 CAS.
- Q. Yao, L. Chen, W. Zhang, S. Liufu and X. Chen, ACS Nano, 2010, 4, 2445–2451 CrossRef CAS PubMed.
- N. T. Kemp, A. B. Kaiser, C. J. Liu, B. Chapman, O. Mercier, A. M. Carr, H. J. Trodahl, R. G. Buckley, A. C. Partridge, J. Y. Lee, C. Y. Kim, A. Bartl, L. Dunsch, W. T. Smith and J. S. Shapiro, J. Polym. Sci., Part B: Polym. Phys., 1999, 37, 953–960 CrossRef CAS.
- J. Wu, Y. Sun, W. Pei, L. Huang, W. Xu and Q. Zhang, Synth. Met., 2014, 196, 173–177 CrossRef CAS.
- C. Bounioux, P. Diazchao, M. Campoyquiles, M. S. Martingonzalez, A. R. Goni, R. Yerushalmirozen and C. Muller, Energy Environ. Sci., 2013, 6, 918–925 CAS.
- G. H. Kim, L. Shao, K. Zhang and K. P. Pipe, Nat. Mater., 2013, 12, 719–723 CrossRef CAS PubMed.
- J. Li, X. Tang, H. Li, Y. Yan and Q. Zhang, Synth. Met., 2010, 160, 1153–1158 CrossRef CAS.
- L. Li, F. Yan and G. Xue, J. Appl. Polym. Sci., 2004, 91, 303–307 CrossRef CAS.
- Y. Fu and A. Manthiram, Chem. Mater., 2012, 24, 3081–3087 CrossRef CAS.
- S. Ye and J. Feng, ACS Appl. Mater. Interfaces, 2014, 6, 9671–9679 CAS.
- A. T. Mane, S. D. Sartale and V. B. Patil, J. Mater. Sci.: Mater. Electron., 2015, 26, 8497–8506 CrossRef CAS.
- H. Xiao and S. Fu, CrystEngComm, 2014, 16, 2097–2112 RSC.
- M. Culebras, B. Uriol, C. M. Gomez and A. Cantarero, Phys. Chem. Chem. Phys., 2015, 17, 15140–15145 RSC.
- Z. Zhang, G. Chen, H. Wang and W. Zhai, J. Mater. Chem. C, 2015, 3, 1649–1654 RSC.
- H. Song, K. Cai, J. Wang and S. Shen, Synth. Met., 2016, 211, 58–65 CrossRef CAS.
- L. Wang, F. Liu, C. Jin, T. Zhang and Q. Yin, RSC Adv., 2014, 4, 46187–46193 RSC.
- J. Wang, K. Cai, S. Shen and J. Yin, Synth. Met., 2014, 195, 132–136 CrossRef CAS.
- Y. Shen and M. Wan, J. Polym. Sci., Part A: Polym. Chem., 1997, 35, 3689–3695 CrossRef CAS.
- Y. Shen and M. Wan, Synth. Met., 1998, 96, 127–132 CrossRef CAS.
- R. O. Akinyeye, M. Sekota, P. Baker and E. I. Iwuoha, Fullerenes, Nanotubes, Carbon Nanostruct., 2006, 14, 49–55 CrossRef CAS.
- J. Liu and M. Wan, J. Mater. Chem., 2001, 11, 404–407 RSC.
- H. Ledbetter, N. V. Frederick and M. W. Austin, J. Appl. Phys., 1980, 51, 305–309 CrossRef CAS.
- J. E. Bailey, Nature, 1979, 280, 176 CrossRef.
- T. Wu and S. Lin, J. Polym. Sci., Part A: Polym. Chem., 2006, 44, 6449–6457 CrossRef CAS.
- J. Y. Lee, D. Y. Kim and C. Y. Kim, Synth. Met., 1995, 74, 103–106 CrossRef CAS.
- L. F. Warren, J. A. Walker, D. P. Anderson, C. G. Rhodes and L. J. Buckley, J. Electrochem. Soc., 1989, 136, 2286–2295 CrossRef CAS.
- K. J. Wynne and G. B. Street, Macromolecules, 1985, 18, 2361–2368 CrossRef CAS.
- K. Cheah, M. Forsyth and V. T. Truong, Synth. Met., 1998, 94, 215–219 CrossRef CAS.
- P. Carrasco, H. Grande, M. Cortazar, J. M. Alberdi, J. Areizaga and J. A. Pomposo, Synth. Met., 2006, 156, 420–425 CrossRef CAS.
- P. P. Jeeju, S. J. Varma, P. A. F. Xavier, A. M. Sajimol and S. Jayalekshmi, Mater. Chem. Phys., 2012, 134, 803–808 CrossRef CAS.
- R. R. Hegde, M. G. Kamath and A. Dahiya, Polymer Crystallinity, 2004, available online, http://web.utk.edu/˜mse/Textiles/Polymer%20Crystallinity.htm.
- B. Saner, S. A. Gursel and Y. Yurum, Fullerenes, Nanotubes, Carbon Nanostruct., 2013, 21, 233–247 CrossRef CAS.
- Z. Gu, C. Li, G. Wang, L. Zhang, X. Li, W. Wang and S. Jin, J. Polym. Sci., Part B: Polym. Phys., 2010, 48, 1329–1335 CrossRef CAS.
- S. Gupta, J. Raman Spectrosc., 2008, 39, 1343–1355 CrossRef CAS.
- Z. Zhang, L. Zhu, Y. Ma, Y. Huang and G. Li, Analyst, 2013, 138, 1156–1166 RSC.
- Y. Yang, J. Liu and M. Wan, Nanotechnology, 2002, 13, 771–773 CrossRef CAS.
- L. Xia, Z. Wei and M. Wan, J. Colloid Interface Sci., 2010, 341, 1–11 CrossRef CAS PubMed.
- M. Wan, J. Huang and Y. Shen, Synth. Met., 1999, 101, 708–711 CrossRef CAS.
- H. Ding, M. Wan and Y. Wei, Adv. Mater., 2007, 19, 465–469 CrossRef CAS.
- P. Jha, S. P. Koiry, V. Saxena, P. Veerender, A. K. Chauhan, D. K. Aswal and S. K. Gupta, Macromolecules, 2011, 44, 4583–4585 CrossRef CAS.
- L. Fang, L. Zhao, X. Liang, H. Xiao and L. Qian, J. Appl. Polym. Sci., 2016, 133, 43759 Search PubMed.
- B. F. M. A. Davis, Electric process in nom-crystalline materials, Clarendon Press, 2012 Search PubMed.
- Y. Zhao, G. S. Tang, Z. Z. Yu and J. S. Qi, Carbon, 2012, 50, 3064–3073 CrossRef CAS.
- Q. Wang, Q. Yao, J. Chang and L. D. Chen, J. Mater. Chem., 2012, 22, 17612–17618 RSC.
- G. D. Mahan and M. Bartkowiak, Appl. Phys. Lett., 1999, 74, 953–954 CrossRef CAS.
- M. Jonson and G. D. Mahan, Phys. Rev. B: Condens. Matter Mater. Phys., 1980, 21, 4223–4229 CrossRef CAS.
- H. Yan, N. Sada and N. Toshima, J. Therm. Anal. Calorim., 2002, 69, 881–887 CrossRef CAS.
- H. Arami, M. Mazloumi, R. Khalifehzadeh, S. H. Emami and S. K. Sadrnezhaad, Mater. Lett., 2007, 61, 4412–4415 CrossRef CAS.
- R. J. Roberts, R. C. Rowe and P. York, Powder Technol., 1991, 65, 139–146 CrossRef CAS.
- O. Uzun, N. Basman, C. Alkan, U. Kolemen and F. Yilmaz, Polym. Bull., 2010, 66, 649–660 CrossRef.
- A. Faltermeier, C. Reicheneder, P. Romer, A. Castrolaza and P. Proff, Journal of Orofacial Orthopedics / Fortschritte der Kieferorthopädie, 2014, 75, 334–344 CrossRef CAS PubMed.
| This journal is © The Royal Society of Chemistry 2017 |


