DOI:
10.1039/C7RA02433A
(Paper)
RSC Adv., 2017,
7, 27397-27404
Self-template synthesis of ATiO3 (A = Ba, Pb and Sr) perovskites for photocatalytic removal of NO†
Received
27th February 2017
, Accepted 5th May 2017
First published on 23rd May 2017
Abstract
In this study, we report a self-template hydrothermal method for the synthesis of ATiO3 (A = Ba, Pb, and Sr) perovskites using anatase TiO2 nanosheets as precursors. Under hydrothermal conditions, ATiO3 with different structures and morphology can be obtained. These samples were characterized by X-ray diffraction (XRD), scanning electron microscopy (SEM) and transmission electron microscopy (TEM) techniques. The growth mechanism of ATiO3 was explored by XRD evaluation over different reaction time, and it was observed that PbTiO3 grows most slowly among all the samples including BaTiO3, SrTiO3, BaxPb1−xTiO3 and SrxPb1−xTiO3. The diffusion of A site sources to the solid surface and the reaction at solid/liquid interface could dominate the growth of ATiO3. All the as-prepared samples exhibited activities toward photocatalytic oxidation of NO at ppb level. Specifically, PbTiO3 has revealed the highest activity under both full spectrum and visible-light irradiation (λ > 420 nm), whereas BaTiO3 exhibited best selectivity for the formation of ionic species (NO3−), which could be ascribed to different electronic structures and charge separation efficiency of ATiO3. This study provides some important hints to tune the photocatalytic performances (activity and selectivity) of ATiO3 through the modification of A site elements.
1. Introduction
Photocatalytic solar-energy conversion has attracted extensive attention as one of the ideal technologies for dealing with global energy crisis and environmental pollution.1–3 Although a variety of new type photocatalysts have been discovered over past years,4–6 TiO2 is one of the most intensively investigated and widely used photocatalysts due to its photostability and high efficiency.7–9 To date, much effort has been made to synthesize TiO2 with different morphologies such as nanowires, nanosheets, nanocubes and nanotubes to meet the requirements of specific applications.10–12 Interestingly, the prepared nanostructured TiO2 can be used as a self-template to obtain complex Ti-based composites.13,14 For instance, we have successfully prepared photocatalytically active SrTiO3 nanocrystals using anatase TiO2 nanosheets as the precursor.15 Therefore, this self-template approach offers a new chance to tune the composition, electronic structure and the resulting photocatalytic performance of Ti-based composites.
ATiO3 (A = Ba, Sr, Pb) typical perovskite-type oxides have been investigated intensively due to their wide applications in gas sensors, capacitors, actuators and photoelectrodes for dye-sensitized solar cells.16–19 With respect to photocatalysis, Yin et al. found that octahedral-shaped perovskite PbTiO3 nanocrystals can degrade methylene blue (MB) efficiently under visible light irradiation.20 Kimijima et al. compared the photocatalytic hydrogen efficiency of cubic, spherical and flake-type SrTiO3 particles.21 Dunn et al. ascribed the enhanced photocatalytic activity of BaTiO3 to the ferroelectricity of its tetragonal phase.22 It is worth noting that the photocatalytic performances of ATiO3 can be further enhanced by the formation of a heterojunction such as BaTiO3/Cu2O,23 BaTiO3/TiO2,24 and BaTiO3/Bi2O3.25 Moreover, on combining Ag nanoparticles, SrTiO3 showed a relatively high photocatalytic efficiency for the degradation of NOx at ppb levels, which is one of the major pollutants in air.26 However, while there are numerous reports on photocatalytic performances of individual ATiO3, very limited study has been conducted on the effects of different elements in A site on the photocatalytic performances. Nevertheless, it is believed that a series of Ti-based perovskites could be synthesized with the same TiO2 precursor and the corresponding A site element source. With respect to this strategy, the influence of different A site elements in ATiO3 on their photocatalytic activity could be studied.27,28
In the present study, we synthesized a series of ATiO3 (A = Ba, Sr and Pb) perovskites by self-template method using anatase TiO2 nanosheets mainly exposed with {001} facet as the precursor. The influence of A site elements on the structure, morphology, growth kinetics of the ATiO3 samples was studied. Moreover, photocatalytic oxidation of NO over these ATiO3 perovskites shows that the photocatalytic activity and selectivity are strongly related to their electronic structure and charge separation efficiency, which can be supported by electrochemical and photoelectrochemical measurements. It is expected that this study could offer some details on the effect of different A site elements on the photocatalytic performances of perovskites-type titanate oxides.
2. Experimental
2.1 Hydrothermal synthesis of ATiO3 (A = Ba, Pb, and Sr)
TiO2 nanosheets dominated with {001} facets were first synthesized according to the previously reported hydrothermal method.15,29,30 Then, 5 mmol of the as-synthesized anatase TiO2 nanosheets and 2.5 mmol of Ba(OH)2·8H2O or Pb(NO3)2 or Sr(OH)2·2H2O were dispersed in 15 mL deionized water. SrxPb1−xTiO3 and BaxPb1−xTiO3 with the introduction of Pb atom on the A site of SrTiO3 and BaTiO3 were also synthesized similarly through the addition of 2.5 mmol of Sr(OH)2·2H2O or Ba(OH)2·8H2O: 2.5 mmol of (Pb(NO3)2 and 5 mmol TiO2 nanosheets. After adjusting the pH value of the system to 14 by KOH aqueous solution (12 M), the mixture was transferred into a 50 mL Teflon-lined vessel and heated to 140 or 160 °C with different reaction time periods of 2, 4, 6, 8, 24 and 72 h. After reaction, the obtained products were filtered and washed with deionized water and finally dried at 50 °C for 24 h in air.
2.2 Characterization
Synchrotron X-ray diffraction (XRD) experiments were performed at the beamline BL14B1 of Shanghai Synchrotron Radiation Facility (SSRF) with the transmittance mode at a wavelength of 0.6887 Å. Scanning electron microscopy (SEM) and energy dispersive X-ray spectroscopy (EDXS) were measured on an EVOMA 15 microscope equipped with an EDAX detector. Transmission electron microscopy (TEM), high-resolution TEM (HRTEM) and selected area electron diffraction (SAED) images were recorded on a FEI Tecnai G2 20 microscopy operated at 200 kV. Nitrogen adsorption–desorption isotherms were generated on a nitrogen adsorption apparatus (Quantachrome) and all the samples were degassed at 150 °C for 4 h. UV-Vis diffuse reflectance spectra were obtained by a Shimadzu 2600 UV-Vis spectrometer using BaSO4 as the reflectance standard reference.
2.3 Photocatalytic activity evaluation
Photocatalytic performance was evaluated through the photocatalytic removal of NO at ppb level in a continuous flow reactor at room temperature. Details of the reactor set-up can be referred from the previous study.3 Typically, a 150 W commercial metal halide lamp (ZY73-TD150/At, Yaming) was used as the light source and horizontally placed above the reactor (30 cm × 15 cm × 10 cm). The light intensity reaching the surface of the photocatalyst was measured as 51.3 mW cm−2 at 535 nm using a photometer (PM100D, Thorlabs). The catalysts (60 mg, grinded and sieved to 100–200 μm grains before use) were uniformly dispersed in two Petri dishes with a diameter of 12.0 cm in the center of the reactor. The flow rate of air and NO was 1.51 L min−1 and 12.1 mL min−1 during the tests, respectively. The concentration of NO before illumination was 700 ppb. The real-time concentration of NO and NOx (which could be seen as the molecular mixture of NO and NO2) was monitored by a NOx analyzer (Thermo Scientific, 42i-TL). The ratio of NO removal (η1%) and NO2 generation (η2%) can be given by following equations:26,31| |
 | (1) |
| |
 | (2) |
where C0(NO) and C0(NOx) are the initial concentrations of NO and NOx, respectively, before illumination, and C(NO) and C(NOx) are the real-time concentrations of NO and NOx, respectively, during photocatalysis. Based on this, the initial and real-time concentrations of NO2 can be calculated as (C0(NOx) − C0(NO)) and (C(NOx) − C(NO)) respectively. Therefore, the remaining ratio of NO at a given time was noted as C(NO)/C0(NO), and the generated amount of NO2 during the reaction could be written as [C(NOx) − C(NO) − (C0(NOx) − C0(NO))].
2.4 Electrochemical and photoelectrochemical measurement
Electrochemical and photoelectrochemical measurements were performed on a CHI 660 electrochemical workstation with a standard three-electrode cell system, in which platinum wire, standard calomel electrode (SCE) and 0.5 M Na2SO4 solution were employed as the counter electrode, reference electrode and electrolyte, respectively. Working electrode was prepared by the following process: 20 mg of the prepared ATiO3 was mixed with 0.5 mL of ethanol and 0.5 mL of water, and the mixture was ground thoroughly and laid on the fluorine-doped tin oxide (FTO) by the doctor-blade method. The decorated FTO was then annealed at 250 °C for 4 h with a heating rate of 80 °C h−1 to achieve the fabrication of the working electrode. Light irradiation was provided by a 300 W Xe lamp with the intensity of 246.0 mW cm−2.
3. Results and discussion
3.1 Crystal structure and morphology
Fig. 1 shows the XRD patterns of BaTiO3, SrTiO3, PbTiO3 and their composites prepared at 160 °C for 24 h. Basically, the diffraction peaks are indexed to the tetragonal structure of BaTiO3 (JCPDS 05-0626, α = b = 3.994 Å, c = 4.038 Å), PbTiO3 (JCPDS 06-0452, α = b = 3.899 Å, c = 4.153 Å) and cubic structure of SrTiO3 (JCPDS 35-0734, α = b = c = 3.905 Å), respectively. It is worth noting that several additional diffraction peaks related to anatase TiO2 could also be observed (diamond symbol in Fig. 1a and c) due to the excessive amount of TiO2 precursor in the system (the molar ratio of Ti source to A (Ba, Sr, or Pb) source is 2![[thin space (1/6-em)]](https://www.rsc.org/images/entities/char_2009.gif) :
:![[thin space (1/6-em)]](https://www.rsc.org/images/entities/char_2009.gif) 1). In addition to ATiO3 with single element of A site, we also introduced Pb atom in BaTiO3 and SrTiO3 to prepare BaxPb1−xTiO3 and SrxPb1−xTiO3. Due to the introduction of Pb atom in BaTiO3, crystal defects were formed, thereby broadening the diffraction peaks of BaxPb1−xTiO3 when compared to BaTiO3 (Fig. 1a), but the position of the peaks was almost similar to that of BaTiO3. However, for SrxPb1−xTiO3, the diffraction peaks of PbTiO3 could be clearly found in addition to the diffraction peaks of SrTiO3 (club symbol in Fig. 1c). In general, the formation of solid solution between two materials depends on their matching extent in several factors such as crystal structure, electronegativity and chemical valence. For instance, the ionic radius of the two elements should be close to each other (with a difference less than 15%).32 This is particularly important for ATiO3, as each atom on A site is highly coordinated with 12 nearby oxygen atoms. The ionic radii of Sr, Ba and Pb are 1.44, 1.61 and 1.49 Å, respectively. The difference between them was within 15%, indicating that the generation of the solid solution from BaTiO3 or SrTiO3 and PbTiO3 was possible. In addition, the electronegativity and chemical valence of these three atoms were similar as well. Nevertheless, it should be noted that a similar crystal structure of these materials was also necessary for the formation of a solid solution. SrTiO3 has a different cubic crystal structure from BaTiO3 and PbTiO3, and both the latter have a similar tetragonal structure. Therefore, a solid solution (BaxPb1−xTiO3) was obtained from BaTiO3 and PbTiO3 (cf. Fig. 1a), whereas SrTiO3 and PbTiO3 tended to form a composite (SrxPb1−xTiO3), as evidenced from the XRD pattern (Fig. 1c).
1). In addition to ATiO3 with single element of A site, we also introduced Pb atom in BaTiO3 and SrTiO3 to prepare BaxPb1−xTiO3 and SrxPb1−xTiO3. Due to the introduction of Pb atom in BaTiO3, crystal defects were formed, thereby broadening the diffraction peaks of BaxPb1−xTiO3 when compared to BaTiO3 (Fig. 1a), but the position of the peaks was almost similar to that of BaTiO3. However, for SrxPb1−xTiO3, the diffraction peaks of PbTiO3 could be clearly found in addition to the diffraction peaks of SrTiO3 (club symbol in Fig. 1c). In general, the formation of solid solution between two materials depends on their matching extent in several factors such as crystal structure, electronegativity and chemical valence. For instance, the ionic radius of the two elements should be close to each other (with a difference less than 15%).32 This is particularly important for ATiO3, as each atom on A site is highly coordinated with 12 nearby oxygen atoms. The ionic radii of Sr, Ba and Pb are 1.44, 1.61 and 1.49 Å, respectively. The difference between them was within 15%, indicating that the generation of the solid solution from BaTiO3 or SrTiO3 and PbTiO3 was possible. In addition, the electronegativity and chemical valence of these three atoms were similar as well. Nevertheless, it should be noted that a similar crystal structure of these materials was also necessary for the formation of a solid solution. SrTiO3 has a different cubic crystal structure from BaTiO3 and PbTiO3, and both the latter have a similar tetragonal structure. Therefore, a solid solution (BaxPb1−xTiO3) was obtained from BaTiO3 and PbTiO3 (cf. Fig. 1a), whereas SrTiO3 and PbTiO3 tended to form a composite (SrxPb1−xTiO3), as evidenced from the XRD pattern (Fig. 1c).
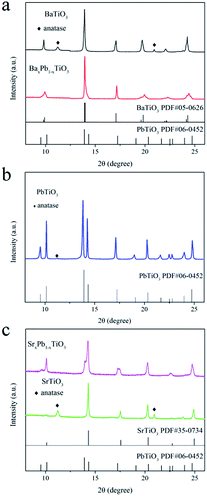 |
| | Fig. 1 XRD patterns of the ATiO3 prepared at 160 °C for 24 h: (a) BaTiO3 and BaxPb1−xTiO3; (b) PbTiO3; (c) SrxPb1−xTiO3 and SrTiO3. | |
Typical SEM images (Fig. 2) revealed that all the samples have a nanostructure in the range of tens to hundreds of nanometers. Specifically, BaTiO3 is mainly present as piled-up pellets from 40 to 200 nm (Fig. 2a). In contrast, the packing of BaxPb1−xTiO3 is more compact and the pellets tend to convert into polygon-shaped sheets (Fig. 2b). Moreover, the morphology of PbTiO3 is different from that of BaTiO3 and instead, the formation of 2D nanosheets is observed (Fig. 2c). Among all the samples, SrxPb1−xTiO3 (Fig. 2d) possesses the most uniform morphology, composed of cubic nanoparticles of the size of about 40 nm. However, this uniformity disappears for SrTiO3: cubic particles from 40 to 400 nm can be found in the SEM image (Fig. 2e). Clearly, the substitution of A site atom in ATiO3 has a significant influence on the morphology of the final products. Furthermore, EDXS results (Fig. 2f and g) reveal the existence of Pb atom in BaxPb1−xTiO3 solid solution and SrxPb1−xTiO3 composite, and these elements have uniform distribution, as evidenced by elemental mappings (Fig. S1†).
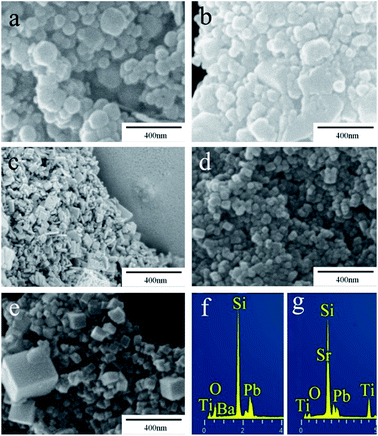 |
| | Fig. 2 Typical SEM images of ATiO3: (a) BaTiO3, (b) BaxPb1−xTiO3, (c) PbTiO3, (d) SrxPb1−xTiO3, (e) SrTiO3, and EDXS of (f) BaxPb1−xTiO3 and (g) SrxPb1−xTiO3. | |
To further investigate the morphology and microstructure of these samples, TEM studies were carried out. As shown in Fig. 3a, BaTiO3 nanoparticles are close to round-shape. HRTEM image (Fig. 3b) of BaTiO3 indicates a lattice spacing of 0.284 nm, which corresponds to (101) or (110) planes of BaTiO3. This is further confirmed by the SAED pattern. For PbTiO3, the TEM image (Fig. 3c) confirms the sheet shaped morphology. These nanosheets are very thin and are transparent under the electron beam. In addition, the lattice spacing of 0.208, 0.284 and 0.387 nm with contact angle of 46.8° and 90° in the triangle region can be clearly observed (Fig. 3d), which matches well with the (002), (101), (100) planes of PbTiO3, respectively. In accordance with the SEM results (cf. Fig. 2), the morphology of SrTiO3 was relatively regular (Fig. 3e). Two crystal planes with lattice spacing of 0.276 and 0.195 nm and a contact angle of 45° are attributed to the (110) and (200) planes of SrTiO3 (Fig. 3f). In combination with the XRD results (Fig. 3), it is clear that this self-template method can be applied to synthesize perovskite-type ATiO3 with various A site elements. Moreover, TEM investigation indicated that the anatase TiO2 precursor is residual in SrTiO3 and BaTiO3 because the characteristic crystal fringes of anatase TiO2 were observed in their HRTEM images (Fig. 3b and f), which agrees well with the XRD results. Fig. S2† shows the nitrogen adsorption–desorption isotherms as well as the corresponding pore volume of these samples. All of them revealed a typical type of H4 hysteresis loop (Fig. S2f†), which is often ascribed to the narrow slit-like pores.33 The determined specific surface area (SBET) of BaTiO3, PbTiO3 and SrTiO3 is 33.4, 40.1 and 52.1 m2 g−1, respectively. Specifically, the substitution of Ba and Sr with Pb atom and the formation of solid solution (BaxPb1−xTiO3) and composite (SrxPb1−xTiO3) led to the decrease of surface area and pore volume. The detailed surface area and pore parameters of these samples are shown in Table 1. These results demonstrate that the element in A site not only affects the structure and morphology of ATiO3, but also modifies their surface area and pore size.
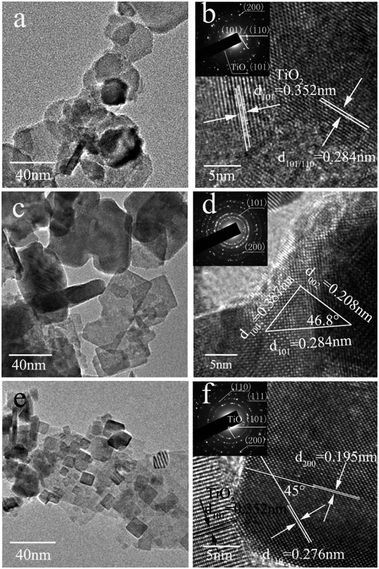 |
| | Fig. 3 TEM and HRTEM images of ATiO3 (inset is the corresponding SAED pattern): (a and b) BaTiO3, (c and d) PbTiO3, (e and f) SrTiO3. | |
Table 1 BET surface area, pore parameters
| Sample |
SBET/m2 g−1 |
Pore volume/cm3·g−1 |
Pore size/nm |
| BaTiO3 |
33.4 |
0.168 |
19.4 |
| BaxPb1−xTiO3 |
9.2 |
0.057 |
14.4 |
| PbTiO3 |
40.1 |
0.127 |
11.1 |
| SrxPb1−xTiO3 |
20.5 |
0.107 |
19.5 |
| SrTiO3 |
52.1 |
0.218 |
14.9 |
3.2 Hydrothermal growth process
In order to understand the hydrothermal growth process of these ATiO3 perovskites, we measured the XRD patterns of the products over different reaction times. Fig. S3† shows typical XRD patterns for the growth of PbTiO3 at 160 °C. No diffraction patterns of intermediate other than PbTiO3 and anatase TiO2 precursor were detected during the entire test time (72 h). As time increases, the diffraction peaks of PbTiO3 become sharp, while that of anatase TiO2 become weaker. Similar phenomenon was observed for BaTiO3 and SrTiO3 as well. Then, on assuming that the entire reaction has been completed at 72 h, kinetic analysis could be performed by fitting the data of the most intense reflection (101) of BaTiO3 and (110) of PbTiO3 and SrTiO3 to the expression which correlates the extent of reaction (α) to time.34–38 Fig. 4 reveals the variations of α values of BaTiO3, PbTiO3 and SrTiO3 over time at different temperatures. The growth of BaTiO3 and SrTiO3 is relatively fast (in minutes), whereas the kinetics of PbTiO3 is the slowest among the studied samples. These results reveal the sensitive response of the ATiO3 growth process to the alteration of only A site elements. Furthermore, on increasing the reaction temperature from 140 to 160 °C, the leads to a reduction of the half-life time t0.5 of these samples, indicating that increasing the temperature can accelerate these reactions, which is consistent with our previous study on the hydrothermal growth of Bi2WO6.39
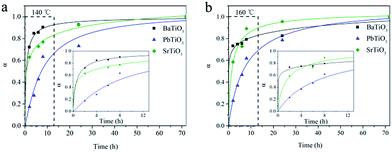 |
| | Fig. 4 Extent of reaction (α) of ATiO3 as a function of the reaction time at (a) 140 °C and (b) 160 °C. Inset is the enlarged view from the dotted line region. | |
A much detailed description of kinetic evaluation can be obtained through the Sharp–Hancock (SH) plots,40–43 where ln[−ln(1 − α)] versus ln(t) is plotted. The reaction mechanistic change can be indicated from a change in the slope of the SH curve. Moreover, the reaction exponent (m) can be determined from the linear region of this curve. It is extremely difficult to perform a detailed and rigorous analysis due to the limited available data (Fig. 4), particularly for the growth of BaTiO3 and SrTiO3 given the rapid reaction speed. However, such analysis could provide insights into the influence of A site elements on the corresponding hydrothermal growth process. Fig. 5 shows the SH plot of BaTiO3, SrTiO3 and PbTiO3 obtained at different reaction temperatures. It can be observed that BaTiO3 and SrTiO3 with m ≈ 0.2 exhibited a completely different reaction mechanism from PbTiO3 with m ≈ 0.8. Importantly, the growth mechanism of ATiO3 was temperature independent given that m varies little from 140 to 160 °C. In general, m ≈ 0.5 has indicated a diffusion-controlled process, whereas m ≈ 1.0 has revealed a phase-boundary controlled growth mechanism.42 Therefore, the growth of BaTiO3 and SrTiO3 seemed to be controlled by diffusion process, while the growth of PbTiO3 with m ≈ 0.8 was more in accordance with diffusion-controlled and/or a phase-boundary controlled process. In the current hydrothermal reaction, as we have used solid TiO2 nanosheets as the precursor, diffusion of A site sources to the solid surface and the reaction at the solid/liquid interface could dominate the growth of ATiO3, which is similar to the hydrothermal growth of Bi6S2O15 nanowire using Bi2O3 particles as the precursor.44
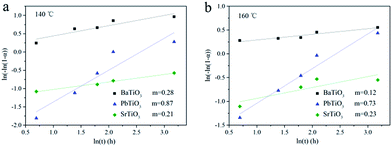 |
| | Fig. 5 Johnson–Mehl Avrami plots for ATiO3 at different reaction temperature (a) 140 °C and (b) 160 °C. | |
3.3 Optical property and photocatalytic performance
Fig. 6 shows the UV-Vis diffuse reflection spectra (DRS) of these samples. Both BaTiO3 and SrTiO3 have a similar absorption edge starting at about 390 nm, suggesting that they are only responsive to UV light, while PbTiO3 is responsive to visible light with wavelength of 425 nm. The addition of Pb into BaTiO3 and SrTiO3 can enhance their light absorption in visible region. Therefore, the band gap (Eg) of BaTiO3, BaxPb1−xTiO3, PbTiO3, SrxPb1−xTiO3 and SrTiO3 is determined to be 3.22, 3.02 3.00, 2.95 and 3.22 eV, respectively, according to the onset of the absorption edge (cf. Table 2).
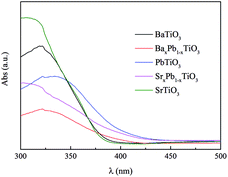 |
| | Fig. 6 UV-Vis diffuse reflectance spectra of ATiO3. | |
Table 2 The band structures of ATiO3
| Sample |
Band gap/eV |
CB/eV |
VB/eV |
| BaTiO3 |
3.22 |
−0.799 |
2.421 |
| BaxPb1−xTiO3 |
3.02 |
−1.026 |
1.994 |
| PbTiO3 |
3.00 |
−0.928 |
2.072 |
| SrxPb1−xTiO3 |
2.95 |
−1.051 |
1.899 |
| SrTiO3 |
3.22 |
−0.881 |
2.339 |
The photocatalytic activities of these samples were evaluated through photocatalytic oxidation of NO at an indoor air level (700 ppb). NO generated from the combustion of fossil fuels is one of the main sources causing acid rain and photochemical smog. Traditional methods for disposal of NO include physical adsorption, biofiltration, and thermal catalysis. In comparison, photocatalytic decomposition of NO has advantages like low energy consumption, removal of low concentration of NO and environmental friendliness. Before illumination, the samples were exposed to continuous NO gas flow for 30 min to reach the adsorption–desorption equilibrium. Under full spectrum irradiation, all of them exhibited photocatalytic activity toward NO oxidation: the concentration of NO decreases rapidly within the first 5 min after illumination and then becomes stable for all samples (Fig. 7). Particularly, PbTiO3 presents the highest NO removal efficiency of 43%, followed by SrTiO3 (40%) and BaTiO3 (30%), whereas the removal efficiency for both BaxPb1−xTiO3 and SrxPb1−xTiO3 is only approximately 20%. Control experiments show that the remaining TiO2 nanosheet in ATiO3 also has some photocatalytic activity for the degradation of NO (Fig. S4†); however, it should not be the main source of the photocatalytic activity in the ATiO3 samples, judging from their low content in the samples and the uncorrelated activity with the remaining amount of TiO2. In addition, PbTiO3 reveals stable photocatalytic activity reflected from the recycling experiments. As shown in Fig. 8, after running five cycles, NO removal ratio over PbTiO3 can still reach ca. 40% under full spectrum irradiation, while other samples showed different degrees of attenuation. Given that BaxPb1−xTiO3, PbTiO3 and SrxPb1−xTiO3 are responsive to visible light (cf. Fig. 6), the visible light driven photocatalytic activities of all the samples were evaluated as well. With respect to optical absorption, BaxPb1−xTiO3, PbTiO3 and SrxPb1−xTiO3 are more active under visible light irradiation than SrTiO3 and BaTiO3 (Fig. S5a†), as neither of them can absorb visible light. Furthermore, the monitoring of the intermediates (selectivity) could be equally important with the activity because the intermediates (NO2) are also harmful to human health. The desired oxidation products should be the ionic species (NO3−) as they can be washed away. Therefore, the concentration of the incomplete NO oxidation product, NO2, is an important evaluation standard during the photocatalytic process. Usually, the weaker the oxidation ability of the photogenerated holes is, the larger the concentration of NO2 will be. NO2 was monitored online under both full spectrum and visible light irradiation as shown in Fig. 7b and 5b. Regardless of the light sources, the fraction of NO2 generated over SrTiO3 and BaTiO3 was remarkably lower than that over other samples, which indicates that SrTiO3 and BaTiO3 could possess stronger oxidation ability and promote the oxidation of NO2 to final NO3−.3 From Fig. 7, we noted that the oxidation ability order (SrxPb1−xTiO3 < BaxPb1−xTiO3 < PbTiO3 < SrTiO3 < BaTiO3) is quite different from the activity order (BaxPb1−xTiO3 < SrxPb1−xTiO3 < BaTiO3 < SrTiO3 < PbTiO3). These results demonstrate that not only the activity but also the selectivity of ATiO3 could be tuned through the modification of A site elements.
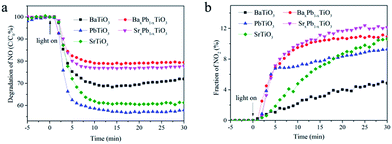 |
| | Fig. 7 Concentration changes of NO (a) and NO2 (b) in the presence of ATiO3 under irradiation. Light source: 150 W commercial tungsten halogen lamp; flowing rate of air: 1.51 L min−1; flowing rate of NO: 12.1 mL min−1. | |
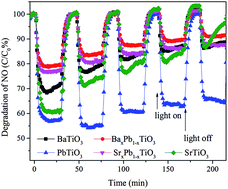 |
| | Fig. 8 Recycling runs of photocatalytic oxidation of NO over PbTiO3 under full spectrum irradiation. | |
3.4 Electrochemical and photoelectrochemical measurements
In general, the photocatalytic performance is mainly governed by three processes: light absorption, charge separation and migration, and surface redox potential. Clearly, the different photocatalytic activity of ATiO3 could not be solely attributed to BET surface area (cf. Table 1). In addition, the charge separation and migration as well as surface redox potential could play important roles in this system.
Mott–Schottky (MS) curve was then analysed to determine the surface redox potential of the samples.45 As shown in Fig. 9a, all the ATiO3 samples exhibited MS curve with anti-S type and positive slope in the linear region, illustrating that they are n-type semiconductors. Therefore, the flat band potential (Efb) could be an indication of the position of the conduction band edge (ECB) for ATiO3, which was obtained from the interception of tangent in the linear region. Combined with the band gap value calculated from the UV-Vis DRS data (Fig. 6), we can determine the exact position of the conduction band edge and the valence band edge (EVB) of ATiO3 (Fig. 9b and Table 2). The value of EVB for ATiO3 increased in the following order: SrxPb1−xTiO3 < BaxPb1−xTiO3 < PbTiO3 < SrTiO3 < BaTiO3, and matched with the order of the generated fraction of NO2 (Fig. 7b). A less positive valence band position often indicates weaker oxidation ability and hence a larger amount of incomplete oxidation product, NO2.
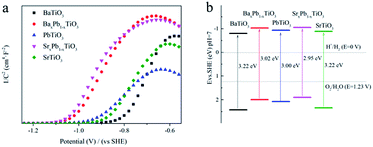 |
| | Fig. 9 (a) MS plots (vs. SHE) and (b) schematic illustration of the band gap structures (vs. SHE) of ATiO3. | |
Fig. 10a shows the transient photocurrent response of ATiO3 under periodical light on–off cycles. All the ATiO3 samples present positive current with light-on, further confirming that they are n-type semiconductors. Though a photocurrent spike occurs immediately after illumination for PbTiO3, the photocurrent generated by PbTiO3 is still much stronger than others and the transient photocurrent is well maintained (with a photocurrent intensity of ca. 0.6 μA cm−2) after 10 on–off cycles. In contrast, the photocurrent obtained from SrxPb1−xTiO3 and BaxPb1−xTiO3 is smaller than 0.2 μA cm−2. For SrTiO3 and BaTiO3, their corresponding photocurrent is very close to each other in the beginning; however, the photocurrent decay for BaTiO3 is more prominent. These results demonstrate that the charge separation efficiency is the highest for PbTiO3 and lowest for SrxPb1−xTiO3 and BaxPb1−xTiO3, and charge separation efficiency of SrTiO3 should be higher than that of BaTiO3. These results are further confirmed by electrochemical impedance spectroscopy (EIS) investigations (Fig. 10b): the resistance of PbTiO3 is much smaller than that of SrxPb1−xTiO3, BaxPb1−xTiO3 and BaTiO3 is the largest. Both the photocurrent and EIS results agree well with the order of photocatalytic activity (BaxPb1−xTiO3 < SrxPb1−xTiO3 < BaTiO3 < SrTiO3 < PbTiO3) (cf. Fig. 7a). These results demonstrated that the photocatalytic activity of ATiO3 is mainly determined by charge separation efficiency. With the highest charge separation efficiency, more photogenerated holes could migrate to the surface of PbTiO3 and participate in the oxidation of NO, which results in the highest removal proportion of NO.
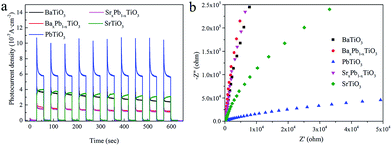 |
| | Fig. 10 (a) Transient photocurrent versus time and (b) electrochemical impedance tests of ATiO3 (in dark). | |
4. Conclusions
In this study, ATiO3 (A = Pb, Sr and Ba) with perovskite-type oxides has been successfully synthesized via a hydrothermal and self-template method from anatase TiO2 nanosheet precursor. Under the same reaction conditions, BaTiO3, PbTiO3 and SrTiO3 nanoparticles could be obtained with round-shaped, nanosheet and cubic morphology, respectively. Dynamics analysis shows that the crystallization of PbTiO3 is much slower than that of SrTiO3 and BaTiO3, and the growth mechanism of ATiO3 is temperature independent in the interval from 140 to 160 °C. Under light illumination, PbTiO3 shows higher photocatalytic activities than others for NO removal, whereas BaTiO3 yields less amount of NO2 during the process. These are closely related to their electronic structure and charge separation efficiency, as evidenced from the electrochemical and photoelectrochemical measurements. These results demonstrate that both the photocatalytic activity and selectivity of ATiO3 could be tuned through the modification of A site elements.
Acknowledgements
Financial support from the Large Scientific Apparatus Joint Funds of the National Natural Science Foundation of China (U1232119), Sichuan Youth Science and Technology Foundation (2014JQ0017) and the Innovative Research Team of Sichuan Province (2016TD0011) is gratefully acknowledged. We thank SSRF for beamtime at beamline BL14B1.
Notes and references
- M. Anpo, T. H. Kim and M. Matsuoka, Catal. Today, 2009, 142, 114–124 CrossRef CAS.
- K. Shimura and H. Yoshida, Energy Environ. Sci., 2011, 4, 2467–2481 CAS.
- W. C. Wan, S. Yu, F. Dong, Q. Zhang and Y. Zhou, J. Mater. Chem. A, 2016, 4, 7823–7829 CAS.
- X. B. Chen, L. Liu, P. Y. Yu and S. S. Mao, Science, 2011, 331, 746–750 CrossRef CAS PubMed.
- X. C. Wang, K. Maeda, A. Thomas, K. Takanabe, G. Xin, J. M. Carlsson, K. Domen and M. Antonietti, Nat. Mater., 2009, 8, 76–80 CrossRef CAS PubMed.
- H. W. Huang, Y. He, Z. S. Lin, L. Kang and Y. H. Zhang, J. Phys. Chem. C, 2013, 117, 22986–22994 CAS.
- A. Fujishima and K. Honda, Nature, 1972, 238, 37–38 CrossRef CAS PubMed.
- H. G. Yang, C. H. Sun, S. Z. Qiao, J. Zou, G. Liu, S. C. Smith, H. M. Cheng and G. Q. Lu, Nature, 2008, 453, 638–641 CrossRef CAS PubMed.
- R. Asahi, T. Morikawa, T. Ohwaki, K. Aoki and Y. Taga, Science, 2001, 293, 269–271 CrossRef CAS PubMed.
- J. H. Wu, S. C. Hao, J. M. Lin, M. L. Huang, Y. F. Huang, Z. Lan and P. J. Li, Cryst. Growth Des., 2008, 8, 247–252 CAS.
- H. Choi, Y. J. Kim, R. S. Varma and D. D. Dionysiou, Chem. Mater., 2006, 18, 5377–5384 CrossRef CAS.
- J. Zhou, G. L. Zhao, B. Song and G. R. Han, CrystEngComm, 2011, 13, 2294–2302 RSC.
- J. Zhang, J. H. Bang, C. C. Tang and P. V. Kamat, ACS Nano, 2010, 4, 387–395 CrossRef CAS PubMed.
- Q. Kuang and S. H. Yang, ACS Appl. Mater. Interfaces, 2013, 5, 3683–3690 CAS.
- J. M. Peng, Y. Zhou, H. Wang, H. R. Zhou and S. Y. Cai, CrystEngComm, 2015, 17, 1805–1812 RSC.
- T. Hara, T. Ishiguro, N. Wakiya and K. Shinozaki, Mater. Sci. Eng., B, 2009, 161, 142–145 CrossRef CAS.
- J. H. Pan, C. Shen, I. Ivanova, N. Zhou, X. Z. Wang, W. C. Tan, Q. H. Xu, D. W. Bahnemann and Q. Wang, ACS Appl. Mater. Interfaces, 2015, 7, 14859–14869 CAS.
- Y. Kim, H. Han, Y. Kim, W. Lee, M. Alexe, S. Baik and J. K. Kim, Nano Lett., 2010, 10, 2141–2146 CrossRef CAS PubMed.
- M. Alexe and D. Hesse, J. Mater. Sci., 2006, 41, 1–11 CrossRef CAS.
- S. M. Yin, H. Tian, Z. H. Ren, X. Wei, C. Y. Chao, J. Y. Pei, X. Li, G. Xu, G. Shen and G. R. Han, Chem. Commun., 2014, 50, 6027–6030 RSC.
- T. Kimijima, K. Kanie, M. Nakaya and A. Muramatsu, Appl. Catal., B, 2014, 144, 462–467 CrossRef CAS.
- Y. F. Cui, J. Briscoe and S. Dunn, Chem. Mater., 2013, 25, 4215–4223 CrossRef CAS.
- D. Sharma, S. Upadhyay, V. R. Satsangi, R. Shrivastav, U. V. Waghmare and S. Dass, Appl. Catal., B, 2016, 189, 75–85 CrossRef CAS.
- L. G. Devi and G. Krishnamurthy, J. Hazard. Mater., 2009, 162, 899–905 CrossRef CAS PubMed.
- P. R. Ren, H. Q. Fan and X. Wang, Appl. Phys. A: Mater. Sci. Process., 2013, 111, 1139–1145 CrossRef CAS.
- Q. Zhang, Y. Huang, L. F. Xu, J. J. Cao, W. K. Ho and S. C. Lee, ACS Appl. Mater. Interfaces, 2016, 8, 4165–4174 CAS.
- W. J. Dong, B. J. Li, Y. Li, X. B. Wang, L. N. An, C. R. Li, B. Y. Chen, G. Wang and Z. Shi, J. Phys. Chem. C, 2011, 115, 3918–3925 CAS.
- Y. Li, X. P. Gao, G. R. Li, G. L. Pan, T. Y. Yan and H. Y. Zhu, J. Phys. Chem. C, 2009, 113, 4386–4394 CAS.
- X. H. Yang, Z. Li, G. Liu, J. Xing, C. Sun, H. G. Yang and C. Li, CrystEngComm, 2010, 13, 1378–1383 RSC.
- X. G. Han, Q. Kuang, M. S. Jin, Z. X. Xie and L. S. Zheng, J. Am. Chem. Soc., 2009, 131, 3152–3153 CrossRef CAS PubMed.
- M. Ou, D. Fan, Z. Wei and Z. B. Wu, Chem. Eng. J., 2014, 255, 650–658 CrossRef CAS.
- K. Janghorban, J. S. Kirkaldy and G. C. Weatherly, J. Phys.: Condens. Matter, 2001, 13, 8661–8676 CrossRef CAS.
- K. S. W. Sing, D. H. Everett, R. A. W. Haul, L. Moscou, R. A. Pierotti, J. Rouquerol and T. Siemieniewska, Pure Appl. Chem., 1985, 57, 603–619 CrossRef CAS.
- A. Michailovski, J. D. Grunwaldt, A. Baiker, R. Kiebach, W. Bensch and G. R. Patzke, Angew. Chem., Int. Ed., 2005, 44, 5643–5647 CrossRef CAS PubMed.
- Y. Zhou, E. Antonova, Y. H. Lin, J. D. Grunwaldt, W. Bensch and G. R. Patzke, Eur. J. Inorg. Chem., 2012, 5, 783–789 CrossRef.
- A. Testino, M. T. Buscaglia, V. Buscaglia, M. Viviani, C. Bottino and P. Nanni, Chem. Mater., 2004, 16, 1536–1543 CrossRef CAS.
- J. O. Eckert, C. C. Hung-Houston, B. L. Gersten, M. M. Lencka and R. E. Riman, J. Am. Ceram. Soc., 2005, 79, 2929–2939 CrossRef.
- J. Moon, E. Suvaci, A. Morrone, S. A. Costantino and J. H. Adair, J. Eur. Ceram. Soc., 2003, 23, 2153–2161 CrossRef CAS.
- Y. Zhou, E. Antonova, W. Bensch and G. R. Patzke, Nanoscale, 2010, 2, 2412–2417 RSC.
- J. D. Hancock and J. H. Sharp, J. Am. Ceram. Soc., 1972, 55, 74–77 CrossRef CAS.
- A. S. Shaikh and G. M. Vest, J. Am. Ceram. Soc., 1986, 69, 682–688 CrossRef CAS.
- F. Maxim, P. M. Vilarinho, P. Ferreira, I. M. Reaney and I. Levin, Cryst. Growth Des., 2011, 11, 3358–3365 CAS.
- Y. Zhou, N. Pienack, W. Bensch and G. R. Patzke, Small, 2009, 5, 1978–1983 CrossRef CAS PubMed.
- Y. Zhou, J. D. Grunwaldt, F. Krumeich, K. B. Zheng, G. R. Chen, J. Stotzel, R. Frahm and G. R. Patzke, Small, 2010, 6, 1173–1179 CrossRef CAS PubMed.
- Y. F. Liu, Y. H. Lv, Y. Y. Zhu, D. Liu, R. L. Zong and Y. F. Zhu, Appl. Catal., B, 2014, 147, 851–857 CrossRef CAS.
Footnotes |
| † Electronic supplementary information (ESI) available: EDXS elemental mapping of BaxPb1−xTiO3 and SrxPb1−xTiO3, nitrogen adsorption–desorption tests as well as the pore diameter of ATiO3, XRD patterns of PbTiO3 measured at different reaction time, photocatalytic removal of NO and evolution of NO2 by TiO2 under full spectrum illumination, and by ATiO3 under visible light irradiation. See DOI: 10.1039/c7ra02433a |
| ‡ These authors contributed equally to this work and should be considered co-first authors. |
|
| This journal is © The Royal Society of Chemistry 2017 |
Click here to see how this site uses Cookies. View our privacy policy here.  Open Access Article
 *ab
*ab


![[thin space (1/6-em)]](https://www.rsc.org/images/entities/char_2009.gif) :
:![[thin space (1/6-em)]](https://www.rsc.org/images/entities/char_2009.gif) 1). In addition to ATiO3 with single element of A site, we also introduced Pb atom in BaTiO3 and SrTiO3 to prepare BaxPb1−xTiO3 and SrxPb1−xTiO3. Due to the introduction of Pb atom in BaTiO3, crystal defects were formed, thereby broadening the diffraction peaks of BaxPb1−xTiO3 when compared to BaTiO3 (Fig. 1a), but the position of the peaks was almost similar to that of BaTiO3. However, for SrxPb1−xTiO3, the diffraction peaks of PbTiO3 could be clearly found in addition to the diffraction peaks of SrTiO3 (club symbol in Fig. 1c). In general, the formation of solid solution between two materials depends on their matching extent in several factors such as crystal structure, electronegativity and chemical valence. For instance, the ionic radius of the two elements should be close to each other (with a difference less than 15%).32 This is particularly important for ATiO3, as each atom on A site is highly coordinated with 12 nearby oxygen atoms. The ionic radii of Sr, Ba and Pb are 1.44, 1.61 and 1.49 Å, respectively. The difference between them was within 15%, indicating that the generation of the solid solution from BaTiO3 or SrTiO3 and PbTiO3 was possible. In addition, the electronegativity and chemical valence of these three atoms were similar as well. Nevertheless, it should be noted that a similar crystal structure of these materials was also necessary for the formation of a solid solution. SrTiO3 has a different cubic crystal structure from BaTiO3 and PbTiO3, and both the latter have a similar tetragonal structure. Therefore, a solid solution (BaxPb1−xTiO3) was obtained from BaTiO3 and PbTiO3 (cf. Fig. 1a), whereas SrTiO3 and PbTiO3 tended to form a composite (SrxPb1−xTiO3), as evidenced from the XRD pattern (Fig. 1c).
1). In addition to ATiO3 with single element of A site, we also introduced Pb atom in BaTiO3 and SrTiO3 to prepare BaxPb1−xTiO3 and SrxPb1−xTiO3. Due to the introduction of Pb atom in BaTiO3, crystal defects were formed, thereby broadening the diffraction peaks of BaxPb1−xTiO3 when compared to BaTiO3 (Fig. 1a), but the position of the peaks was almost similar to that of BaTiO3. However, for SrxPb1−xTiO3, the diffraction peaks of PbTiO3 could be clearly found in addition to the diffraction peaks of SrTiO3 (club symbol in Fig. 1c). In general, the formation of solid solution between two materials depends on their matching extent in several factors such as crystal structure, electronegativity and chemical valence. For instance, the ionic radius of the two elements should be close to each other (with a difference less than 15%).32 This is particularly important for ATiO3, as each atom on A site is highly coordinated with 12 nearby oxygen atoms. The ionic radii of Sr, Ba and Pb are 1.44, 1.61 and 1.49 Å, respectively. The difference between them was within 15%, indicating that the generation of the solid solution from BaTiO3 or SrTiO3 and PbTiO3 was possible. In addition, the electronegativity and chemical valence of these three atoms were similar as well. Nevertheless, it should be noted that a similar crystal structure of these materials was also necessary for the formation of a solid solution. SrTiO3 has a different cubic crystal structure from BaTiO3 and PbTiO3, and both the latter have a similar tetragonal structure. Therefore, a solid solution (BaxPb1−xTiO3) was obtained from BaTiO3 and PbTiO3 (cf. Fig. 1a), whereas SrTiO3 and PbTiO3 tended to form a composite (SrxPb1−xTiO3), as evidenced from the XRD pattern (Fig. 1c).


