 Open Access Article
Creative Commons Attribution 3.0 Unported Licence
Herb–herb pharmacokinetic interaction between Glehniae radix and Ophiopogonis radix in rats using superimposed multiple product ion (SMPI) LC-HR-MS/MS†
Xiaowei Shi‡
 a,
Shuang Wang‡a,
Qi Qiana,
Na Zhoua,
Pengcheng Qia,
Xiyan Mua and
Qiao Wang*ab
aDepartment of Pharmaceutical Analysis, School of Pharmaceutical Sciences, Hebei Medical University, Shijiazhuang, 050017, China. E-mail: qiaowang88@hotmail.com; Fax: +86-311-86266409; Tel: +86-311-86265625
bInstitute of Chinese Integrative Medicine, Hebei Medical University, Shijiazhuang, 050017, China
First published on 7th June 2017
Abstract
The combination of Glehniae radix (Beishashen, GR) and Ophiopogonis radix (Maidong, OR) has long been widely used as a traditional Chinese medicine (TCM) herb pair for the treatment of respiratory system and digestive system diseases. The pharmacokinetic interaction mechanism of these two herbs is still unclear. The aim of the study is to elucidate the potential herb–herb pharmacokinetic interaction between Glehniae radix and Ophiopogonis radix in rats. Three groups of Sprague-Dawley rats (n = 6) were given GR (20 g kg−1), OR (20 g kg−1) and GR–OR (20 + 20 g kg−1), respectively. To study the pharmacokinetic characteristics, nine components were determined in plasma with a newly developed superimposed multiple product ion (SMPI) liquid chromatography high resolution tandem mass spectrometry (LC-HR-MS/MS) method. The SMPI LC-HR-MS/MS method displayed high specificity and sensitivity. Co-administration of GR with OR could significantly increase the area under the concentration–time curve (AUC) of the nine analytes compared with the administration of a single herb (GR or OR). There were no obvious changes for the MRT0−∞ of the nine analytes except that the value for psoralen increased. The t1/2 values of the nine analytes did not display obvious differences between the GR–OR group and single herb (GR or OR) groups. The Cl/F of the nine analytes significantly decreased in the GR–OR group compared with that in the single herb (GR or OR) groups except for that of isopimpinellin. The present study showed that the GR–OR herb pair had an influence on the pharmacokinetic behaviors of the nine compounds, which could increase the bioavailabilities of the nine analytes, indicating that the co-administration of GR with OR can cause significant herb–herb pharmacokinetic interaction in rats. In addition, this study provides pharmacokinetic experimental evidence for the compatibility (Peiwu) study of the GR–OR herb pair.
1. Introduction
Herb pairs are relatively reasonable combinations of two herbs in traditional Chinese medicine (TCM) and are also the most fundamental and simplest form of multi-herb formulae.1,2 Herb pairs are a typical form of compatibility of TCM, which can reduce the toxicity and increase the efficacy of herbs.3 Herb–herb pharmacokinetic interactions between herb pairs can provide important clues in the research for the compatibility (Peiwu) of TCM.2 In fact, an increasing number of compatibility studies for TCM focus on the herb pair pharmacokinetic interactions based on multiple bioactive constituents.4–6The combination of Glehniae radix (GR) and Ophiopogonis radix (OR) is a classic herb pair for the treatment of respiratory system and digestive system diseases used in many TCM prescriptions, including the Bawu decoction, Shenmai-ejiao decoction, Shashen-maidong decoction,7 Yiguanjian8 etc. GR (Beishashen, the dried root of Glehnia littoralis Fr. Schmidt ex Miq.) and OR (Maidong, the root of Ophiopogon japonicus (L. f) Ker-GawL) have been recorded in the Chinese Pharmacopoeia.9 Coumarins, such as oxypeucedanin, bergapten, imperatorin, cnidilin, isoimperatorin, xanthotoxol, and byakangelicin,10 are the main constituents in GR with anti-tumor, anti-inflammation, anti-bacterial and anti-oxidative functions.11,12 Steroidal saponins and homoisoflavonoids are considered the main bioactive constituents of OR due to their multiple pharmacological activities.13 Both GR9 and OR9,13 possess nourishing yin and generate body fluid in TCM theory. Therefore, the GR–OR herb pair may have potential synergistic effects. However, very few studies concerning the compatibility of the GR–OR herb pair have been reported. Thus, it is necessary to study herb–herb pharmacokinetic interaction between the GR–OR herb pair to reveal the mechanism of compatibility.
With the increasing application of liquid chromatography tandem electrospray ionization mass spectrometry (LC-MS/MS) methods in multi-component analysis, herb pharmacokinetics studies have received significant development. In previous studies, we established LC-MS/MS methods for the qualitative and quantitative analysis of coumarins in GR14,15 and in rat plasma,16 urine and bile after the oral administration of GR extract.17 Wu et al.18 studied the pharmacokinetics of 3 components (liquiritin, xanthotoxin and methylophiopogonanone A) in Shashen Maidong decoction in rat plasma with LC-MS/MS. In addition, Liu et al.19 detected 50 types of ophiopogonin components from OR in rat plasma and calculated pharmacokinetic coefficients for 28 of them using time-of-flight (TOF) LC-high resolution (HR)-MS/MS. However, it is difficult to have a method to balance the different types of components and the huge differences in concentration. Therefore, in this study, we developed a superimposed multiple product ions (SMPI) LC-HR-MS/MS method, which has high quantitative resolution with TOF-MS/MS identification to eliminate interferences and decrease signal noise, and the sensitivity significantly increases by multiple product ions signal adduct quantitative method and improvement of S/N (signal to noise). The SMPI LC-HR-MS/MS method was applied to multi-component analysis in rat plasma from rats administered GR and OR. As a result, the pharmacokinetic parameters and the pharmacokinetic differences of the nine components after the administration of single-herb extracts and GR–OR extracts were obtained, and the statistical significance was analyzed. The study showed that there was a significant herb–herb pharmacokinetic interaction between the GR–OR herb pair in rats.
2. Materials and methods
Chemicals and reagents
Psoralen, imperatorin and pectolinarigenin were purchased from the National Institutes for Food and Drug Control (Beijing, China). Xanthotoxin, bergapten, pimpinellin, isopimpinellin and methylophiopogonanone B were obtained from the Jiangsu Yongjian Pharmaceutical Technology Co., Ltd. (Jiangsu, China). Ophiopogonin D was purchased from the Shanghai Yilin Biological Technology Co., Ltd. (Shanghai, China). Methylophiopogonanone A and methylophiopogonone A were provided by the Shanghai Sunny Biotech Co., Ltd. (Shanghai, China). Among these standards, pimpinellin and pectolinarigenin were used as internal standards (IS).HPLC grade acetonitrile was purchased from the Tedia Company (USA). HPLC grade acetic acid was from the Diamond Technology Incorporation. Purified water was from the Hangzhou Wahaha Group Co., Ltd. (Hangzhou, China). GR and OR were purchased from the Lerentang Pharmaceutical Co., Ltd. (Shijiazhuang, China).
Instrumentation and analytical conditions
The UHPLC system was a Prominence™ UHPLC system (Shimadzu, Japan) equipped with a CBM-20A controller, DGU-20A3 degasser, LC-30AD solvent delivery system, SIL-30AC autosampler, and CTO-30AC column oven. LC separations were accomplished on a Phenomenex Kinetex C18 100 Å column (50 × 3.0 mm, 2.6 μm) at ambient temperature. The mobile phase was composed of 0.03% acetic acid (A) and acetonitrile (B) for gradient elution. For GR, the following gradient was used: 35% B (0–1.0 min), 35–45% B (1.0–3.0 min), 45–90% B (3.0–4.5 min), 90–35% B (4.5–5.0 min), and 35% B (5.0–10.0 min). For OR the gradient was as follows: 35% B (0–0.1 min), 35–95% B (0.1–4.0 min), 95% B (4.0–4.5 min), 95–35% B (4.5–5.0 min), and 35% B (5.0–10.0 min). The flow rate was set at 0.4 mL min−1, the injection volume was 20 μL, and the data were acquired in 5 minutes.The TOF-MS detection was performed on a Triple TOF™ 5600 + system (AB SCIEX, USA) with Duo-Spray™ ion sources in the electrospray ionization (ESI) mode. Analyst® TF 1.7 software was used to control the instrument and for data acquisition as well as analysis. GR and OR were detected under the positive and negative ESI modes, respectively. The parameters of the mass spectrometer were set as follows: ion spray voltage, 5.5/−4.5 kV; turbo spray temperature, 550 °C; declustering potential (DP), 60/−60 V; collision energy (CE), 35/−55 eV; collision energy spread (CES), 0 eV; and accumulation time, 100 ms. Nitrogen was used as the curtain gas, nebulizer gas (gas 1) and heater gas (gas 2), which were set to 35, 55 and 55 psi, respectively. The SMPI LC-HR-MS/MS transitions of 9 constituents in GR and OR and two internal standards are listed in Table 1. Fig. 1 shows the structures and TOF MS/MS mass spectra of 11 analytes in the positive and negative modes. For quantitative SMPI method, the adduct peak area of 2 to 5 main product ions of each analyte or IS was employed to increase the sensitivity of this method. And the mass tolerance of ±0.01 Da was used to eliminate interferences and decrease signal noise.
| ESI mode | Compound | tR (min) | MS (m/z) | MS/MS (m/z) |
|---|---|---|---|---|
| Positive for GR | Xanthotoxin | 2.44 | 217.05 | 174.0309 + 202.0257 |
| Bergapten | 3.01 | 217.05 | 174.0309 + 202.0257 | |
| Isopimpinellin | 3.00 | 247.06 | 217.0129 + 189.0177 | |
| Imperatorin | 4.62 | 271.10 | 203.0340 + 147.0441 | |
| Psoralen | 2.26 | 187.04 | 131.0491 + 115.0542 | |
| Pimpinellin, IS | 3.34 | 247.06 | 231.0288 + 203.0337 | |
| Negative for OR | Ophiopogonin D | 2.51 | 913.47 | 721.4210 + 575.3611 |
| Methylophiopogonanone A | 3.26 | 341.10 | 177.0556 + 178.0641 + 149.0246 + 205.0511 + 163.0405 | |
| Methylophiopogonanone B | 3.35 | 327.10 | 177.0556 + 178.0641 + 149.0246 + 205.0511 + 163.0405 | |
| Methylophiopogonone A | 3.19 | 339.10 | 217.0508 + 131.0509 + 189.0556 | |
| Pectolinarigenin, IS | 2.47 | 313.07 | 283.0255 + 298.0487 |
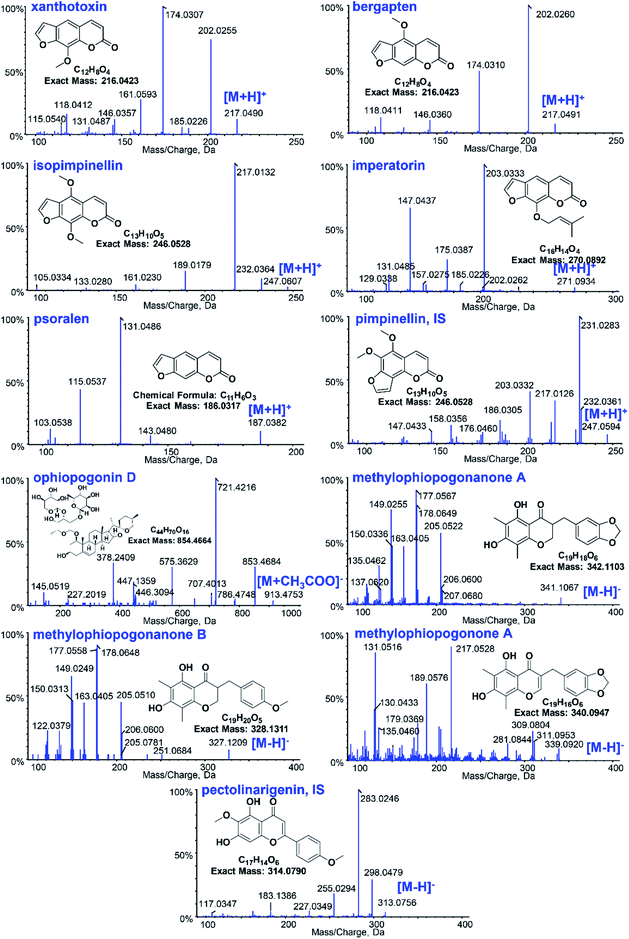 | ||
| Fig. 1 The structures and mass spectra of the 11 analytes of Glehniae radix and Ophiopogonis radix as well as the ISs in positive and negative modes. | ||
The conventional triple quadrupole LC-MS/MS with multiple reaction monitoring (MRM) was performed on a 3200 Q TRAP mass spectrometer coupled to an Agilent 1200 HPLC system (AB Sciex, Cheshire, UK). The LC method was the same as those of SMPI LC-HR-MS/MS. The parameters of the mass spectrometer were set as follows: ion spray voltage, 5.5/−4.5 kV; turbo spray temperature, 550 °C. Nitrogen was used as the curtain gas, nebulizer gas (gas 1) and heater gas (gas 2), which were set to 35, 55 and 55 psi, respectively. The LC-MS/MS transitions of 9 constituents in GR and OR are listed in ESI Table S1.†
Preparation of stock and working solutions, calibration standard and quality control standard
Mixed standard stock solutions of the 11 analytes, including 2 ISs, were prepared in methanol. Working solutions of the 11 analytes at the desired concentration for the preparation of calibration standards and quality control (QC) standards were prepared daily by serial dilution with water/acetonitrile (65![[thin space (1/6-em)]](https://www.rsc.org/images/entities/char_2009.gif) :
:![[thin space (1/6-em)]](https://www.rsc.org/images/entities/char_2009.gif) 35) containing 0.03% formic acid. The concentration of two ISs, pimpinellin and pectolinarigenin, in working solutions was 140 ng mL−1 and 100 ng mL−1, respectively. All stock solutions were stored at −20 °C.
35) containing 0.03% formic acid. The concentration of two ISs, pimpinellin and pectolinarigenin, in working solutions was 140 ng mL−1 and 100 ng mL−1, respectively. All stock solutions were stored at −20 °C.
Preparation of the herbal extract for gavage
In order to prevent chemical changes from the herb pair GR–OR being extracted together, we prepared GR and OR extracts before combining them. GR (100 g) and OR (100 g) were extracted three times by refluxing with water for 1 h each time with herb–water ratios (w/v) of 1![[thin space (1/6-em)]](https://www.rsc.org/images/entities/char_2009.gif) :
:![[thin space (1/6-em)]](https://www.rsc.org/images/entities/char_2009.gif) 10, 1
10, 1![[thin space (1/6-em)]](https://www.rsc.org/images/entities/char_2009.gif) :
:![[thin space (1/6-em)]](https://www.rsc.org/images/entities/char_2009.gif) 10 and 1
10 and 1![[thin space (1/6-em)]](https://www.rsc.org/images/entities/char_2009.gif) :
:![[thin space (1/6-em)]](https://www.rsc.org/images/entities/char_2009.gif) 5. The water extracts were filtrated, merged and condensed by a rotatory evaporator under reduced pressure. Finally, the water extracts were freeze-dried to obtain the GR extract and OR extract, with yields of 43.83% and 77.50%, respectively.
5. The water extracts were filtrated, merged and condensed by a rotatory evaporator under reduced pressure. Finally, the water extracts were freeze-dried to obtain the GR extract and OR extract, with yields of 43.83% and 77.50%, respectively.
The GR gavage (equivalent to 1 g mL−1 GR herb) and OR gavage (equivalent to 1 g mL−1 OR herb) were prepared by dissolving GR extract and OR extract in water. The GR extract and OR extract were dissolved in water to make the GR–OR gavage (equivalent to 1 g mL−1 GR herb and 1 g mL−1 OR herb). The contents of the constituents in the gavage were as follows: xanthotoxin, 53.9 μg mL−1; bergapten, 46.8 μg mL−1; isopimpinellin, 23.4 μg mL−1; psoralen, 26.8 μg mL−1; imperatorin, 11.9 μg mL−1; ophiopogonin D, 62.3 μg mL−1; methylophiopogonone A, 7.08 μg mL−1; methylophiopogonanone B, 4.70 μg mL−1; and methylophiopogonanone A, 1.27 μg mL−1.
Animals
Seven-week old adult male Sprague-Dawley (SD) rats weighing 270 ± 20 g were purchased from the Laboratory Animal Center of Hebei Medical University (Shijiazhuang, China, Certificate No. DK0705-0076). Animals were maintained in accordance with the Guidelines of the Committee on the Care and Use of Laboratory Animals of China, and approved by the Animal Ethic Review Committee of Hebei Medical University (Shijiazhuang, China). All rats were acclimated for 7 days in an environmentally controlled breeding room. The rats were fasted for 12 hours but supplied with water before the experiments.Pharmacokinetics study
Eighteen male Sprague-Dawley rats were randomly divided into 3 groups (group GR, group OR, and group GR–OR). The three groups were administered GR (20 g kg−1), OR (20 g kg−1) or GR–OR (20 + 20 g kg−1). Blood samples were collected from the orbital venous plexus into heparinized tubes at 0.083, 0.167, 0.5, 1.0, 2.0, 4.0, 6.0, 8.0, 12 and 24 hours after oral administration. The plasma was then obtained after centrifugation for 5 min at 4500 rpm and stored at −80 °C until analysis.Preparation of plasma samples, calibration standards and QC samples
The rat plasma sample (100 μL) was spiked with 10 μL of IS and 10 μL of 35% acetonitrile. After the addition of 300 μL of acetonitrile, the mixture was vortexed and centrifuged for 10 min at 15![[thin space (1/6-em)]](https://www.rsc.org/images/entities/char_2009.gif) 000 rpm. The supernatant was transferred to a new tube and evaporated to dryness under a stream of nitrogen. Before LC-MS/MS analysis, the residue was reconstituted in 100 μL of water/acetonitrile (65
000 rpm. The supernatant was transferred to a new tube and evaporated to dryness under a stream of nitrogen. Before LC-MS/MS analysis, the residue was reconstituted in 100 μL of water/acetonitrile (65![[thin space (1/6-em)]](https://www.rsc.org/images/entities/char_2009.gif) :
:![[thin space (1/6-em)]](https://www.rsc.org/images/entities/char_2009.gif) 35) containing 0.03% acetic acid and centrifuged at 15
35) containing 0.03% acetic acid and centrifuged at 15![[thin space (1/6-em)]](https://www.rsc.org/images/entities/char_2009.gif) 000 rpm for 10 min.
000 rpm for 10 min.
Calibration standards and QC samples were constructed daily by spiking appropriate working solutions into drug-free rat plasma samples. The residues of all QC samples were stored at −80 °C in centrifuge tubes prior to analysis.
Analytical method validation
The developed method was validated for its selectivity, linearity, precision, accuracy, extraction recoveries, matrix effect and stability during sample storage and processing procedures according to the FDA guidelines for the validation of bioanalytical methods.20,21The selectivity was determined by analyzing 6 blank plasma samples, blank plasma samples spiked with analytes at the lower limit of quantification (LLOQ) level and plasma samples from rats after the oral administration of the GR–OR herb pair extract. To evaluate the linearity, a seven-point plasma calibration curve was prepared and assayed in duplicate on three consecutive days. The daily calibration curves were constructed by plotting the ratios between the analytes and IS peak areas versus the nominal standard concentrations with a weighted (1/x2) least-square linear regression. The precision and accuracy of analyte determination were determined by evaluating three level QC concentrations using six replicates on three consecutive days. Precision and accuracy were expressed by the relative standard deviation (RSD) and relative error (RE), respectively. To determine the extraction recovery and matrix effect of each analyte, extracted samples, post-extracted spiked samples, and unextracted samples (standard solution) at three concentration levels were analyzed, and the areas of the three types of samples were expressed as A1, A2, and A3, respectively. The extraction recoveries were calculated by A1/A2, and the matrix effect was evaluated by A2/A3. Stability experiments utilizing three concentration levels of QC samples were performed under five different storage conditions, including short-term stability (6 hours in room temperature conditions), long-term stability (stored at −80 °C for 30 days), freeze–thaw cycle (from −80 °C to ambient temperature, 3 times), post-preparation stability (stored in the autosampler for 6 hours after sample preparation), and post-drying stability (stored at −40 °C for 12 hours after sample drying).
Pharmacokinetic analysis and statistical analysis
MultiQuant 3.0.1 software was used to calculate the plasma concentrations of the analytes, and then obtain the plasma concentration–time curves. The main pharmacokinetic parameters of the nine analytes were calculated using a non-compartment model with WinNonlin 2.1 software (Pharsight, USA). To compare the pharmacokinetic characteristics of a single herb (GR or OR) with a herb pair (GR-OR) after oral administration, SPSS13.0 was used for statistical analysis. Data were analyzed using the student's t-test for comparison. When P < 0.05, the differences were considered statistically significant.3. Results and discussion
Method development
Fig. 2 shows the typical SMPI LC-HR-MS/MS mode for the quantitative determination of methylophiopogonanone A. For quantitative SMPI method, m/z 177.0556, m/z 178.0641, m/z 149.0246, m/z 205.0511 and m/z 163.0405 are the main product ions of methylophiopogonanone A. The peak area of methylophiopogonanone A was calculated by adduct peak areas of m/z 177.0556 ± 0.01, m/z 178.0641 ± 0.01, m/z 149.0246 ± 0.01, m/z 205.0511 ± 0.01 and m/z 163.0405 ± 0.01. The quantitative product ions of each analyte and ISs are listed in Table 1. Compared with the single most intense product ion, the signal to noise ratio (S/N) of SMPI increased from 78.7 to 204.4 at the LLOQ. Similarly, the S/Ns of SMPI increased 1.7, 1.9, 1.2, 1.2, 1.2, 1.4, 1.2, 3.8, 1.2 and 1.3 folds for xanthotoxin, bergapten, isopimpinellin, imperatorin, psoralen, pimpinellin, ophiopogonin D, methylophiopogonanone B, methylophiopogonone A and pectolinarigenin respectively. In addition, we compared the SMPI LC-HR-MS/MS method to the conventional triple quadrupole LC-MS/MS with multiple reaction monitoring (MRM). In the results of Table 2, the SMPI LC-HR-MS/MS method obviously decreased the LLOQs of the 9 analytes compared with MRM LC-MS/MS, which indicated that the SMPI LC-HR-MS/MS dramatically increases selectivity with an increase of the sensitivity.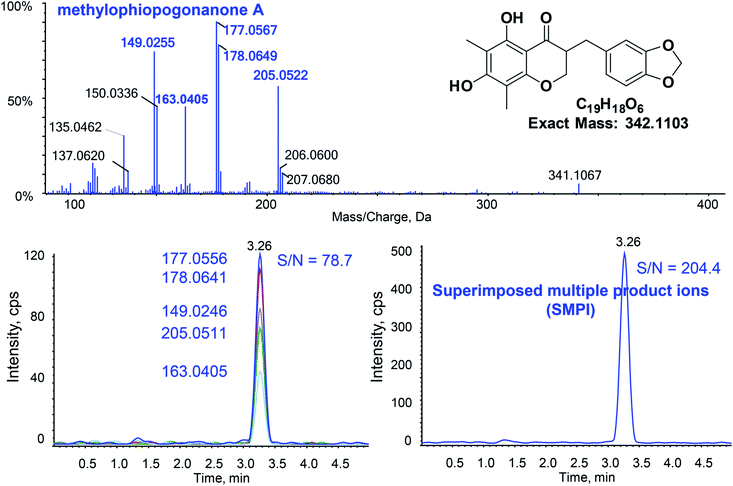 | ||
| Fig. 2 Typical SMPI LC-HR-MS/MS for the quantitative determination of methylophiopogonanone A at the LLOQ. | ||
| Compound | Regression equation | r | Linear range (ng mL−1) | LLOQ (ng mL−1) | LLOQ of LC-MS/MSa (ng mL−1) |
|---|---|---|---|---|---|
| a The results from the conventional triple quadrupole LC-MS/MS with multiple reaction monitoring (MRM) on a 3200 Q TRAP mass spectrometer coupled to an Agilent 1200 HPLC system (AB Sciex, Cheshire, UK). | |||||
| Xanthotoxin | y = 0.09576x + 0.01012 | 0.99894 | 0.040–20 | 0.040 | 4.30 |
| Bergapten | y = 0.10522x + 0.00078 | 0.99955 | 0.040–20 | 0.040 | 2.98 |
| Isopimpinellin | y = 0.25547x + 0.00625 | 0.99903 | 0.040–20 | 0.040 | 2.13 |
| Imperatorin | y = 0.25977x − 0.00972 | 0.99865 | 0.060–30 | 0.060 | 24.8 |
| Psoralen | y = 0.42982x + 0.00384 | 0.99779 | 0.060–30 | 0.060 | 16.0 |
| Ophiopogonin D | y = 0.00287x − 0.000228 | 0.99466 | 0.80–200 | 0.80 | 26.0 |
| Methylophiopogonanone A | y = 0.06263x + 0.03199 | 0.99920 | 0.30–75 | 0.30 | 2.80 |
| Methylophiopogonanone B | y = 0.04108x + 0.06062 | 0.99161 | 0.30–75 | 0.30 | 2.90 |
| Methylophiopogonone A | y = 0.03384x + 0.01891 | 0.99639 | 0.30–75 | 0.30 | 3.40 |
Method validation
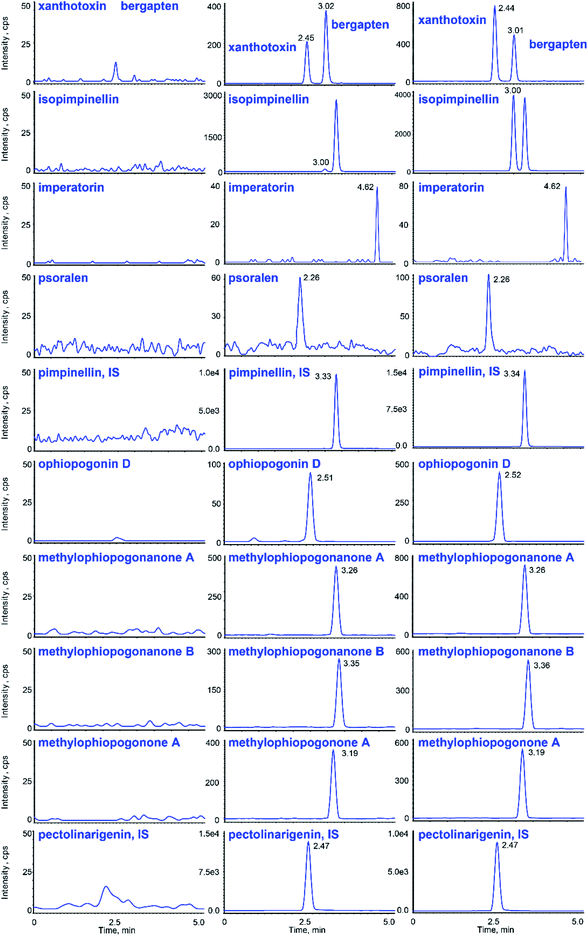
Typical chromatograms obtained from blank plasma samples, spiked plasma samples with the analytes and the IS, and plasma samples after the oral administration of gavages are shown in Fig. 3, suggesting that there were no interferences between them.The calibration curves and LLOQs of the 9 analytes are shown in Table 2. All calibration curves showed good linearity with a correlation coefficient (r) higher than 0.991, and the theoretical values were in the range of 85–105% of the real values. As shown in ESI Table S2,† all the RSDs and REs of the LLOQs were less than 20%.
The accuracy and precision data for every analyte at 3 concentrations are shown in ESI Table S2.† At each of the QC concentrations investigated, the RSDs of intra-day and inter-day analyses were less than 7.2% and 10.1%, respectively. The REs of the accuracies were in the range of −5.0–8.7%. The results demonstrated that the method was precise and accurate.
The results of the extraction recoveries and matrix effects of the nine analytes and two ISs are summarized in ESI Table S3.† The mean extraction recoveries of all the compounds were in the range of 83.2–105.5%, and matrix effects were between 88.1% and 112.5%.
The data of stability experiments are presented in ESI Table S4.† The results were in the range of 83.1–109.5%, which indicate that the stability of the method was satisfactory.
Pharmacokinetics study
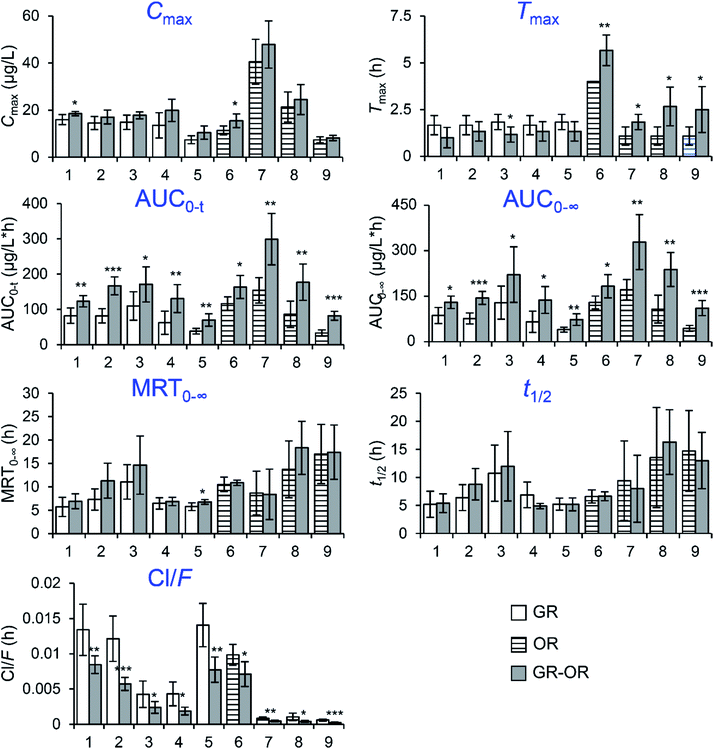
The mean plasma concentration–time curves (n = 6) of the analytes in different groups are illustrated in Fig. 4. The pharmacokinetic parameters are listed in Fig. 5, including the maximum plasma concentration (Cmax), time to reach the maximum concentration (Tmax), half-time (t1/2), area under the concentration–time curve (AUC0−t and AUC0−∞), mean retention time (MRT0−∞) and total body clearance of the drug from the plasma (Cl/F).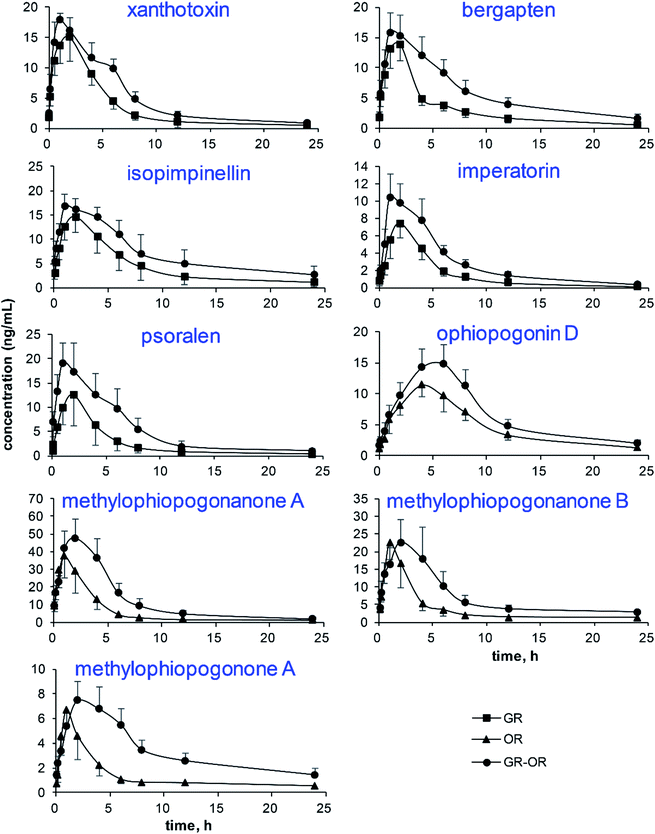 | ||
| Fig. 4 The plasma concentration–time profiles of the 9 analytes after the administration of Glehniae radix (GR), Ophiopogonis radix (OR) and Glehniae radix–Ophiopogonis radix (GR–OR) to rats. | ||
The results show that the AUC0−t and AUC0−∞ of the nine analytes significantly increased in the GR–OR group compared with the single herb (GR or OR) groups, which indicated that the co-administration of GR–OR could increase their bioavailabilities. The Cl/F values of the nine analytes significantly decreased in the GR–OR group compared with the single herb (GR or OR) groups except for isopimpinellin, suggesting that the combination may have delayed their elimination and increase the interaction time between analytes and organism. In addition, the results of Cl/F were consistent with the increases of corresponding compounds of AUC. At the same time, there were no obvious changes in the MRT0−∞ values (except for psoralen increased (P < 0.05)) and the t1/2 values of the nine analytes between the GR–OR group and the single herb (GR or OR) groups. These results show that the compatibility of GR–OR has no obvious influences on the excretion mechanism (excretion process) of these analytes in rats and could not accumulate in vivo. The Cmax values did not display obvious differences between the GR–OR group and the single herb (GR or OR) groups except for xanthotoxin and ophiopogonin D that significantly increased in the GR–OR group compared with single herb (GR or OR) groups (P < 0.05). The Tmax values of ophiopogonin D (P < 0.01), methylophiopogonanone A (P < 0.05), methylophiopogonanone B (P < 0.05) and methylophiopogonone A (P < 0.05) significantly increased in the GR–OR group compared with the OR group, while Tmax of isopimpinellin (P < 0.05) significantly decreased in the GR–OR group compared with the GR group and no significant changes for coumarins such as xanthotoxin, bergapten, imperatorin and psoralen.
As shown in Fig. 5, the increases in the AUCs of the nine components of GR–OR were caused by herb–herb interaction between GR and OR in rats. There is evidence that cytochrome P450 2A6 (CYP2A6) is the only enzyme in human liver microsomes catalyzing coumarin 7-hydroxylation, and consequently, the formation of 7-hydroxycoumarin can be used as a probe for CYP2A6 activity.22,23 In addition, furocoumarins xanthotoxin,24 bergapten,24 psoralen25 and imperatorin26 are selective for CYP2A6 inhibition. Moreover, ophiopogonins and ophiopogonones from OR might inhibit CYP3A and CYP2C6 (ref. 27), and ophiopogonin D noncompetitively inhibited UGT1A6 while competitively inhibiting UGT1A8.28 Thus, furocoumarins, ophiopogonins and ophiopogonones presumably might be responsible for the herb–herb pharmacokinetic interaction between GR and OR in rats.
4. Conclusions
In the present study, the herb–herb pharmacokinetic interaction between GR and OR in rats was investigated by analyzing xanthotoxin, bergapten, isopimpinellin, psoralen, imperatorin, ophiopogonin D, methylophiopogonanone A, methylophiopogonanone B and methylophiopogonone A with a SMPI LC-HR-MS/MS method. The SMPI LC-HR-MS/MS method allowed high sensitive quantitative analysis with TOF-MS/MS identification and significant increases in sensitivity. It was indicated that the co-administration of GR and OR could increase the bioavailabilities of the nine analytes, but the mechanism still requires further investigation. In conclusion, this study provides pharmacokinetic experimental evidence for studying the compatibility of the herb pair GR–OR.Acknowledgements
This study was financially supported by the National Natural Science Foundation of China (81102412), the Ministry of Education Key Project of Science and Technology Foundation of China (211021), the Hundreds of Innovative Talents Project of Hebei Education Department of China, the Natural Science Foundation of Hebei Province of China (H2017206087), Hebei Science and Technology Department (17392501D) and the Educational Commission of Hebei Province of China (QN2017098).References
- C. Y. Ung, H. Li, Z. W. Cao, Y. X. Li and Y. Z. Chen, J. Ethnopharmacol., 2007, 111, 371–377 CrossRef PubMed.
- S. Wang, Y. Hu, W. Tan, X. Wu, R. Chen, J. Cao, M. Chen and Y. Wang, J. Ethnopharmacol., 2012, 143, 412–423 CrossRef PubMed.
- M. Pei, X. Duan and X. Pei, China J. Chin. Mater. Med., 2009, 34, 2047–2050 Search PubMed.
- Y. Jin, C. Qu, Y. Tang, H. Pang, L. Liu, Z. Zhu, E. Shang, S. Huang, D. Sun and J. A. Duan, J. Ethnopharmacol., 2016, 181, 158–171 CrossRef CAS PubMed.
- L. Shi, X. Tang, X. Dang, Q. Wang, X. Wang, P. He, Q. Wang, L. Liu, X. Liu and Y. Zhang, J. Ethnopharmacol., 2015, 165, 243–250 CrossRef CAS PubMed.
- S. Song, Q. Ma, Q. Tang, F. Chen, X. Xing, Y. Guo, S. Guo, X. Tan and J. Luo, J. Ethnopharmacol., 2016, 179, 356–366 CrossRef CAS PubMed.
- T. Y. Lai and H. W. Kuo, J. Tradit. Complement. Med., 2016, 6, 135–139 CrossRef PubMed.
- S. Shui, S. Shen, R. Huang, B. Xiao and J. Yang, J. Chromatogr. B: Anal. Technol. Biomed. Life Sci., 2016, 1033–1034, 80–90 CrossRef CAS PubMed.
- Chinese Pharmacopoeia Commission, The Pharmacopoeia of the People's Republic of China, Part I, China Medical Science Press, Beijing, China, 2015 Search PubMed.
- X. Zheng, X. Zhang, X. Sheng, Z. Yuan, W. Yang, Q. Wang and L. Zhang, J. Pharm. Biomed. Anal., 2010, 51, 599–605 CrossRef CAS PubMed.
- G. Hao, Z.-g. Wang, W.-y. Fu and Y. Yang, China J. Chin. Mater. Med., 2008, 33, 2016–2019 CAS.
- M. F. Abu Bakar, M. Mohamed, A. Rahmat and J. Fry, Food Chem., 2009, 113, 479–483 CrossRef CAS.
- M. H. Chen, X. J. Chen, M. Wang, L. G. Lin and Y. T. Wang, J. Ethnopharmacol., 2016, 181, 193–213 CrossRef CAS PubMed.
- W. Yang, C. Feng, D. Kong, X. Shi, X. Zheng, Y. Cui, M. Liu, L. Zhang and Q. Wang, Food Chem., 2010, 120, 886–894 CrossRef CAS.
- W. Yang, M. Ye, M. Liu, D. Kong, R. Shi, X. Shi, K. Zhang, Q. Wang and Z. Lantong, J. Chromatogr. A, 2010, 1217, 4587–4600 CrossRef CAS PubMed.
- W. Yang, C. Feng, D. Kong, X. Shi, Y. Cui, M. Liu, Q. Wang, Y. Wang and L. Zhang, J. Chromatogr. B: Anal. Technol. Biomed. Life Sci., 2010, 878, 575–582 CrossRef CAS PubMed.
- M. Liu, X. Shi, W. Yang, S. Liu, N. Wang, R. Shi, S. Qiao, Q. Wang and Y. Wang, Biomed. Chromatogr., 2011, 25, 783–793 CrossRef CAS PubMed.
- Y. Wu, X. Wei, Y. Sun, L. Zhang and Y. Liu, Chin. J. Mod. Appl. Pharm., 2016, 33, 1428–1433 Search PubMed.
- Y. N. Liu, Y. Liang and G. J. Wang, Chin. J. Exp. Tradit. Med. Formulae, 2014, 20, 137–142 CAS.
- FDA, Guidance for Industry: Bioanalytical Method Validation, http://www.fda.gov/downloads/Drugs/GuidanceComplianceRegulatoryInformation/Guidances/ucm070107.pdf.
- FDA, Guidance for Industry: Bioanalytical Method Validation (Draft guidance), http://www.fda.gov/downloads/Drugs/GuidanceComplianceRegulatoryInformation/Guidances/UCM386366.pdf.
- A. J. Draper, A. Madan and A. Parkinson, Arch. Biochem. Biophys., 1997, 341, 47–61 CrossRef CAS PubMed.
- O. Pelkonen, A. Rautio, H. Raunio and M. Pasanen, Toxicology, 2000, 144, 139–147 CrossRef CAS PubMed.
- B. Budzynska, K. Skalicka-Wozniak, M. Kruk-Slomka, M. Wydrzynska-Kuzma and G. Biala, Psychopharmacology (Berl), 2016, 233, 2289–2300 CrossRef CAS PubMed.
- L. L. Koenigs and W. F. Trager, Biochemistry, 1998, 37, 10047–10061 CrossRef CAS PubMed.
- J. Maenpaa, H. Sigusch, H. Raunio, T. Syngelma, P. Vuorela, H. Vuorela and O. Pelkonen, Biochem. Pharmacol., 1993, 45, 1035–1042 CrossRef CAS PubMed.
- C. H. Xia, J. G. Sun, G. J. Wang, L. L. Shang, X. X. Zhang, R. Zhang, Y. Peng, X. J. Wang, H. P. Hao, L. Xie and M. S. Roberts, Planta Med., 2010, 76, 245–250 CrossRef CAS PubMed.
- L. P. Jiang, J. Zhao, Y. F. Cao, M. Hong, D. X. Sun, X. Y. Sun, J. Yin, Z. T. Zhu and Z. Z. Fang, J. Evidence-Based Complementary Altern. Med., 2014, 2014, 594354 Search PubMed.
Footnotes |
| † Electronic supplementary information (ESI) available. See DOI: 10.1039/c7ra02554h |
| ‡ These authors contributed equally to this work. |
| This journal is © The Royal Society of Chemistry 2017 |

