 Open Access Article
Effects of Ir-doping on the transition from oxidative coupling to partial oxidation of methane in La2O3–CeO2 nanofiber catalysts: spatial concentration and temperature profiles
D. Noon *a,
B. Zohoura,
A. Baea,
A. Seubsaib and
S. Senkana
aDepartment of Chemical and Biomolecular Engineering, University of California, Los Angeles, CA 90095, USA. E-mail: daniel.p.noon@gmail.com
bDepartment of Chemical Engineering, Faculty of Engineering, Kasetsart University, Bangkok, Thailand 10900
First published on 19th May 2017
Abstract
Spatially resolved temperature and species concentration profiles determined via microprobe sampling and online gas chromatography were used to examine the transition from oxidative coupling of methane (OCM) to catalytic partial oxidation (CPO) as a function of Ir-doping of a La2O3–CeO2 nanofiber fabric catalyst. Experiments were performed at atmospheric pressure at a furnace temperature of 750 °C, feed gas CH4/O2 molar ratio of 5 and at a nominal space time of about 60 ms. Reaction products exhibited a dramatic shift from ethane and ethylene (OCM, C2 selectivity of 54%), in the case of the un-doped catalyst, to exclusively synthesis gas (CPO, CO and H2 selectivity 90+%), at 1% Ir doping. Species concentration profiles obtained in the latter case indicate the formation of H2O, H2 and CO first, followed by the steam reforming of CH4 to produce the balance of the syngas concomitant with a sharp decrease in H2O levels. These findings suggest a CPO mechanism that is different from the literature, calling for the revision of detailed chemical kinetic mechanisms proposed before.
Introduction
The oxidative coupling of methane (OCM) and catalytic partial oxidation (CPO) of methane are closely related reaction processes involving the transformation of CH4, the major component of natural gas, and O2 into valuable chemical intermediates that are commonly derived from petroleum or coal.1–6 Both were developed as an economic alternative to the highly endothermic steam reforming process.6,7 Despite decades of research in OCM and CPO, further developments in catalysis (activity, selectivity, stability and mechanistic understanding), reactor design (selectivity and product separation) and process safety are still needed to exploit these processes industrially.The catalytic materials for OCM are typically oxides of alkali metals (e.g. Mg, Ca) and lanthanides (e.g. La, Ce) whereas those used to accomplish methane CPO are transition and noble metals (e.g. Ni, Co, Rh, Ir, Pt).3 In OCM the CH4/O2 ratio in the feed is typically in the 3–7 range and the desired reaction products are C2H4, C2H6 and C3+ hydrocarbons with H2 and CO as co-products. On the other hand, methane CPO typically employs a CH4/O2 ratio of 1–2, producing CO and H2 (synthesis gas) as the target products.3–6
The prevailing mechanism for OCM involves coupled surface and gas phase reactions in which the critical steps are the surface generation, subsequent gas phase diffusion and coupling of methyl radicals to form C2H6.8–13
| O2 + 2[*] → 2[O] | (1) |
| CH4 + [O] → CH3 + [OH] | (2) |
| CH3 + CH3 → C2H6 | (3) |
| [OH] + [OH] → [O] + [*] + H2O | (4) |
The formation of C2H4, H2, H2O, CO and CO2 has been proposed to occur via combined surface and gas-phase reactions.9–13 Because OCM is highly exothermic, the resulting temperature increase forces the reaction to proceed under transport limitations. Nevertheless, gas phase reactions play an important role in affecting product evolution.14 Recently, we also reported that nanofibers of La2O3–CeO2 exhibit excellent OCM activities and selectivities, with combined C2+ yields (selectivity × conversion) in excess of 22%.15,16 In that work, 20–100 nm diameter nanofibers were prepared by electrospinning, which is a versatile technique capable of controlling the surface chemistry of catalysts that will be described further.
On the other hand, no uniformly applicable mechanism seems to exist for the CPO of methane.3 Nevertheless, existing literature can be grouped into two main categories. First is the direct decomposition of methane on the catalyst surface followed by the oxidation of surface moieties to form synthesis gas. This is well demonstrated in Pt and Rh catalyzed CPO,7,17–20 where the mechanism can be schematically summarized as below:
| O2 + 2[*] → 2[O] | (5) |
| CH4 + 4[*] → [C] + 4[H] | (6) |
| [C] + [O] → 2[*] + CO | (7) |
| 2[H] → 2[*] + H2 | (8) |
In the second category, methane CPO has been advocated to proceed via sequential combustion-reforming reactions, with the formation of CO2 and H2O first, followed by endothermic CO2 and H2O reforming of CH4 reactions producing CO and H2 in the second step.21 This two-step process appears to be the predominant mechanism of syngas production over transition metal based catalysts,3,21–23 where the overall reactions are:
| CH4 + 2O2 → CO2 + 2H2O | (9) |
| CH4 + CO2 → CO + H2 | (10) |
| CH4 + H2O → CO + 3H2 | (11) |
Previous methane CPO studies with Ir supported on La2O3 indicate the presence of the latter mechanism.23,24 However, this conclusion was indirectly based on separate methane combustion and CH4–H2O and CH4–CO2 reforming studies, in conjunction with CPO experiments that were all accomplished through the measurement of reactor exit gas compositions.23,24 In addition, Ir catalysts were prepared by traditional impregnation of a La2O3 support with little control over surface Ir cluster size and dispersion.24
Since the La2O3–CeO2 nanofiber fabric is an excellent OCM catalyst15 and Ir–La2O3 is the same for CPO,3 it is of scientific and practical interest to explore how Ir doping of La2O3–CeO2 would affect product selectivity. In particular, it is important to understand how the temperature and detailed species concentration profiles evolve inside the catalyst bed at relevant operating conditions and how surface and gas phase kinetics are coupled between OCM and CPO. With ample literature on the materials, lanthanide supported Ir CPO catalysts are of considerable interest for reassessing the relevant kinetic mechanisms using our unique approach. Additionally, electrospun La2O3–CeO2 nanofibers were discovered and extensively studied by the authors as novel, high-performing OCM catalysts. The potential for bridging the OCM and CPO mechanisms in this manner was first postulated when Ir-doped La2O3–CeO2 nanofibers were found to have by far the highest selectivity for CO/H2 in preliminary screenings of dopants, with the original intention of improving OCM performance. Hence, the authors have the expertise in synthesizing, testing and evaluating such catalysts and can easily translate this to thin, uniform and incrementally doped La2O3–CeO2–Ir nanofibers with precisely controlled nanostructures.25
Herein we report, for the first time, detailed spatial concentration and temperature profiles in Ir-doped La2O3–CeO2 nanofiber catalysts prepared by electrospinning. These investigations capture the dramatic change in product selectivities from OCM to CPO even at small levels of Ir doping, thus providing useful new data for the development and validation detailed chemical kinetic mechanisms.
Experimental section
Catalyst preparation
Experiments were performed using a fixed-bed tubular reactor system as shown in Fig. 1.25 The reactor was packed with La2O3–CeO2 nanofiber catalysts, both neat and doped with different levels of Ir. Catalysts were prepared by electrospinning a viscous solution of polyvinylpyrrolidone (PVP; 1.3 MDa, 0.60 g), water/ethanol (∼1![[thin space (1/6-em)]](https://www.rsc.org/images/entities/char_2009.gif) :
:![[thin space (1/6-em)]](https://www.rsc.org/images/entities/char_2009.gif) 1 wt ratio, 9.5 g) in which the metal precursors, as La(NO3)3·6H2O and Ce(NO3)3·6H2O (La/Ce wt ratio = 3, 0.35 g) were dissolved.14,15 The required amount of precursor IrCl3 was also dissolved in co-spun samples. The electrospun material was dried and then calcined at 625 °C to form metal oxide nanofiber fabrics.
1 wt ratio, 9.5 g) in which the metal precursors, as La(NO3)3·6H2O and Ce(NO3)3·6H2O (La/Ce wt ratio = 3, 0.35 g) were dissolved.14,15 The required amount of precursor IrCl3 was also dissolved in co-spun samples. The electrospun material was dried and then calcined at 625 °C to form metal oxide nanofiber fabrics.
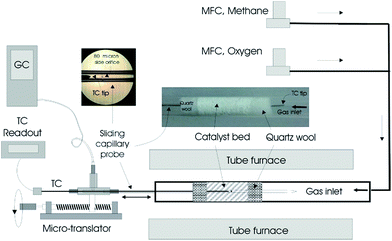 | ||
| Fig. 1 Packed bed reactor system and accompanying equipment used for acquiring spatial concentration and temperature profiles within the fabric catalysts.25 | ||
Spatial profile acquisition
The fabric catalyst (20 mg) was loosely packed into a 6 mm diameter quartz tube and sandwiched between two quartz wool plugs (20 mg each, Fig. 1).25 The bulk density and void fraction of the catalytic bed were approximately 0.3 g cm−3 and 0.94, respectively. The reactor was placed inside a cylindrical tubular furnace, which preheated the feed gas and catalyst. Electronic mass flow controllers (MFCs; MKS Billerica, MA) were used to set the total reactant flow at 120 sccm, corresponding to a nominal space time of about 60 ms. The experiments were performed at atmospheric pressure with a furnace temperature of 750 °C and CH4/O2 ratio of 5.Sampling was accomplished by withdrawing gases from within the bed using a closed-end quartz capillary tube (800 μm; Friedrick and Dimock, Millville, NJ) with a 80 μm diameter sampling orifice laser drilled on its side (see inset Fig. 1).25–27 Gas analysis was accomplished by on-line gas chromatography (Varian 4900 Mini GC, with 5 Å molecular sieve and Poraplot U columns). N2 (1.0 mol%) was used as an internal standard. The location of the sampling orifice and overall probe length were designed such that the capillary tip always remained outside the bed at any sampling position to avoid gas bypass. Samples were withdrawn through the capillary probe at a rate of about 5 sccm; thus, the flow within the reactor was minimally perturbed. Temperature measurements were performed by placing a 250 μm diameter K-type thermocouple inside the capillary probe in the absence of gas withdrawal. The tip of the thermocouple was positioned at the sampling orifice. The temperature and concentration profiles were obtained by moving the capillary (with and without the thermocouple, respectively) in the axial direction using a micropositioning device (Velmex, Bloomfield, NY). Positional accuracy associated with the placement of the capillary probe within the reactor was estimated to be ±0.25 mm. Similar uncertainty would be expected to exist between the temperature and concentration profiles as well.
Catalyst characterization
Catalyst characterizations were performed as the following: BET surface areas were determined using Micromeritics ASAP 2020 at 77 K on all fabrics tested in this work. Powder X-ray diffraction (XRD) patterns were obtained on an X-ray powder diffractometer (PANalytical X'Pert PRO) using Cu-Kα radiation, 45 kV and 40 mA, fitted with Ni filter and Soller slit collimator to identify crystalline phases. A scanning electron microscope and an energy dispersive X-ray spectrometer (FE-SEM/EDS, FE-SEM: JOEL JSM-7600F) were used to image the catalysts' morphology. X-ray photoelectron spectroscopic studies (XPS) were carried out using Al Kα monochromatic radiation, hν = 1486.74 eV with SPECS spectrometer for the X-ray source to determine the surface composition and identify electronic state of the mixing elements.Results and discussion
Characterization studies
In Fig. 2, a SEM image of the 1 wt% Ir doped La2O3–CeO2 fabric is shown, which was virtually identical to the undoped fabric. As evident from this image, the fibers are long, straight and uniform, possessing diameters of about 100 nm. The BET surface area was about 10 m2 g−1, a value that is close to what would be expected for the specific surface area of 100 nm diameter, straight, non-porous cylinders. This suggests that the fibers do not have internal porosity regardless of the level of Ir doping.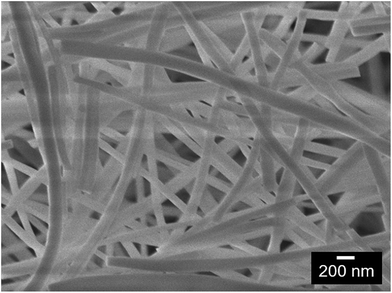 | ||
Fig. 2 SEM image of La2O3–CeO2 nanofibers doped with 1 wt% Ir on a metals basis (secondary electron imaging, 7.6 mm working distance, ×30![[thin space (1/6-em)]](https://www.rsc.org/images/entities/char_2009.gif) 000 magnification, 5.0 kV). 000 magnification, 5.0 kV). | ||
In Fig. 3 the XRD spectra of the undoped,15 0.05 wt% and 1 wt% Ir-doped La2O3–CeO2 fabrics are presented. The XRD of the undoped fabric exhibits much sharper peaks compared to the doped fabrics but has an overall shape that is similar to that with 0.05 wt% Ir. All three samples, including the 1 wt% Ir, appear to have similar cubic crystal structures. Increasing the level of Ir doping suppresses the XRD peaks. However, the mean sizes of the crystals formed remained at approximately 5 nm, based on Scherrer analysis, regardless of the Ir doping level.
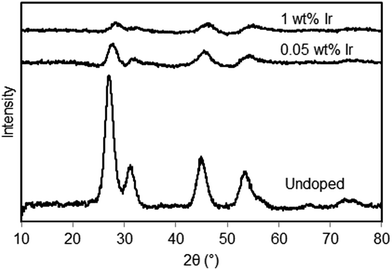 | ||
| Fig. 3 X-ray diffractograms of La2O3–CeO2 nanofibers, undoped and with metal doping of 0.05 wt% and 1 wt% Ir. Based on Scherrer analysis, the crystal sizes were about 5 nm for all samples. | ||
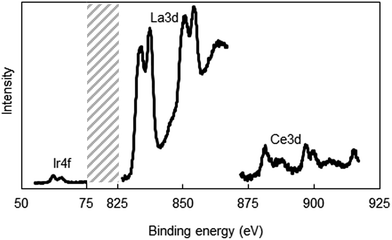
It is possible that metal ions can segregate during the solvent evaporation in the electrospinning process and the subsequent calcination steps, and can lead to the establishment of radially non-uniform metal composition, especially Ir, across the fiber. To address this potential problem, we performed XPS studies to determine the surface composition of a 5 wt% (4 atom%) Ir-doped La2O3–CeO2 fiber that has been calcined. We used a higher Ir loading in this test to improve the accuracy of the XPS measurements. The relevant XPS spectra are shown in Fig. 4. The surface atomic metal compositions were estimated by integrating the areas under the La 3d, Ce 3d and Ir 4f curves and computing the fraction that each constitutes relative to the total area, yielding 75% La, 18% Ce and 3% Ir. This measured 3% surface Ir composition is consistent with the calculated bulk atomic composition of 4% Ir for the fiber. Therefore, surface enrichment or depletion of Ir relative to the fiber bulk can substantially be ruled out. Evidently, the rapid precipitation of the solid fiber within the liquid jet formed in electrospinning was fast enough to prevent substantial migration of the metal salts across the fiber diameter.
Reaction studies
Before the results are presented, an important issue related to the catalyst selection must be noted. Although a large number of Ir doped catalysts were prepared and tested, only the results with undoped, 0.05% Ir and 1% Ir doped La2O3–CeO2 will be presented for the following reasons. At 0.05% Ir loading the reaction process exhibits both the features of OCM and CPO. At lower Ir loadings OCM dominates the reaction process. At 1% Ir, the reaction process becomes virtually CPO, with only trace OCM products. CPO remains the only reaction process at Ir loadings higher than 1%.Shown in Fig. 5 are the axial temperature and concentration profiles for the reactor packed with the undoped La2O3–CeO2 fabric catalyst. These profiles exhibit behaviors similar to those reported in our earlier OCM studies14,16,25 with the important conclusion that C2 hydrocarbons are the principal products. As evident from Fig. 5, the peak temperature of 970 °C occurs 4 mm within the catalytic zone. It is worth noting that C2H6 and C2H4 both peak at about same depth within the catalyst (3 mm) at values of 3.4 and 1.9% respectively. At higher CH4/O2 ratios, e.g. 7 or higher, substantial lag time is observed for the formation of C2H4 relative C2H6.25
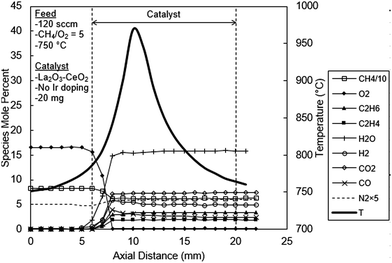 | ||
| Fig. 5 Spatial temperature and species mole percent profiles for the undoped La2O3–CeO2 fabric catalyst. | ||
The level of H2 peaks at 5.8%, 2 mm deep within the catalyst bed and levels off to about 5%, after 5 mm. The CO2 concentration increases and levels off at about 7.4%, 3 mm deep. The profile of CO also peaks at 4.0% at 3 mm within the catalyst and levels off at 2.4%, 11 mm into the catalyst. The water concentration, as calculated by O balances, increases uniformly reaching 15.6% at 2 mm, concomitant with the complete consumption of O2. Here, methane consumption also ceases, leveling at 62.1%.
It is widely accepted that OCM is induced by a surface oxygen atom (eqn (2)), activating CH4, generating a CH3 radical and [OH].8–13 Ethane is then created in the gas phase by combination of two CH3 radicals (eqn (3)). The catalyst is regenerated through the formation and desorption of H2O (eqn (4)) and subsequently by the dissociative chemisorption of O2 (eqn (1)). The generation of C2H4, however, may be initiated on the catalyst surface or in the gas phase, but either way is strongly influenced by the presence of O2. In the catalytic route, [O] may abstract hydrogen from C2H6 in a manner similar to CH4 activation. Ethane may then interact with other species to form C2H4. This is summarized in eqn (12)–(15) below:10,11
| C2H6 + [O] → C2H5˙ + [OH] | (12) |
| C2H5˙ + HO2˙ → CH3˙ + CH2O + OH˙ | (13) |
| C2H5˙ + M → C2H4 + H˙ + M | (14) |
| C2H5˙ + O2 → C2H4 + HO2˙ | (15) |
C2H6 dehydrogenation is also feasible in the gas phase by eqn (16):10
| C2H6 + OH˙ → C2H5˙ + H2O | (16) |
Clearly, the rates of above reactions are impacted by the concentration of O2 in the feed gas, consistent with the lag of C2H4 relative to C2H6 diminishing at lower CH4/O2 ratios.
In Fig. 6, the temperature and concentration profiles are presented for the La2O3–CeO2 catalyst doped with 0.05 wt% Ir, the addition of which most dramatically impacts the concentration profile for water. Instead behaving as an ultimate reaction product as is the case for OCM (Fig. 5), H2O, here in Fig. 6, exhibits a distinct peak of 12.7% at 3 mm in the catalyst bed and then decreases sharply, ultimately leveling off at 7%. This behavior supports the methane steam reforming reaction, an expected result for Ir based catalysts as reported in the literature.3
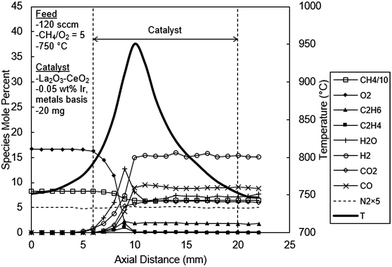 | ||
| Fig. 6 Spatial temperature and species mole percent profiles for the La2O3–CeO2 fabric catalyst doped with 0.05 wt% Ir. | ||
At 0.05 wt% Ir loading, some OCM products are also observed, albeit at lower levels than the undoped case. The reactor effluent concentrations of C2H6 and C2H4 were 1.80% and 0.02% respectively in Fig. 6, compared to the 3.4 and 1.9% values observed in the undoped catalyst experiments (Fig. 5). This reduction in C2 products could also be due to their steam reforming reactions. Carbon monoxide and H2 levels were 10% and 15%, respectively, both of which are substantially higher than the undoped experiments that were 2.4% and 5%, respectively (Fig. 5); this again is an expected result for the reforming process. Carbon dioxide increases and levels off at 6.2%, slightly lower than the 7.4% with the undoped experiments. Unlike the water profile, the carbon dioxide profile does not exhibit any discernable peak in the present experiments. This could be due to continued CH4 combustion (eqn (9)) and water gas shift reaction (eqn (17)):
| CO + H2O ↔ CO2 + H2 | (17) |
A comparison of temperature profiles between the undoped and 0.05 wt% Ir doped catalyst experiments reveals several interesting features. First, the peak temperature reached only 950 °C in the 0.05 wt% Ir catalyst bed (Fig. 6), which is about 20 °C cooler than the undoped catalyst (Fig. 5). However, a close inspection of the temperature profiles at reactor entry reveals a slightly higher temperature in the 0.05 wt% Ir catalyst bed compared to the undoped catalyst bed. On the other hand, the reactor exit temperatures of the 0.05 wt% Ir doped catalyst bed is lower than the undoped catalyst bed. These measurements are consistent with the combustion of methane first followed by endothermic reforming reactions within the 0.05 wt% Ir doped bed. This phenomenon will be expanded upon later.
Pt-based catalytic materials have been shown to also produce C2 hydrocarbons in methane CPO; however, their creation appears to occur solely in the gas phase, facilitated by highly exothermic heterogeneous steps.27 In other words, the surface and gas phase mechanisms are coupled only by heat transfer, in contrast to OCM in which CH3 radicals diffuse off of the catalyst. Here, the La2O3–CeO2 fabric doped with 0.05 wt% Ir plausibly employs different mechanistic steps, in which gaseous CH3 radicals serve as precursors to syngas generation. For example, the possible fragmentation of CH3 radicals and all other OCM intermediates and products should not be ruled out and would suggest the mechanism for CPO over Ir-based catalysts is not exclusively explained by the proposed two-step combustion-steam reforming path. Follow-up investigations are clearly called for in which novel DCKMs for methane CPO are formulated against the spatial profiles presented in this work.
Fig. 7 shows the temperature and concentration profiles for the catalyst doped with 1 wt% Ir. As can be seen from this figure, the product composition is exclusively that of CPO with no OCM products. Exit H2 and CO levels are 42% and 20%, respectively, which are in harmony with the reaction stoichiometry of methane CPO (i.e. eqn (9)–(11)). Both H2 and CO are produced early in the catalytic reaction zone, although there was some delay in CO production. However, earlier H2 detection can be attributed to diffusion due to its very steep gradient and high diffusivity. In fact the measurement of significant levels of H2 upstream outside of the catalytic zone is a clear manifestation of such diffusion effects.
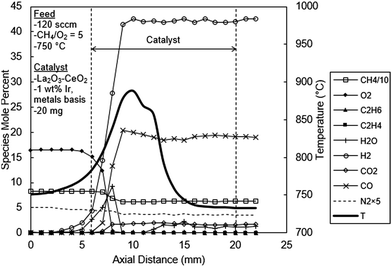 | ||
| Fig. 7 Spatial temperature and species mole percent profiles for the La2O3–CeO2 fabric catalyst doped with 1.00 wt% Ir. | ||
The concentration profiles for H2O and CO2 exhibit several new and significant mechanistic insights. First, as seen in Fig. 7, the H2O profile initially rises to a peak of about 9% at 2 mm and then sharply decreases to levels of about 0.2%, 3 mm in the catalyst bed, which is consistent with the two-step combustion-steam reforming reaction mechanism discussed before.3,21–24 On the other hand the CO2 concentration profile does not exhibit such a peak (Fig. 7). Instead, the CO2 concentration profile exhibits an initial low level reaching a plateau of about 1.7% at 2 mm in the catalyst bed, coincident with the H2O peak. The absence of a peak in the CO2 profile creates questions regarding the validity of the two-step mechanism for methane CPO over Ir-based catalysts as reported earlier.23,24 The results in Fig. 7 clearly suggest a hybrid mechanism, i.e. a composite of the two previous reaction mechanisms suggested for methane CPO.3,5,6,21–24 That is, the CPO of methane over Ir appears to involve first its catalytic fragmentation, concomitant with the formation of abundant levels of H2O (combustion) and CO, together with H2. This step is then followed by the steam reforming of methane reaction producing the balance of the CO and H2. The low levels of CO2 subsequently produced in the reactor can be explained by the water gas shift reaction (eqn (17)). Also, the reappearance of H2O from between the 11–15 mm positions may be due to temperature drop pushing steam reforming in the reverse direction. Although the needed consumption of H2 appears to be absent in Fig. 7, it could easily be masked by the high diffusivity of H2 effectively flattening the concentration profile. Methane also experiences a slight net rise in concentration in this same region. Similar artifacts are also present in Fig. 6.
As evident from Fig. 7, the temperature profile has several important features. First, the temperature profile exhibits two sequential but overlapping peaks. The second peak clearly indicates the presence of a sequential exothermic process, one likely prospect being the water gas shift reaction (eqn (17)). However, without detailed chemical kinetic and reactor modeling studies, definitive conclusions cannot be made regarding the specific reaction processes responsible for this behavior.
Second, the temperature profile in Fig. 7 along the entire catalyst bed is lower than the other catalyst beds discussed above (Fig. 5 and 6). The peak temperature of the 1 wt% Ir catalyst bed is 890 °C, which is significantly lower than the undoped (970 °C, Fig. 5) and the 0.05% Ir doped (950 °C, Fig. 6) catalysts. Evidently the 1% Ir system is an excellent reforming catalyst; that is, as soon as H2O is produced it undergo endothermic reforming reactions thereby limiting the temperature rise in the catalyst bed. It is also interesting to note that the gases leave the reactor at 733 °C (Fig. 7), substantially lower than the furnace temperature of 750 °C, as a consequence of the endothermic reforming reactions.
In Table 1, key summary features of Fig. 5–7 are provided, namely the peak temperatures and peak and exit product concentrations, and their locations within the catalyst bed.
| Fig. 5 – undoped catalyst | Fig. 6 – 0.05 wt% Ir | Fig. 7 – 1 wt% Ir | ||
| Peak value, (location, mm) | Temperature, °C | 970 (4) | 950 (4) | 890 (5) |
| C2H6, mol% | 3.4 (3) | 2.3 (3) | 0 | |
| C2H4 | 1.9 (3) | 1.1 (3) | 0 | |
| H2O | 15.8 (3) | 12.7 (3) | 9.2 (3) | |
| H2 | 5.8 (2) | 15.4 (6) | 42 (4) | |
| CO2 | 7.3 (2) | 6.2 (8) | 1.7 (3) | |
| CO | 4.0 (2) | 9.5 (5) | 20.4 (4) | |
| Exit | C2H6 | 3.4 | 1.8 | 0 |
| C2H4 | 1.9 | 0.02 | 0 | |
| H2O | 15.8 | 7.2 | 1.2 | |
| H2 | 5.0 | 15.4 | 42 | |
| CO2 | 7.3 | 6.2 | 1.7 | |
| CO | 2.4 | 9.5 | 19.2 |
Conclusions
Detailed species concentration and temperature profiles obtained over La2O3–CeO2 nanofiber fabric catalysts at varying levels of Ir doping, in a fixed bed reactor fed by CH4 and O2 (CH4/O2 = 5) indicated a clear transition from the oxidative coupling of methane (OCM) to the catalytic partial oxidation (CPO) of methane reaction scheme. With the undoped fabric catalyst, OCM was dominant process with ethane and ethylene as major products. The catalyst doped with 1 wt% Ir produced exclusively synthesis gas (CO and H2). At 0.05 wt% Ir doping, both OCM and CPO processes were operational. Species concentration profiles obtained in the 1 wt% Ir case indicate the formation of H2O, H2 and CO first, followed by the steam reforming of CH4 to produce the balance of the syngas concomitant with the sharp decrease in H2O levels. These findings suggest a CPO mechanism that is different than the literature, calling for the revisions of detailed chemical kinetic mechanisms proposed before.Acknowledgements
We thank I. Onal and Y. Kaya of Middle East Technical University (METU) and H. Yu of UCLA for their assistance in the XPS characterization work. We credit H. Zhou, F. Liu and L. Shen of UCLA for their assistance with the BET characterization. We also thank Laboratory Catalyst Systems, LLC for use of its facilities and database. B. Zohour acknowledges the National Science Foundation (NSF) GRFP Support Grant No. DGE-1144087 and the University of California, Los Angeles (UCLA) Graduate Division Fellowship. D. Noon acknowledges the NSF IGERT: Materials Creation Training Program (MCTP-DGE-0654431) and the California Nano-Systems Institute.References
- M. C. Alvarez-Galvan, N. Mota, M. Ojeda, S. Rojas, R. M. Navarro and J. L. G. Fierro, Catal. Today, 2011, 171, 15–23 CrossRef CAS.
- U. Zavyalova, M. Holena, R. Schlögl and M. Baerns, ChemCatChem, 2011, 3, 1935–1947 CrossRef CAS.
- B. C. Enger, R. Lødeng and A. Holmen, Appl. Catal., A, 2008, 346, 1–27 CrossRef CAS.
- D. A. Wood, C. Nwaoha and B. F. Towler, J. Nat. Gas Sci. Eng., 2012, 9, 196–208 CrossRef CAS.
- D. A. Hickman and L. D. Schmidt, Science, 1993, 259, 343–346 CAS.
- O. Korup, C. F. Goldsmith, G. Weinberg, M. Geske, T. Kandemir, R. Schlögl and R. Horn, J. Catal., 2013, 297, 1–16 CrossRef CAS.
- K. A. Williams, R. Horn and L. D. Schmidt, AIChE J., 2007, 53, 2097–2113 CrossRef CAS.
- L. Mleczko and M. Baerns, Fuel Process. Technol., 1995, 42, 217–248 CrossRef CAS.
- R. Quiceno, J. Pérez-Ramírez, J. Warnatz and O. Deutschmann, Appl. Catal., A, 2006, 303, 166–176 CrossRef CAS.
- J. W. Thybaut, J. Sun, L. Olivier, A. C. Van Veen, C. Mirodatos and G. B. Marin, Catal. Today, 2011, 159, 29–36 CrossRef CAS.
- J. Sun, J. W. Thybaut and G. B. Marin, Catal. Today, 2008, 137, 90–102 CrossRef CAS.
- M. Y. Sinev, Z. T. Fattakhova, V. I. Lomonosov and Y. A. Gordienko, J. Nat. Gas Chem., 2009, 18, 273–287 CrossRef CAS.
- Z. Stansch, L. Mleczko and M. Baerns, Ind. Eng. Chem. Res., 1997, 36, 2568–2579 CrossRef CAS.
- D. Noon, B. Zohour and S. Senkan, J. Nat. Gas Sci. Eng., 2014, 18, 406–411 CrossRef CAS.
- D. Noon, A. Seubsai and S. Senkan, ChemCatChem, 2013, 5, 146–149 CrossRef CAS.
- B. Zohour, D. Noon and S. Senkan, ChemCatChem, 2014, 6, 2815–2820 CrossRef CAS.
- A. B. Mhadeshwar and D. G. Vlachos, Ind. Eng. Chem. Res., 2007, 46, 5310–5324 CrossRef CAS.
- D. Dalle Nogare, N. J. Degenstein, R. Horn, P. Canu and L. D. Schmidt, J. Catal., 2011, 277, 134–148 CrossRef CAS.
- R. Horn, K. A. Williams, N. J. Degenstein, A. Bitsch-Larsen, D. Dalle Nogare, S. A. Tupy and L. D. Schmidt, J. Catal., 2007, 249, 380–393 CrossRef CAS.
- R. Horn, K. A. Williams, N. J. Degenstein and L. D. Schmidt, Chem. Eng. Sci., 2007, 62, 1298–1307 CrossRef CAS.
- M. Prettre, C. Eichner and M. Perrin, Trans. Faraday Soc., 1946, 42, 335b RSC.
- J. R. Rostrup-nielsen and J. H. B. Hansen, J. Catal., 1993, 144, 38–49 CrossRef CAS.
- G. Postole, K. Girona, J. Toyir, A. Kaddouri and P. Gélin, Fuel Cells, 2012, 12, 275–287 CrossRef CAS.
- K. Nakagawa, K. Anzai, N. Matsui, N. Ikenaga, T. Suzuki, Y. Teng, T. Kobayashi and M. Haruta, Catal. Lett., 1998, 51, 163–167 CrossRef CAS.
- B. Zohour, D. Noon and S. Senkan, ChemCatChem, 2013, 5, 2809–2812 CrossRef CAS.
- R. Horn, O. Korup, M. Geske, U. Zavyalova, I. Oprea and R. Schlögl, Rev. Sci. Instrum., 2010, 81, 064102 CrossRef CAS PubMed.
- M. Geske, K. Pelzer, R. Horn, F. C. Jentoft and R. Schlögl, Catal. Today, 2009, 142, 61–69 CrossRef CAS.
| This journal is © The Royal Society of Chemistry 2017 |

