 Open Access Article
Creative Commons Attribution 3.0 Unported Licence
Movement patterns of ellipsoidal particles with different axial ratios in three-body abrasion of monocrystalline copper: a large scale molecular dynamics study
Liang Fang *a,
Kun Suna,
Junqin Shia,
Xiangzheng Zhua,
Yanan Zhanga,
Juan Chena,
Jiapeng Sunb and
Jing Hanc
aState Key Laboratory for Mechanical Behavior of Materials, Xi’an Jiaotong University, 28 West Xianning Road, Xi’an 710049, P. R. China. E-mail: fangl@xjtu.edu.cn; sunkun@xjtu.edu.cn
bCollege of Mechanics and Materials, Hohai University, Nanjing 210098, P. R. China
cSchool of Mechanical and Electrical Engineering, China University of Mining and Technology, Xuzhou 221116, Jiangsu Province, P. R. China
First published on 19th May 2017
Abstract
In three-body abrasion, the abrasive particle shape has a major impact on the movement patterns. These consist of sliding or rolling relative to the abraded surfaces. It has been recognized that the movement patterns of the particles dominate the wear mechanism of the materials in three-body abrasion. In this paper, the movement patterns of monocrystalline diamond ellipsoidal particles, which are sandwiched between monocrystalline copper workpieces, were investigated by large-scale molecular dynamics (MD). During the simulations, the axial ratio of the ellipsoidal particle varied from 0.90 (an approximate sphere) to 0.50 (a flattened ellipsoid). It has been found that there is a transition of the movement patterns between rolling and sliding. The particle slides when the axial ratio is smaller than 0.83, and it rolls when the axial ratio is larger than 0.83. Normal load and friction force curves were also obtained relative to the wear time. It has been shown that the average friction coefficient of rolling particles is lower than that of sliding particles. If the ratio of two-moment arms, such as the driving and resistant force moment arms of the particle, is defined as e/h, the curves for the friction coefficient and value e/h can determine the movement patterns of particles at the nanoscale, the same as at the macroscale. When the friction coefficient is higher than e/h, rolling of the particle occurs, whereas the particle slides if the friction coefficient is smaller than e/h. By comparing with macroscale three-body abrasion, a particle at the nanoscale has a strong tendency to roll because of its significant elastic recovery. When the particle rolls, the defect depth, groove depth and dislocation length are all increased relative to particle sliding, resulting in more severe subsurface defects of the monocrystalline copper.
1. Introduction
Micro-electro-mechanical systems (MEMSs) have been widely used in miniaturized structures, sensors, actuators, and microelectronics. The most notable elements are microsensors and microactuators. The functional performance of the products suffered from a material removal process and is seriously limited by the reduced integrity and reliability of the surface and subsurface layer.1–3 Thus, reducing the friction and wear between the contacting surfaces of components is of substantial importance for the application of MEMS devices. During the wear process, MEMS devices exhibit a transition from the initial adhesive wear, with the feature of blunt asperities, to the final abrasive wear with severe three-body abrasions.4–6 For the wear of a MEMS component, it has been estimated that the range of wear rates is significantly smaller than the values typically found in macro-scale mechanical systems if a desirable life of one to ten years is required for a micro-rotor.7Chemical mechanical polishing (CMP) has been a critical process for achieving surface planarization in electronics and is commonly used as an intermediate fabrication step for devices such as integrated circuits (IC),8 light-emitting diodes (LED)9,10 and magnetic hard disk read/write heads.11 In the CMP process, the slurry usually consists of abrasive particles of the solid state suspended in a liquid state-chemical solution. The abrasion in the slurry transfers mechanical energy to the surface being polished. It plays a key role in material removal although chemical action between the solution and polished surface also helps to promote the process. Understanding the mechanical wear process is critical for estimating the material removal rate (MRR) in the CMP process. The topic of mechanical interaction between the wafer, pad and slurry besides chemical action has been investigated before 1997.12–18
Su19 reported a floating polishing process in CMP. It was found that the removal of a workpiece can occur due to transmission by a moving slurry. An abrasive particle near the workpiece surface sustained shear and normal stress due to a velocity gradient of slurry flow. The shear and normal stress caused sliding and rolling of the particle. The sliding action on the particle surface produced a driving force leading to material removal. The rolling action decreased the power transmission efficiency, hampering the machining action. It was concluded that a slender particle shape improves the material removal. It becomes clear that the movement patterns of the slurry particles play an important role in the material removal of the CMP process.
Luo and Dornfeld20–22 have also proposed other mechanical wear models for the CMP process, considering the real contact area between the pad and wafer interface and the active particles. They claimed that the prediction of MRR by three-body abrasion is difficult in the hydrodynamic contact mode. MRR in three-body abrasion, compared with two-body abrasion of a solid–solid contact mode, can be negligible. The active abrasives were assumed to be fixed particles that are deeply embedded in the soft pad surface after a small stable gap formed from the planarization process. Therefore, a pure cutting wear in two-body abrasion was taken as a main wear mode of material removal. Srivastava and Higgs23 extended the models of Luo and Dornfeld by introducing particle-augmented mixed lubrication modeling for a global estimation of MRR.
The above mentioned wear models in ref. 20–23 all proposed a pure cutting removal mechanism. Evaluation of the movement patterns of abrasive particles, i.e. sliding and rolling related to the wafer and pad, is avoided because of their complexity during the CMP process. In reality, the active particles are not completely fixed in the pad asperities and can also cause the removal of consumable pad material beside the wafer. Although the work reported by Su19 noted that the rolling of particles can decrease the machining efficiency, detailed analysis related to the features of particle movement has not been done.
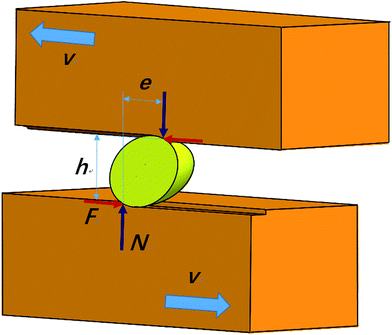
Our three-body wear tester24,25 can observe the movement of abrasive particles during wear testing for a single particle in situ. A geometric parameter e/h was introduced which is relative to the hardness of the abraded materials, normal load, friction load and particle shape embedded in the subsurface. In the expression, e is an equivalent arm for the resistant moment, and h is the driving moment as shown in Fig. 1. From the geometric parameters, a criterion for particle movement pattern can be proposed. When a particle slides,
| e/h ≥ μs | (1) |
| e/h < μr | (2) |
In CMP and the wear of MEMSs, the particles embedded in the systems are not always spherical. If the particles are ellipsoidal, their ellipticity (the ratio of the short to long half axis for an ellipsoid) can affect the particle movement pattern. The objective of this paper is to discuss the effect of the axial ratio of ellipsoid particles on their movement pattern at the nanoscale, which will cause a different wear mechanism of the abraded subsurface. The particle movement in nanoscale three-body abrasion is difficult to experimentally control because of various undefined parameters, such as the particle geometric shape, size and size distribution. For single-particle three-body wear tests, the layout of the tester is also very challenging for tribologists. Therefore, a large scale molecular dynamics simulation is applied in this paper by the present authors. To investigate the movement pattern of an ellipsoidal particle sandwiched between monocrystalline copper workpieces, we tested the axial ratios of ellipsoidal particles ranging from 1.00 (complete sphere) to 0.50 (flattened ellipsoid). Our results can be used to evaluate the effect of the geometric shapes of particles on the wear of MEMSs or the MRR of the CMP process.
2. MD simulation model
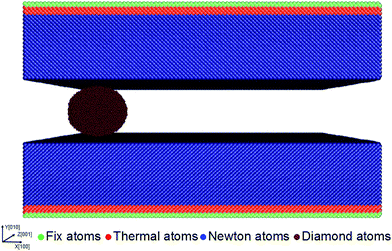
The MD simulations in our research were implemented using a large scale atomic/molecular massively parallel simulator (LAMMPS). A model of the MD simulation is shown in Fig. 2. In this study, monocrystalline copper is much softer than diamond. A diamond particle can effectively cut off the copper atoms without self deformation or deterioration. Although it becomes possible for the hardest diamond to be polished by means of the amorphization process during wear28 and its surface is rough sometimes, it is also reasonable to assume a smooth rigid surface for the diamond particle as the first step of investigations. It should also be necessary to construct a rough amorphous surface without a rigid assumption at the next research stage. In this study, a rigid diamond ellipsoidal particle sandwiched between two defect-free monocrystalline copper workpieces was modeled. The crystal orientations of the workpieces set along the X, Y and Z axes were [1 0 0], [0 1 0] and [0 0 1]. The ellipsoidal particle was composed of 10![[thin space (1/6-em)]](https://www.rsc.org/images/entities/char_2009.gif) 021 atoms for the axial ratio of 0.50 to 18
021 atoms for the axial ratio of 0.50 to 18![[thin space (1/6-em)]](https://www.rsc.org/images/entities/char_2009.gif) 038 atoms for the axial ratio of 0.90, as shown in Table 1. It is indicated from Table 1 that the length of the semi-axis a[100] and c[001] was kept constant i.e., 30 angstroms (Å), along the X and Z axes. The length of the third axis, i.e., axis b[010], was varied by changing the axial ratio. The copper workpiece for the upper part above the ellipsoidal particle was assumed to be in a perfect face centered cubic (FCC) configuration containing 287
038 atoms for the axial ratio of 0.90, as shown in Table 1. It is indicated from Table 1 that the length of the semi-axis a[100] and c[001] was kept constant i.e., 30 angstroms (Å), along the X and Z axes. The length of the third axis, i.e., axis b[010], was varied by changing the axial ratio. The copper workpiece for the upper part above the ellipsoidal particle was assumed to be in a perfect face centered cubic (FCC) configuration containing 287![[thin space (1/6-em)]](https://www.rsc.org/images/entities/char_2009.gif) 820 atoms within a size of 32.6 nm × 6.9 nm × 14.9 nm, where a is the lattice constant of copper, and a = 0.35667 nm. The copper workpiece for the bottom part below the ellipsoidal particle had the same parameters as the upper workpiece. A normal load of 80 nN was vertically applied on the two workpieces’ symmetric surface along the Y axis, which is transferred to the two sides of the ellipsoidal particle. A relative sliding of the two workpieces at a velocity of 50 m s−1 along the X axis gave rise to a nano three-body wear system.
820 atoms within a size of 32.6 nm × 6.9 nm × 14.9 nm, where a is the lattice constant of copper, and a = 0.35667 nm. The copper workpiece for the bottom part below the ellipsoidal particle had the same parameters as the upper workpiece. A normal load of 80 nN was vertically applied on the two workpieces’ symmetric surface along the Y axis, which is transferred to the two sides of the ellipsoidal particle. A relative sliding of the two workpieces at a velocity of 50 m s−1 along the X axis gave rise to a nano three-body wear system.
| Semi-axis length (×10−10 m) | 30 × 15 × 30 | 30 × 21 × 30 | 30 × 25 × 30 | 30 × 27 × 30 |
| Axial ratio | 0.50 | 0.70 | 0.83 | 0.90 |
| Atom no. | 10![[thin space (1/6-em)]](https://www.rsc.org/images/entities/char_2009.gif) 021 021 |
14![[thin space (1/6-em)]](https://www.rsc.org/images/entities/char_2009.gif) 033 033 |
16![[thin space (1/6-em)]](https://www.rsc.org/images/entities/char_2009.gif) 679 679 |
18![[thin space (1/6-em)]](https://www.rsc.org/images/entities/char_2009.gif) 038 038 |
The two workpieces have three different zones: the Newtonian zone, boundary zone and thermostat zone. In the Newtonian and thermostat zones, the motion of the atoms obeyed the classical Newton’s second law and was determined by integrating the classical Hamiltonian equations of motion using the Velocity-Verlet algorithm. The time step of 1 fs was selected with consideration of the intrinsic inter-atomic vibration distance between the two neighbor atoms. The two layers of boundary atoms were placed at the lower and upper side of the workpieces, and the fixed boundary conditions were applied to them. The thermostat zone of the four atom layers was adopted to limit heat dissipation. The temperature of the thermostat zone was controlled by the Langevin thermostat method. The initial temperature of the system was set to 0 K. Periodic boundary conditions (PBCs) maintained along the X and Z directions were adopted to simulate a large system and avoid the boundary effect. MD simulations of the nano three-body wear process consisted of two stages: a relaxed state and a following wear stage. At the relaxation stage, the temperature of the system was increased to 300 K gradually, then the system was kept at 300 K for 50 ps to relax the atoms to minimize energy, using the Nosé–Hoover thermostat algorithm, except for the thermostat atoms controlled by the Langevin algorithm as described above. At a steady state, the boundary atoms were fixed and the thermostat atoms were set as the NVT ensemble. The Newtonian atoms and boundary atoms were defined as the NVE ensemble.
The wear process was divided into two stages: the two workpieces initially move against each other under the defined normal load until the particle penetrated into both workpieces. Then a constant relative sliding velocity of 50 m s−1 was kept for both workpieces along the X axis. The upper workpiece moved in the forward X axis and the bottom workpiece in the reverse X axis. During the wear process, the normal load was kept constant. Because the particle shape was ellipsoidal in this study, retaining a constant penetrated depth will not be suitable in the MD simulation process. If the ellipsoidal particle rolls, the penetrated depth into the workpieces also changes with time. Therefore, a constant supported normal load should be retained in the simulation process instead of a constant penetrated depth.
The selection of the potential energy is crucial to the accuracy and efficiency of MD simulation. The Embedded Atom Method (EAM) potential provides a more realistic description of metallic cohesion and avoids ambiguity inherited by the volume dependency. It was employed to describe the interaction between the copper atoms.29–31 The total atomic energy of an EAM potential system was expressed as:
 | (3) |
 | (4) |
For the FCC crystals, the parameters in eqn (3) and (4) can be expressed as follows:32
| Φ(rij) = A1(rc1 − rij)2e−c1rij | (5) |
| f(rij) = A2(rc2 − rij)2e−c2rij | (6) |
F(ρi) = Dρi![[thin space (1/6-em)]](https://www.rsc.org/images/entities/char_2009.gif) ln ln![[thin space (1/6-em)]](https://www.rsc.org/images/entities/char_2009.gif) ρi ρi
| (7) |
The interactions in the workpieces and ellipsoidal particle between the monocrystalline copper atoms and diamond carbon atoms were identified by the Morse potential33 which can be expressed as:
| V(r) = D(e−2α(r−r0) − 2e−α(r−r0)) | (8) |
| Properties | Parameters |
|---|---|
| a Semi-axis length for the ellipsoidal particle in the coordinate axes X, Y and Z, separately. | |
| Workpiece material | Monocrystalline copper (FCC) |
| Particle material | Diamond |
| Workpiece dimension (nm) | 32.6 × 6.9 × 14.9 (287![[thin space (1/6-em)]](https://www.rsc.org/images/entities/char_2009.gif) 820 atoms) 820 atoms) |
| Potential for workpiece | EAM potential |
| Potential between workpiece and tip | Morse potential |
| Initial temperature (K) | 300 |
| Time step (fs) | I |
| Travel distance (nm) | 40 |
| Travel velocity (m s−1) | 50 |
| Normal load (nN) | 80 |
| Particle semi-axis lengtha (×10−10 m) | 30 × 15 × 30 to 30 × 27 × 30 |
3. Results and discussion
To examine the movement patterns of the ellipsoidal particle in three-body abrasion, we took images in the different simulating steps. Fig. 3 shows the vertical cross-sectional images of atom configurations for the different axial ratios of particles with increasing simulation time. The particle turns to rolling from sliding when the axial ratio is equal to or greater than 0.83. If the curves of the rotational velocity of the particle relative to the simulated time steps are drawn as shown in Fig. 4, the average rotational velocity of the particle for an axial ratio of 0.50 (see Fig. 4(a)) and 0.70 (see Fig. 4(b)) is zero after an initial simulated stage. Before sliding, the particle will have an initial rotating angle adjustment to satisfy the balance conditions of normal and friction force. The initial rotation velocity is, therefore, unequal to zero during this stage. The particles with axial ratios of 0.83 and 0.90 were nearer to a sphere compared to the particles with axial ratios of 0.50 and 0.70. When three-body abrasion occurs, the particles with axial ratios of 0.83 and 0.90 will roll as shown in Fig. 3. Their average rotation velocities were about 0.75 × 10⁻² rad ps−1 as shown in Fig. 4(c) and (d). Because the particle was ellipsoidal in shape, its rotational velocity was not constant and changed with the rotational angle in a pseudo sinusoidal style. By comparing Fig. 4 with Fig. 3, we found that the rotational velocity was at a maximum for a seated location of the ellipsoidal particle and at a minimum for an upright location.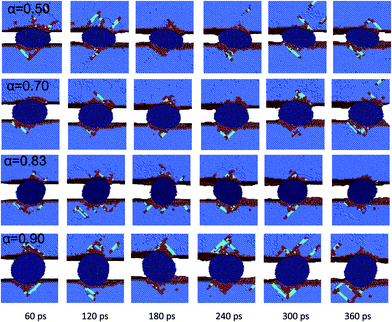 | ||
| Fig. 3 The particle movement images in different wear stages while the axis ratio α of the particles was changed from 0.50 to 0.90. | ||
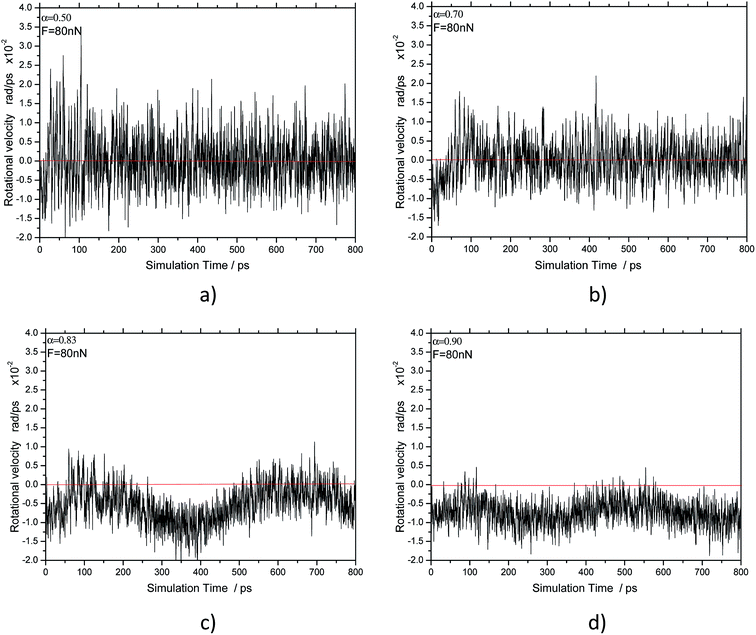 | ||
| Fig. 4 The rotational velocity curve of the ellipsoidal particle with the different axial ratios: (a) 0.50, (b) 0.70, (c) 0.83 and (d) 0.90 relative to the simulated time. | ||
In nano three-body abrasion, the friction and normal load pairs construct the driving moment and resisting moment of the particle moving separately. The particle will roll when the driving moment is greater than the resisting moment. In contrast, when the driving moment is less than the resisting moment, the particle will slide. Fig. 5 shows the normal load and friction curves related to the simulated time. The normal load fluctuated around the defined load of 80 nN after applying the angle adjustment for the sliding particles. For the rolling particles, the fluctuation range of the normal loads was slightly larger. The friction forces for the rolling particles also had a greater fluctuated range with a pseudo sinusoidal style than that of the sliding particles as seen in Fig. 5. From Coulomb’s friction law, the friction coefficient equals the friction force exerted on a surface divided by the normal force exerted. It is identified from Fig. 5 that the average friction coefficient of the sliding particles is larger than that of the rolling particles. The friction coefficient of rolling particles for a smaller axial ratio is larger than that of a larger axial ratio.
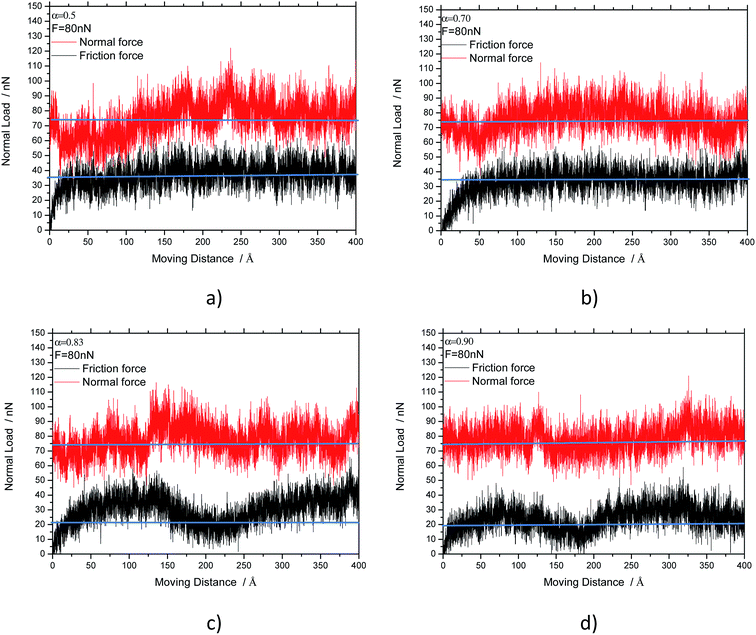 | ||
| Fig. 5 Friction and normal load curves related to the simulated time for the particle axial ratios: (a) 0.50, (b) 0.70, (c) 0.83 and (d) 0.90. | ||
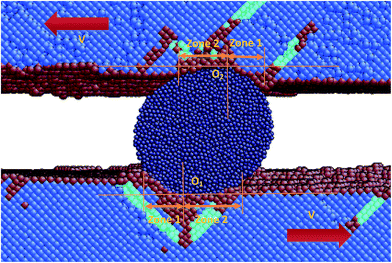
At the macroscale, the part of the particle in the back moving side is not in contact with the surface because the elastic recovery is very small as shown in Fig. 1. Only part of the moving side is in contact with the surface. However, by closely examining a particle during the wear process at the nanoscale, we can identify a distinct elastic recovery soon after the particle went through. In order to evaluate the elastic recovery, the top and bottom of the particle sandwiched between the two copper workpieces were marked with point O1 and O2, separately, as shown in Fig. 6. There are two zones where the atoms of the particle are in contact with the atoms of copper. In the moving side of the particle (zone 1), the contact of the atoms between the particle and copper workpiece was formed by the friction and normal load. In the back moving side (zone 2) the contact was formed by the elastic recovery.
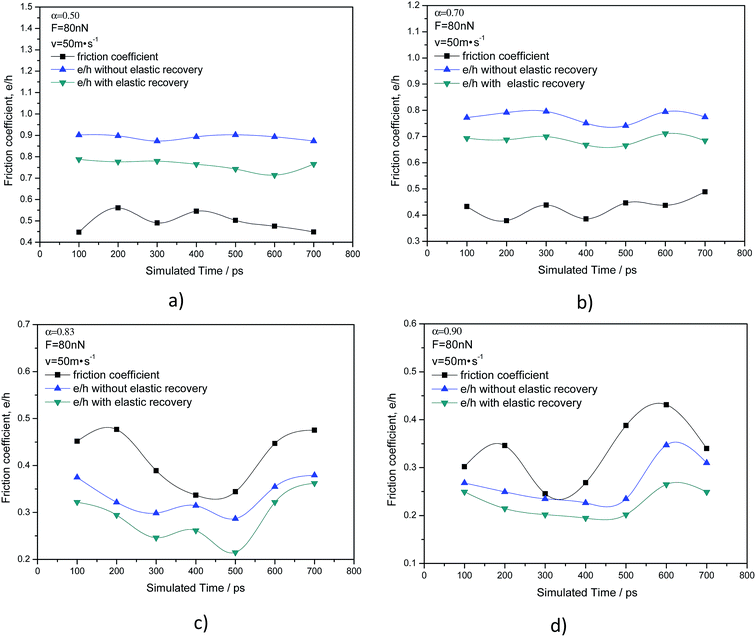
We have previously described a criterion for the particle movement pattern in which the geometric parameter e/h introduced is used to judge the rolling or sliding of particles in three-body abrasion. When the friction coefficient is smaller than or equal to e/h, the particle slides; the particle rolls when the friction coefficient is larger than e/h. First, when calculating e/h, the normal load and friction force are both assumed to be equally distributed at the contact zone between the particle and copper surface. Second, the elastic recovery should be taken into account at the nanoscale. As a result, the action points of the concentrated force of the normal load and friction between two surfaces can be easily decided. Fig. 7 shows the curves of e/h with and without considering the elastic recovery, together with a friction coefficient relative to the simulated time. The e/h is usually significantly greater for the sliding particle than for the rolling particle. The average e/h is greater than 0.70 for the sliding particles and smaller than 0.40 for the rolling particles as shown in Fig. 7. As described above, h is the arm of the driving moment and e is the arm of the resistant moment in e/h. A small e, i.e., a small e/h in the case of elastic recovery, has a much smaller resistant moment to facilitate particle rolling. Formulae (1) and (2) can be applied to judge the movement patterns of the particles. If the axial ratio is smaller than 0.83, e/h is larger than the friction coefficient, resulting in particle sliding. In contrast, if the axial ratio is larger than 0.83 e/h is smaller than the friction coefficient, and the particle rolls.
It can also be inferred from Fig. 7 and 8 that the values of the e/h curves in green color are without elastic recovery. They were all smaller than those with elastic recovery. We calculated the average e/h and friction coefficient after the simulated time of 100 ps. It became much clearer from Fig. 8 that elastic recovery brings about the decrease of the e/h, which causes the decrease of the critical axial ratio transforming the movement patterns of the ellipsoidal particles. As a result, elastic recovery at the nanoscale expands the rolling zone of the particles, compared to a case without considering elastic recovery. Thus, the elastic recovery plays an important role in nanoscale three-body abrasion. The nanoparticles in wear have a more dramatic trend to roll compared with the macroscale-sized particles.
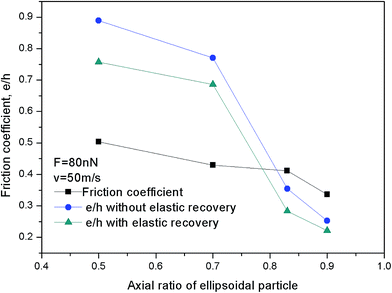 | ||
| Fig. 8 Average friction coefficient and e/h as a function of the axial ratio of the ellipsoidal particle after the simulated step time of 100 ps. | ||
Fig. 9 shows snapshots of copper atom displacements before the simulation time 8 × 10⁵ ps from the front and top position, respectively. The height of the ridges as shown in orange and red color for the sliding particles is higher than that for the rolling particles. The displacement of atoms below the bottom of the scratches as shown in blue color for the rolling particles is larger than that of the sliding particles. If we observed the atom snapshot images around the scratches from the vertical cross-section in Fig. 10, the characteristics mentioned above became more apparent.
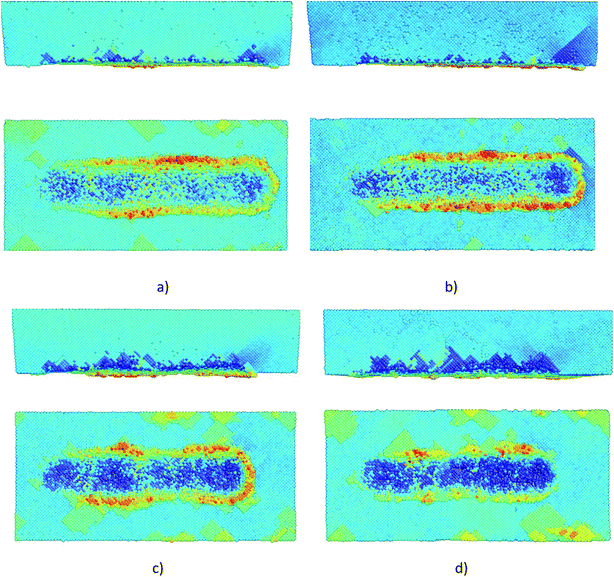 | ||
| Fig. 9 Snapshots of MD simulations before the simulated time of 8 × 10⁵ ps for axial ratios of the ellipsoidal particle: (a) 0.50, (b) 0.70, (c) 0.83 and (d) 0.90. | ||
 | ||
| Fig. 10 Morphology of the scratches in the vertical cross section for axial ratios of the ellipsoidal particle: (a) 0.50, (b) 0.70, (c) 0.83 and (d) 0.90. | ||
Fig. 11 shows the statistical data of the grooves at the simulated time of 8 × 10⁵ ps for the different axial ratios of the ellipsoidal particles. The maximum depth of the scratching, defects and maximum ridge height were calculated directly from the snapshot images. With the increase of the axial ratio of the ellipsoidal particle, the maximum depth of the defects and scratching grooves both increased, whereas in contrast the maximum height of the scratching ridges decreased. The scratching and defect depth were shallower for the sliding particles than those of the rolling particles. The ridge height was larger. The results agree with the observations in Fig. 9 and 10.
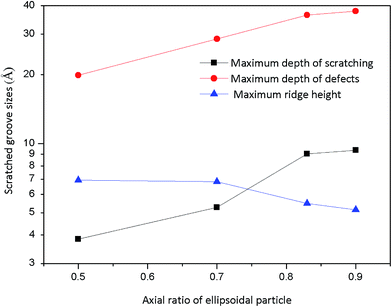 | ||
| Fig. 11 Statistical data of the grooves at the simulated time of 8 × 10⁵ ps from axial ratio 0.50 to 0.90. | ||
Fig. 12 illustrates the dislocation configurations after the wear simulation process for the different axial ratios of the ellipsoidal particles. The surface atoms are drawn in red color, and the inner atoms with complete coordination of the FCC cells and atoms within the periodic boundaries are all concealed in Fig. 12. The atoms were colored according to the value of the centro symmetry parameter (CSP) with red for partial dislocations and blue for stacking faults. The stacking faults were bounded by partial dislocation loops, which started at the surface and reached deeper for the different axial ratio of the ellipsoidal particles. By comparing the dislocation configurations with the increase of the axial ratio, we can conclude that there are more dislocations when the particle turns to rolling from sliding and the maximum depths of defects are also deeper for the rolling particle as shown in Fig. 12(d).
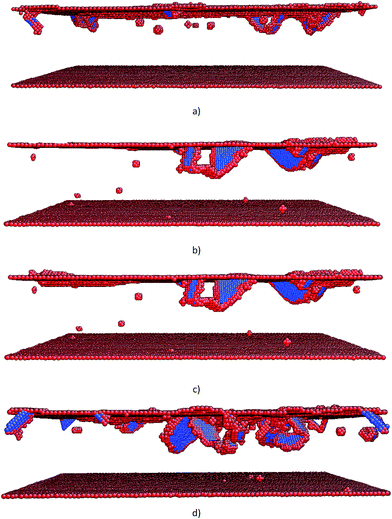 | ||
| Fig. 12 Dislocation configurations after the abrasive wear for axial ratios of the ellipsoidal particle: (a) 0.50, (b) 0.70, (c) 0.83 and (d) 0.90. | ||
After the wear simulations, the total length of dislocations for both the copper workpieces can be easily acquired by the open visualization tool Ovito.34 Fig. 13 illustrates the involved data of the total dislocation lengths by changing the axial ratio of the ellipsoidal particles for both copper workpieces. It is interesting that with the increasing axial ratio of the particles, the total dislocation length was regularly increased. It has been mentioned in the previous section that the particles with axial ratios of 0.83 and 0.90 are in a rolling pattern, compared to the particles with axial ratios of 0.50 and 0.70. That is to say, the total dislocation lengths of the rolling particles are always longer than those of the sliding particles. If a quantity percentage of stair-rod dislocations in total dislocations was estimated for the rolling and sliding particles in this simulation, it was found that stair-rod dislocations account for 22% for the rolling particles and 13% for the sliding particles. Therefore, the rolling particles more easily form pinned stair-rod dislocations, causing longer dislocations that are kept in the copper workpieces.
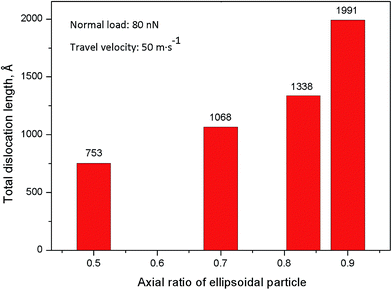 | ||
| Fig. 13 Total dislocation lengths after the simulation for both the copper workpieces in the different axial ratios of the ellipsoidal particle. | ||
Based on the simulation results above, it is suggested for the CMP process that rolling particles are not likely compared with sliding particles. Rolling particles can cause more serious damage to the copper subsurface. For example, they increase the distributed defect depth, groove depth and dislocation length. The work transferred from the rolling particles by the normal load and friction force is primarily consumed by the plastic deformation of the copper subsurface. On the other hand, it is also known by researchers that rolling particles decrease the efficiency of the mechanical flattening process relative to sliding particles although the wear of copper has not yet been calculated in this study. Su19 found in his work that the rolling of the particles can decrease the machining efficiency of CMP. The damage to the polishing subsurface is gentle for sliding particles. Many atoms are displaced onto a ridge which can be easily removed by the subsequent particles. Therefore, the particles with small axial ratios should be a preferred choice in the CMP process.
4. Conclusions
(1) In our MD simulations, there is a transition from sliding to rolling when varying the axial ratio of the nanosized ellipsoidal particles in three-body abrasion of the monocrystalline copper pairs. After the axial ratio is increased to 0.83, the particle turns to rolling from sliding.(2) The average friction coefficient of sliding particles is larger than that of rolling particles. The friction coefficient of rolling particles with a smaller axial ratio is larger than that of those with a larger axial ratio.
(3) With elastic recovery in consideration, the criterion of particle movement patterns can be used to predict rolling and sliding in nanoscale three-body abrasion of ellipsoidal particles.
(4) In nanosized three-body abrasion, elastic recovery cannot be ignored compared with macroscale wear. The elastic recovery brings about a decrease in the resistant moment to expand the range of particle rolling.
(5) When the particle rolls, the defect depth, groove depth and dislocation length are all increased relative to particle sliding.
Acknowledgements
The authors would like to thank Mr Yunpeng Wang for his high quality 3D artwork of three-body abrasion in this report. The authors are also grateful for the sustained financial support of the National Natural Science Foundation of China (Grant No. 51375364, 51475359, 51605139, 51505479).References
- M. R. Shankar, S. Chandrasekar, A. H. King and W. D. Compton, Microstructure and Stability of Nanocrystalline Aluminum 6061 Created by Large Strain Machining, Acta Mater., 2005, 53, 4781–4793 CrossRef CAS.
- F. Hashimoto, Y. B. Guo and A. W. Warren, Surface Integrity Difference between Hard Turned and Ground Surfaces and Its Impact on Fatigue Life, CIRP Annals - Manufacturing Technology, 2006, 55, 81–84 CrossRef.
- D. Ulutan and T. Ozel, Machining Induced Surface Integrity in Titanium and Nickel Alloys: A Review, Int. J. Mach. Tool. Manufact., 2011, 51, 250–280 CrossRef.
- D. H. Alsem, M. T. Dugger, E. A. Stach and R. O. Ritchie, Microscale Friction and Sliding Wear of Polycrystalline Silicon Thin Structural Films in Ambient Air, J. Microelectromech. Syst., 2008, 17, 1144–1145 CrossRef CAS.
- G. Subhash, A. D. Corwin and M. P. de Boer, Evolution of Wear Characteristics and Frictional Behavior in MEMS Devices, Tribol. Lett., 2011, 41, 177–189 CrossRef CAS.
- S. Shen, Y. Meng and W. Zhang, Characteristics of The Wear Process of Side-Wall Surfaces in Bulk-Fabricated Si-MEMS Devices in Nitrogen Gas Environment, Tribol. Lett., 2012, 47, 455–466 CrossRef CAS.
- K. H. Chung and D. E. Kim, Fundamental Investigation of Micro Wear Rate Using An Atomic Force Microscope, Tribol. Lett., 2003, 15, 135–144 CrossRef CAS.
- P. B. Zantye, A. Kumar and A. Sikder, Chemical Mechanical Planarization for Microelectronics Applications, Mater. Sci. Eng., R, 2004, 45, 89–220 CrossRef.
- Z. Zhang, W. Liu, Z. Song and X. Hu, Two-Step Chemical Mechanical Polishing of Sapphire Substrate, J. Electrochem. Soc., 2010, 157, H688–H691 CrossRef CAS.
- H. Zhu, L. A. Tessaroto, R. Sabia, V. A. Greenhut, M. Smith and D. E. Niesz, Chemical Mechanical Polishing (CMP) Anisotropy in Sapphire, Appl. Surf. Sci., 2004, 236, 120–130 CrossRef CAS.
- H. Lei and J. Luo, CMP of Hard Disk Substrate Using A Colloidal SiO2 Slurry: Preliminary Experimental Investigation, Wear, 2004, 257, 461–470 CrossRef CAS.
- F. Preston, The theory and design of plate glass polishing machines, J. Soc. Glass Technol., 1927, 11, 214–256 CAS.
- T. Yu, C. Yu and M. Orlowski, A statistical polishing pad model for chemical mechanical polishing, Proc. IEEE Int. Electron Devices Meeting, Washington, DC, 1993, pp. 865–868 Search PubMed.
- T. Yu, C. Yu and M. Orlowski, Combined asperity contact and fluid flow model for chemical mechanical polishing, in Proc. Int. Workshop on Numerical Modeling of Processes and Devices for Integrated Circuits: NUPAD V, Honolulu/New York, I/NY, 1994, pp. 29–32 Search PubMed.
- S. R. Runnels and L. M. Eyman, Physical modeling of CMP fluid flow analysis, Sematech Rep., 1993 Search PubMed.
- S. R. Runnels, Tribology analysis of chemical mechanical polishing, J. Electrochem. Soc., 1994, 141, 1698–1701 CrossRef CAS.
- D. Wang, J. Lee, K. Holland, T. Bibby, S. Beaudoin and T. Cale, Von mises stress in chemical-mechanical polishing processes, J. Electrochem. Soc., 1997, 144, 1121–1127 CrossRef CAS.
- J. Tichy, J. A. Levert, L. Shan and S. Danyluk, Contact mechanics and lubrication hydrodynamics of chemical mechanical polishing, J. Electrochem. Soc., 1999, 146, 1523–1528 CrossRef CAS.
- Y. T. Su, Investigation of Removal Rate Properties of a Floating Polishing Process, J. Electrochem. Soc., 2000, 147, 2290–2296 CrossRef CAS.
- J. F. Luo and D. A. Dornfeld, Material removal mechanism in chemical mechanical polishing: theory and modeling, IEEE Trans. Semicond. Manuf., 2001, 14, 112–133 CrossRef.
- J. F. Luo and D. A. Dornfeld, Material removal regions in chemical mechanical planarization for submicron integrated circuit fabrication: coupling effects of slurry chemicals, abrasive size distribution, and wafer-pad contact area, IEEE Trans. Semicond. Manuf., 2003, 16, 45–56 CrossRef.
- J. F. Luo and D. A. Dornfeld, Effects of abrasive size distribution in chemical mechanical planarization: modeling and verification, IEEE Trans. Semicond. Manuf., 2003, 16, 469–476 CrossRef.
- G. Srivastava and C. F. Higgs, A Full Wafer-Scale PAML Modeling Approach for Predicting CMP, Tribol. Lett., 2015, 59(32), 1–11 CAS.
- L. Fang, X. L. Kong and Q. D. Zhou, A wear tester capable of monitoring and evaluating the movement pattern of abrasive particles in three-body abrasion, Wear, 1992, 159, 115–120 CrossRef.
- L. Fang, X. L. Kong, J. Y. Su and Q. D. Zhou, Movement patterns of abrasive particles in three-body abrasion, Wear, 1993, 162–164, 782–789 CrossRef CAS.
- L. Fang, J. Zhao, B. Li and K. Sun, Movement patterns of ellipsoidal particle in abrasive flow machining, J. Mater. Process. Technol., 2009, 29, 6048–6056 CrossRef.
- J. P. Sun, L. Fang, J. Han, Y. Han, H. W. Chen and K. Sun, Abrasive wear of nanoscale single crystal silicon, Wear, 2013, 307, 119–126 CrossRef CAS.
- L. Pastewka, S. Moser, P. Gumbsch and M. Moseler, Anisotropic mechanical amorphization drives wear in diamond, Nat. Mater., 2011, 10, 34–38 CrossRef CAS PubMed.
- J. J. Zhang, T. Sun, Y. D. Yan, Y. C. Liang and S. Dong, Molecular dynamics study of groove fabrication process using AFM-based nanometric cutting technique, Appl. Phys. A, 2008, 94, 593–600 CrossRef.
- P. Z. Zhu, Y. Z. Hu, T. B. Ma and H. Wang, Study of AFM-based nanometric cutting process using molecular dynamics, Appl. Surf. Sci., 2010, 256, 7160–7165 CrossRef CAS.
- H. M. Khan and S. G. Kim, On the wear mechanism of thin nickel film during AFM-based scratching process using molecular dynamics, J. Mech. Sci. Technol., 2011, 25, 2111–2120 CrossRef.
- M. Doyama and Y. Kogure, Embedded atom potentials in FCC and BCC metals, Comput. Mater. Sci., 1999, 14, 80–83 CrossRef CAS.
- S. Plimpton, Fast parallel algorithms for short-range molecular dynamics, J. Comput. Phys., 1995, 117, 1–19 CrossRef CAS.
- A. Stukowski, Visualization and analysis of atomistic simulation data with OVITO – the Open Visualization Tool, Modell. Simul. Mater. Sci. Eng., 2010, 18, 015012 CrossRef.
| This journal is © The Royal Society of Chemistry 2017 |

