 Open Access Article
Creative Commons Attribution 3.0 Unported Licence
Heavy metal ions removal from aqueous solution by xanthate-modified cross-linked magnetic chitosan/poly(vinyl alcohol) particles†
Long Lva,
Nan Chen *a,
Chuanping Fenga,
Jing Zhanga and
Miao Lib
aSchool of Water Resources and Environment, China University of Geosciences (Beijing), Beijing, 100083, China. E-mail: chennan@cugb.edu.cn; Tel: +86 10 82322281
bSchool of Environment, Tsinghua University, Beijing 100084, China
First published on 26th May 2017
Abstract
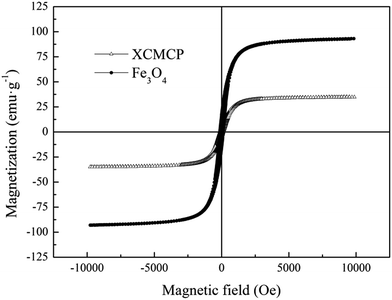
Xanthate-modified cross-linked magnetic chitosan/poly(vinyl alcohol) particles (XCMCP) were synthesized and applied to remove Pb(II) and Cu(II) ions from aqueous solutions. To further explore the adsorption mechanisms, the complexes were characterized by Fourier transform infrared spectroscopy (FTIR), Scanning Electron Microscope (SEM), Vibrating Sample Magnetometer (VSM), X-ray Diffraction (XRD), and X-ray Photoelectron Spectroscopy (XPS). The effects of pH, contact time, and temperature on the adsorption process were investigated. The results showed that the particles were super-paramagnetic with a saturation magnetization of 34.8 emu g−1, had an irregular surface, and successfully introduced xanthate groups. The adsorption capacity of XCMCP for Pb(II) or Cu(II) was better in near-neutral pH. The kinetic data were well-described by the pseudo-second-order kinetic model. The Langmuir and Freundlich isotherms fit the equilibrium data well. Based on the Langmuir isotherm model, the maximum adsorption capacities of XCMCP at 328 K were 59.855 and 139.797 mg g−1 for Pb(II) and Cu(II), respectively. Meanwhile, the effect of temperature on the reaction process was not significant. XCMCP exhibited a good property for repeated use and could still retain an effective adsorption efficiency after seven cycles. The mechanism for Pb(II) and Cu(II) adsorption onto XCMCP involves the interactions of N and S atoms with heavy metals, crystal formation and surface adsorption. Thereinto, contributions of crystal formation were dominant. These properties of XCMCP make it promising for practical use, which suggests that XCMCP is a promising adsorbent for hazardous-metal-ion-contaminated water treatment.
Introduction
Water pollution by heavy metals is a serious environmental problem because of their toxic and non-biodegradable nature.1 The main potential sources of heavy metals in wastewater are fertilizers, fungicides, metals that are used in manufacturing, paints, pigments, and batteries.2 Heavy metal ions may cause severe health problems in animals and humans, because they can bind to proteins, nucleic acids, and small metabolites in living organisms, which inhibits their functions.3 Lead and copper ions are often chosen as target metals because of their widespread use in the metal industry and their toxicity for humans and environmental health.4 Copper and lead pollution has occurred in many places. Ground/surface water in Osun.5 and surface water in cross-river states have shown a high copper concentration.6 Well boreholes and streams in Kogi, and ground water in Abia contain above the permissible Pb(II) limit.7,8 Because they are harmful to human health, the United States Environmental Protection Agency (USEPA) has set Interim Drinking Water Health Advisory levels of 0.015 mg L−1 for Pb2+ and 1.30 mg L−1 for Cu2+, and the maximum dosages recommended by the World Health Organization (WHO) are 0.01 mg L−1 for Pb2+ and 2.00 mg L−1 for Cu2+.Current techniques for the remediation of heavy-metal-contaminated water include chemical precipitation, ion exchange, filtration, reverse osmosis, and electrodeposition.9–13 Compared with these treatment methods, adsorption is more attractive because of its low cost, high removal efficiency, and easy operation. Common sorbents, which include activated carbon, atomized slag, and red mud, are limited because of their low efficiency, their sensitivity to pH and the presence of other organic materials.14–16 Chitosan (CS), which is the second-most-abundant biopolymer after cellulose,17 is often chosen as an effective bio-adsorbent for the removal or recovery of hazardous dyes, proteins, and heavy metals because of its non-toxicity, good biodegradability, excellent chemical resistance, and good mechanical properties.18 However, dissolved chitosan is difficult to separate from solution after adsorption of target contaminants and usually requires separation or modification.19 To solve this problem, poly(vinyl alcohol) (PVA) has been blended with chitosan to further enhance its mechanical and chemical properties via the formation of hydrogen bonds,20,21 which can create a three-dimensional network.22 Ngah et al. studied copper removal by chitosan/PVA beads, but the adsorption capacity of chitosan/PVA beads was lower than other sorbents.21 It is important to understand how to enhance the adsorption capacity of this adsorbent type. Sulfur compounds are efficient metal chelators because of their strong affinity for most heavy metals.23 The xanthation of carbohydrate materials, particularly chitosan, has been reported for metal removal from aqueous solution, which occurs because the introduction of xanthate groups can enhance the metal-chelating capability of the adsorption.24
Adsorbent recycling has become a key issue in practical applications, and magnetic materials are receiving increased attention. If magnetic properties can be imparted to the sorbents, it may facilitate their removal from solution. Magnetic chitosan composites are novel materials that exhibit good sorption behavior for various toxic pollutants.25 However, it is necessary to establish how to improve the adsorption ability of this kind of adsorbent.
The overall goal of this research was to develop a material with a high adsorption capacity and good magnetic properties to remove Pb2+ and Cu2+ from aqueous solution. The aims of this study were to: (1) characterize the physical and chemical properties and specific sorption sites of XCMCP, (2) investigate the adsorption capacities of XCMCP for Pb2+ and Cu2+, and (3) explain the XCMCP mechanisms.
Materials and methods
Materials
Chitosan powder (average molar mass of approximately one million, deacetylation degree of 95.23%, and viscosity of 150 mPa s) and Fe3O4 nanopowder (purity > 99.5%, 20 nm globular particles) were supplied by Aladdin Industrial Co. (Shanghai, China). PVA-1788 (purity > 97.0%) was from Shanghai Yingjia Industrial Development Co. (Shanghai, China). Copper sulfate pentahydrate (CuSO4·5H2O) and lead nitrate (Pb(NO3)2) were from Sinopharm Chemical Reagent Co., Ltd. (Beijing, China). All other chemicals were commercially available analytical-grade reagents. All solutions were prepared with deionized water.Preparation of xanthate-modified cross-linked magnetic CS/PVA beads
Preparation of XCMCP included two sequential steps. First, cross-linked magnetic CS/PVA was synthesized using the momentary gelation method by dropping a composite gel-forming solution into an alkaline solution. Second, cross-linked magnetic CS/PVA was modified by introducing xanthate groups onto its backbone by treating it with carbon disulfide under alkaline conditions (the formation mechanisms was shown in ESI Fig. S1†).Chitosan powder (6 g) was dissolved in 150 mL of 2% (v/v) aqueous acetic acid to form a solution of chitosan. PVA solution was prepared by dissolving 6 g of PVA powder in 150 mL of deionized water. After the chitosan and PVA powder had dissolved, the two solutions were mixed together, and 6 g Fe3O4 was added into the mixture. The composite gel-forming solution was stirred continuously for 3 h at 303 ± 1 K. The gel-forming solution was dropped into 1.0 M sodium hydroxide, which resulted in the formation of spherical hydrogel beads. The beads were gelled for 1 h and washed several times with deionized water. Finally, the wet beads were dipped into glutaraldehyde solution (0.046 mL, 0.12 mmol) and stirred for 12 h at 303 ± 1 K to obtain cross-linked magnetic CS/PVA. After washing thoroughly with deionized water, the cross-linked magnetic CS/PVA beads were filtered and dried at 343 K for 24 h.
The CS/PVA beads (2 g) were treated with 100 mL of 14% NaOH solution and 1 mL of carbon disulfide (the amount of CS2 used was determined by preliminary experiments and the results were shown in ESI Fig. S2†). The mixture was stirred at room temperature for 24 h. The product was washed thoroughly with distilled water and dried at 343 K for 24 h.
Batch adsorption studies
Uptake experiments were carried out by placing 0.15 g of the dried XCMCP in a series of flasks that contained 50 mL metal ions solutions. Different metal ions concentrations were used compared with similar prior studies (49.50 ± 2.70, 98.12 ± 2.02, and 192.68 ± 2.84 mg L−1 of Cu2+ and 48.17 ± 0.21, 107.20 ± 0.82, and 211.57 ± 1.41 mg L−1 of Pb2+). The flasks were agitated on a shaker for 12 h at 308, 318, and 328 (±1) K. In alkaline solution, precipitated heavy metal ions may interfere with the adsorption analysis, thus the effect of pH on adsorption was investigated by adjusting the pH from 2.0 to 7.0 using HCl or NaOH solutions (0.1 M). Samples were taken at predetermined time intervals to analyze the residual metal ions concentrations in solutions. All experiments were conducted in duplicate.The amount of adsorbed metal ions at equilibrium (qe, mg g−1) was calculated as:
 | (1) |
Analytical methods
Metal ions concentrations were determined using atomic adsorption spectroscopy (SSX-550, Shimadzu, Japan) at 283.3 nm for Pb2+ and 324.7 nm for Cu2+. The slit width was 0.4 nm.The surface morphologies of the XCMCP were visualized using SEM (SSX-550, Shimadzu, Japan). FTIR spectra were obtained with a Fourier transform infrared spectrometer (Nexus, Nicolet, USA), and a vibrating-sample magnetometer (7303, Lake shore, USA) was used to characterize the magnetic properties of XCMCP at room temperature. The crystal structure of XCMCP was obtained by XRD (D8 Focus, Bruker, Germany), and XPS (ESCALAB 250Xi, Thermo Fisher, USA) was used to characterize the elemental compositions of the XCMCP surfaces.
Results and discussion
Adsorption material characterization
![[double bond, length as m-dash]](https://www.rsc.org/images/entities/char_e001.gif) N and C
N and C![[double bond, length as m-dash]](https://www.rsc.org/images/entities/char_e001.gif) O stretching vibration),27 1399 cm−1 (O–H in-plane bending vibration), 1160 cm−1 (C–O–C stretching vibration),28 1090 cm−1 (C–O stretching vibration of secondary alcohol), 895 cm−1 (N–H rocking vibration of –NH2), and 663 cm−1 (O–H out-of-plane bending vibration).
O stretching vibration),27 1399 cm−1 (O–H in-plane bending vibration), 1160 cm−1 (C–O–C stretching vibration),28 1090 cm−1 (C–O stretching vibration of secondary alcohol), 895 cm−1 (N–H rocking vibration of –NH2), and 663 cm−1 (O–H out-of-plane bending vibration).
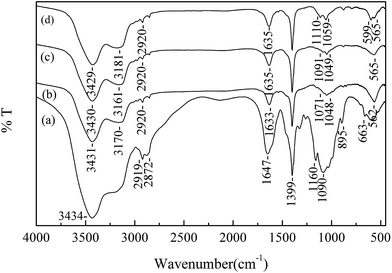 | ||
| Fig. 1 FTIR spectra of chitosan flaske (line a), XCMCP (line b), XCMCP loaded with Pb2+ (line c) and XCMCP loaded with Cu2+ (line d). | ||
The FTIR spectrum of XCMCP is presented in Fig. 1(line b). Compared with the spectrum of pure chitosan, most basic characteristic peaks were weakened in the spectrum of XCMCP, which was attributed to the addition of PVA and Fe3O4. After modification, the band at 1071 cm−1 could be assigned to C![[double bond, length as m-dash]](https://www.rsc.org/images/entities/char_e001.gif) S and S–C–S.23 A new peak appeared at 562 cm−1, which is related to Fe–O bond vibration, and demonstrates the existence of Fe3O4.29 The peak at 633 cm−1 disappeared because of the mixture of chitosan with PVA, which resulted in the formation of hydrogen bonds. After Pb2+ and Cu2+ adsorption (Fig. 1(line c); Fig. 1(line d)), the adsorption band at 1071 cm−1 shifted to 1091 cm−1 and 1110 cm−1, respectively. Thus, it could be concluded that the xanthate group participated in the adsorption process. A peak that is attributed to the stretching vibration of the S–O of SO42− appeared at 599 cm−1, and new bands at 500–400 cm−1 revealed that SO42− took part in the coordination rather than existed as free ions in the complexes.30,31 Based on FTIR analysis, Laus et al. and Zang et al. reported that the –NH2 group of chitosan was involved in metal ions adsorption.2,17 However, a significant change in –NH2 was not observed in this study, possibly because –NH2 less effect on metal ions adsorption, or because the change was too weak to be observed.
S and S–C–S.23 A new peak appeared at 562 cm−1, which is related to Fe–O bond vibration, and demonstrates the existence of Fe3O4.29 The peak at 633 cm−1 disappeared because of the mixture of chitosan with PVA, which resulted in the formation of hydrogen bonds. After Pb2+ and Cu2+ adsorption (Fig. 1(line c); Fig. 1(line d)), the adsorption band at 1071 cm−1 shifted to 1091 cm−1 and 1110 cm−1, respectively. Thus, it could be concluded that the xanthate group participated in the adsorption process. A peak that is attributed to the stretching vibration of the S–O of SO42− appeared at 599 cm−1, and new bands at 500–400 cm−1 revealed that SO42− took part in the coordination rather than existed as free ions in the complexes.30,31 Based on FTIR analysis, Laus et al. and Zang et al. reported that the –NH2 group of chitosan was involved in metal ions adsorption.2,17 However, a significant change in –NH2 was not observed in this study, possibly because –NH2 less effect on metal ions adsorption, or because the change was too weak to be observed.
Effect of pH on metal ions adsorption
Solution pH is one of the most important parameters that affects the adsorption process,33 because it affects metal ions speciation, adsorbent surface charge, and the degree of sorbent ionization.34 The effect of pH on Pb2+ and Cu2+ adsorption are shown in Fig. 5. Based on calculations that were performed using Visual MINTEQ, Pb exists as Pb2+, PbNO3+, Pb(NO3)2(aq), Pb2OH3+, and Pb4(OH)44+ in aqueous solutions at pH 2.0–7.0. The adsorption capacity increased with an increasing pH. In the pH range 2.0–7.0, the maximum adsorption capacity of Pb2+ was 36.93 mg L−1 at pH 6.88. At a lower pH, the adsorption capacity was lower because the Pb species were mainly Pb2+ and PbNO3+, which competed with the excessive amounts of H+ or H3O+. Meanwhile, the protonation of –NH2 to form –NH3+ also affected the adsorption. The result is consistent with previous studies such as those by He et al., Li et al., and Li et al., where they reported that heavy metal ions compete with H+ in solutions with a low pH.1,35,36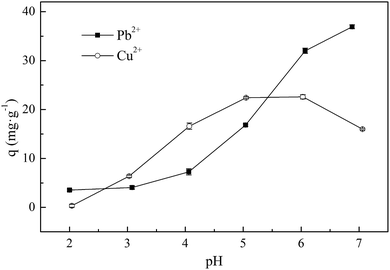 | ||
| Fig. 5 Effect of pH on adsorption of Pb2+ and Cu2+ onto XCMCP. Experimental conditions: initial concentration was 100 mg L−1, dosage of XCMCP was 0.1 g, and temperature was 303 K. | ||
In aqueous solutions at pH 2.0–7.0, Cu may exist as CuSO4(aq), CuHSO4+, and Cu3(OH)42+. As the pH increases, the adsorption capacity of Cu2+ increases gradually. The maximum adsorption capacity of Cu2+ was 22.59 mg L−1 at pH 6.03. When the pH was increased to 7.0, the adsorption capacity decreased to 15.96 mg g−1, which agrees with the study of Laus et al., who observed that Cu(II) adsorption as determined by the chitosan–epichlorohydrin–triphosphate decreased significantly when the pH increased from 6.0 to 7.0.2 This phenomenon may result because of the hydrolytic properties of the copper ions.
No obvious leakage or change in XCMCP characteristics was observed during the reaction, which indicates that XCMCP was insoluble in acidic and alkaline media. XCMCP did not show any observable mass loss at low pH, which shows that XCMCP was more resistant to low-pH conditions compared with pure chitosan.37 In practical applications, the pH of most heavy-metal-containing wastewater, such as electroplating wastewater, mine wastewater, battery production wastewater is acidic. If XCMCP exhibited a good durability in acidic wastewater, it would be a suitable adsorbent for wastewater treatment.
Adsorption kinetics
To investigate the adsorption mechanisms and potential rate-controlling step, pseudo-first-order and pseudo-second-order kinetic models and intraparticle diffusion were used to interpret the experimental data. The pseudo-first-order and pseudo-second-order kinetic equation models are expressed as:38| qt = qe − qee−k1t | (2) |
 | (3) |
The intraparticle diffusion model was used to investigate the diffusion mechanisms:39
| qt = kp,it1/2 + Ci | (4) |
| Metal ions | C0 (mg L−1) | Pseudo-first-order | Pseudo-second-order | Intra-particle diffusion | |||||
|---|---|---|---|---|---|---|---|---|---|
| K1 (h−1) | R2 | K2 (g mg−1 h−1) | R2 | kp,1 (mg g−1 h−1/2) | R2 | kp,2 (mg g−1 h−1/2) | R2 | ||
| Pb(II) | 48.17 | 3.700 | 0.951 | 0.368 | 0.972 | 12.67 | 0.984 | 0.069 | 0.951 |
| 107.20 | 0.688 | 0.990 | 0.024 | 0.985 | 17.39 | 0.995 | 0.604 | 0.994 | |
| 211.57 | 0.748 | 0.963 | 0.024 | 0.971 | 20.42 | 0.945 | 1.476 | 0.543 | |
| Cu(II) | 49.50 | 0.903 | 0.977 | 0.081 | 0.988 | 7.970 | 0.987 | 0.714 | 0.747 |
| 98.12 | 1.511 | 0.902 | 0.088 | 0.963 | 10.40 | 0.817 | 1.684 | 0.764 | |
| 192.68 | 0.883 | 0.833 | 0.039 | 0.912 | 9.769 | 0.907 | 1.685 | 0.850 | |
At a low initial concentration (∼50 mg L−1), the correlation coefficients of the pseudo-first-order and pseudo-second-order models were 0.951 and 0.972 for Pb(II) and 0.977 and 0.988 for Cu(II), respectively, which indicates that both models fit the experimental data well. However, higher correlation coefficients were obtained from the pseudo-second-order model, which suggests that chemical sorption may be a rate-determining step in Pb2+ and Cu2+ adsorption,40 whereas the role of mass transfer in solution was more limited.41 Physical sorption was important in the adsorption process. As the initial concentration increased, the correlation coefficients for the pseudo-first-order and pseudo-second-order models decreased, especially for Cu2+, which demonstrates that the two kinetic models did not describe the adsorption process well at high initial concentrations. This is attributed to the increased complexity of adsorption (i.e., adsorption could no longer be attributed only to simple chemical and physical sorption) because of metal ions hydrolysis at high initial concentrations.
The parameters of intraparticle diffusion are presented in Table 1. The external surface adsorption stage of Pb2+ adsorption was completed within 2 h, whereas Cu2+ adsorption took longer. As the initial concentration increased, kp,1 increased significantly because of an enhancement of the concentration gradient force.42 The linear portions of the second stage did not pass through the origin (results not shown), which indicates that intra-particle diffusion was not the rate-limiting step in the adsorption process.43 kp,1 was much greater than kp,2, which suggests that external surface adsorption was the main rate-determining step.
Adsorption isotherms
Adsorption equilibrium isotherms can express the surface properties and affinities of adsorbents using certain constants.44 The initial Pb2+ and Cu2+ concentrations were adjusted to 1–500 mg L−1 for adsorption on XCMCP at 308, 318, and 328 K. Langmuir theory is based on the assumption that metal ions adsorption occurs on a homogenous surface by monolayer adsorption without any interaction among adsorbed ions.45 The Freundlich isotherm describes adsorption on a heterogeneous surface and is not restricted to monolayer formation, and the amount of adsorbate adsorbed increases infinitely with increasing concentration.46The Langmuir and Freundlich models were applied to interpret the adsorption process. Their linear forms are given as:43,47
 | (5) |
 | (6) |
The correlation coefficients (R2) for the two models are listed in Table 2. The Langmuir and Freundlich isotherms were fitted well to the equilibrium data, with R2 exceeding 0.90 at different temperatures. These results indicate that the reaction process was a combination of homogeneous and heterogeneous adsorption, and the effect of adsorbate and adsorbent interactions on the adsorption process was finite. The maximum adsorption capacity that was obtained by the Langmuir isotherm changed only slightly with increasing temperature, which showed that the effect of temperature on the reaction process was insignificant. In the study of Lu et al.,48 the adsorption capacity of Pb(II) imprinted chitosan for Pb(II) was controlled by temperature. Thus, the application of this adsorbent was limited by temperature in a practical application. The stable adsorption capacity of XCMCP for heavy metals at different temperatures made it a promising material for water treatment.
| Metal ions | T (K) | Langmuir isotherm | Freundlich isotherm | |||||
|---|---|---|---|---|---|---|---|---|
| Q0 (mg g−1) | b (L mg−1) | R2 | RL | KF (mg(1−1/n) L1/n g−1) | 1/n | R2 | ||
| Pb(II) | 308 | 57.979 | 9.450 × 10⁻³ | 0.987 | 0.987–0.173 | 3.036 | 0.453 | 0.930 |
| 318 | 58.126 | 7.500 × 10⁻³ | 0.967 | 0.989–0.207 | 2.263 | 0.494 | 0.958 | |
| 328 | 59.855 | 6.400 × 10⁻³ | 0.977 | 0.991–0.234 | 1.987 | 0.513 | 0.976 | |
| Cu(II) | 308 | 123.725 | 1.770 × 10⁻³ | 0.979 | 0.998–0.536 | 0.798 | 0.692 | 0.989 |
| 318 | 136.042 | 1.820 × 10⁻³ | 0.982 | 0.998–0.529 | 0.831 | 0.705 | 0.988 | |
| 328 | 139.797 | 1.920 × 10⁻³ | 0.988 | 0.998–0.516 | 0.859 | 0.708 | 0.987 | |
The essential characteristics of the Langmuir isotherm can be expressed by a dimensionless constant, the equilibrium parameter RL, which is calculated from the following equation:49
 | (7) |
The results of heavy metal ions adsorption onto magnetic materials from various previous studies are shown in Table 3. The maximum adsorption capacities of XCMCP for Pb2+ and Cu2+ were comparable to or higher than those of other magnetic adsorbents. XCMCP performed better in the separation process because of its higher saturation magnetization.
| Adsorbent name | Saturation magnetization (emu g−1) | Qm (mg g−1) | Conditions | References | |
|---|---|---|---|---|---|
| Pb2+ | Cu2+ | ||||
| Magnetic chitosan nanoparticles | 36.0 | — | 35.5 | 308.15 K, pH = 5.0 | 26 |
| EDCMS | 18.2 | 123.5 | 44.4 | 298.0 K, pH = 5.0 | 50 |
| CS/χOREC–Fe3O4 | 6.5 | — | 61.0 | 298.0 K, pH = 5.0 | 51 |
| MCCM | 10.5 | 45.8 | 88.2 | 303.0 K | 52 |
| The magnetically modified peanut husks | 2.14 | 28.3 | — | Laboratory temperature | 53 |
| Mesoporous CoFe2O4 nanoparticles | 46.71 | 32.1 | — | 293.0 K, pH = 5.0 | 54 |
| XCMCP | 34.8 | 59.9 | 139.8 | 318.00 K, pH = 6.0 | This work |
Regeneration ability
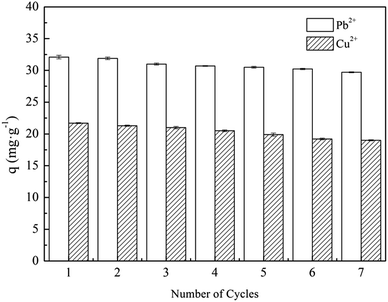
The adsorbent regeneration ability is important for its reuse, which could reduce the processing costs and allow for the recycling of useful materials. The exhausted adsorbent was eluted by using 0.1 M HCl solution. Seven consecutive metal ions adsorption–desorption cycles were conducted on XCMCP under the same conditions. Compared with fresh adsorbent, the adsorption capability of the regenerated adsorbent decreased slightly after seven adsorption–desorption cycles (Fig. 6), and the adsorption capacity changed from 32.1 to 29.7 mg g−1 for Pb2+ and from 21.7 to 19.0 mg g−1 for Cu2+. The physical properties of the regenerated adsorbent did not exhibit any obvious changes. These results indicate that elution with HCl solution regenerated the exhausted adsorbent. Therefore, XCMCP exhibits good properties for repeated use.Adsorption mechanism
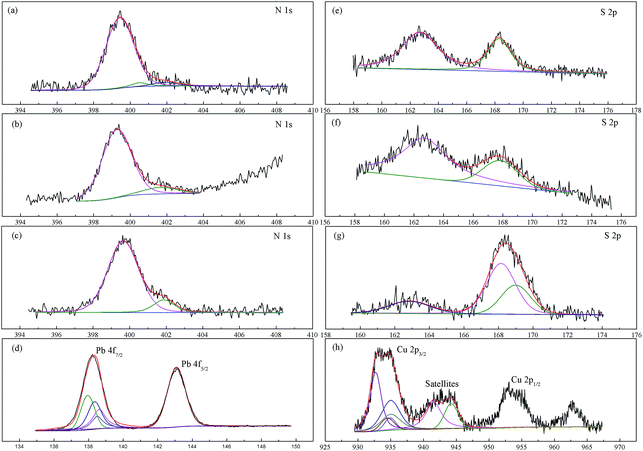
To investigate the interactions between XCMCP and heavy metals, and to elucidate the adsorption mechanisms of heavy metal ions onto particles, XPS analysis of the XCMCP surface was conducted before and after heavy metal adsorption. Survey scan results (not shown) indicated the presence of lead and copper, which demonstrates that the metal ions were adsorbed by XCMCP. The narrow C 1s, O 1s, and Fe 2p scans before and after adsorption (results not shown) did not indicate significant changes, which suggests that these atoms were not involved in the adsorption process. The narrow N 1s, S 2p, Pb 4f, and Cu 2p scans are shown in Fig. 7. The N 1s spectrum of XCMCP comprised three peaks with binding energies of 399.5, 400.5, and 401.9 eV (Fig. 7a). These peaks agreed with literature data.55 The peak at 399.5 eV originated from –NH2, which is the basic structural unit of chitosan.56 The second peak at 400.5 eV was assigned to O![[double bond, length as m-dash]](https://www.rsc.org/images/entities/char_e001.gif) C–NH– (amide) from the acetylated unit.56 The third peak at 401.9 eV was attributed to–NH3+ (protonated amine). The peaks of O
C–NH– (amide) from the acetylated unit.56 The third peak at 401.9 eV was attributed to–NH3+ (protonated amine). The peaks of O![[double bond, length as m-dash]](https://www.rsc.org/images/entities/char_e001.gif) C–NH– and –NH3+ were weak. The calculation of peak areas indicated that the total amine (–NH2) and protonated amine (–NH3+) concentrations exceeded 95%, which indicates that chitosan had a high degree of deacetylation.55 After Pb2+ adsorption (Fig. 7b), a new peak appeared at 399.7 eV, and the peak at 399.5 eV of XCMCP shifted slightly to 399.3 eV. After Cu2+ adsorption (Fig. 7c), a new peak appeared at 401.1 eV, and the peak at 399.5 eV of XCMCP shifted slightly to 399.7 eV. These phenomena are attributed to interactions of N atoms with the heavy metals (according to NIST XPS data). These results indicate the formation of complexes between the surface groups of XCMCP with heavy metal ions, where pairs of lone electrons from the N atoms were shared with Pb2+ or Cu2+. The change in spectrum was more significant after Cu2+ adsorption, which suggests that N atoms were more important in the Cu2+ adsorption process.
C–NH– and –NH3+ were weak. The calculation of peak areas indicated that the total amine (–NH2) and protonated amine (–NH3+) concentrations exceeded 95%, which indicates that chitosan had a high degree of deacetylation.55 After Pb2+ adsorption (Fig. 7b), a new peak appeared at 399.7 eV, and the peak at 399.5 eV of XCMCP shifted slightly to 399.3 eV. After Cu2+ adsorption (Fig. 7c), a new peak appeared at 401.1 eV, and the peak at 399.5 eV of XCMCP shifted slightly to 399.7 eV. These phenomena are attributed to interactions of N atoms with the heavy metals (according to NIST XPS data). These results indicate the formation of complexes between the surface groups of XCMCP with heavy metal ions, where pairs of lone electrons from the N atoms were shared with Pb2+ or Cu2+. The change in spectrum was more significant after Cu2+ adsorption, which suggests that N atoms were more important in the Cu2+ adsorption process.
The narrow S 2p scan before adsorption showed two peaks at 162.7 and 168.3 eV, which correspond to the thiol group and C![[double bond, length as m-dash]](https://www.rsc.org/images/entities/char_e001.gif) S, respectively (Fig. 7e).28 After Pb2+ adsorption, the peak at 168.3 eV shifted to 167.8 eV (Fig. 7f). After Cu2+ adsorption, the spectrum comprised three peaks. The additional peak at 168.15 eV was attributed to S–O in SO42−, and initial peaks moved to 162.8 and 169.0 eV (Fig. 7g). The significant change in binding energy (>0.5 eV) is considered to be from chemical shifts.57 This phenomenon may occur because of the coordination of S atoms with metal ions. Thus, the XPS spectra demonstrate the binding of Pb2+ and Cu2+ to S atoms.
S, respectively (Fig. 7e).28 After Pb2+ adsorption, the peak at 168.3 eV shifted to 167.8 eV (Fig. 7f). After Cu2+ adsorption, the spectrum comprised three peaks. The additional peak at 168.15 eV was attributed to S–O in SO42−, and initial peaks moved to 162.8 and 169.0 eV (Fig. 7g). The significant change in binding energy (>0.5 eV) is considered to be from chemical shifts.57 This phenomenon may occur because of the coordination of S atoms with metal ions. Thus, the XPS spectra demonstrate the binding of Pb2+ and Cu2+ to S atoms.
The Pb spectrum exhibits a doublet (Pb 4f5/2 and Pb 4f7/2) with symmetric peaks because of spin–orbit coupling (Fig. 7d). The area ratio of 4f5/2 to 4f7/2 was 3![[thin space (1/6-em)]](https://www.rsc.org/images/entities/char_2009.gif) :
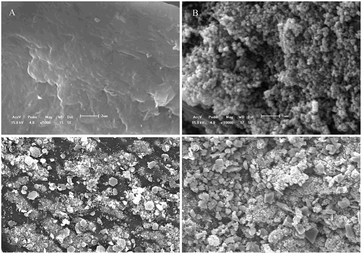
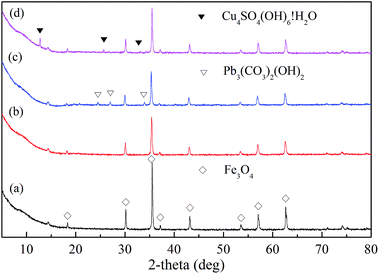
:![[thin space (1/6-em)]](https://www.rsc.org/images/entities/char_2009.gif) 4. The 4f7/2 peak could be decomposed into five contributions at 138.6 eV (23.78%), 137.95 eV (29.92%), 138.35 eV (29.23%), 138.5 eV (13.77%), and 136.85 eV (3.30%), which correspond to Pb–S, Pb(OH)2, PbCO3, PbNO3, and Pb–NH2, respectively (according to NIST XPS data). Chemical and physical sorption accounted for 27.08% and 72.92% of the adsorption process, respectively. Therefore, S atoms played a leading role in chemical sorption. In physical sorption, Pb2+ likely formed crystals and was adsorbed on the XCMCP surface. This speculation is consistent with the SEM and XRD results.
4. The 4f7/2 peak could be decomposed into five contributions at 138.6 eV (23.78%), 137.95 eV (29.92%), 138.35 eV (29.23%), 138.5 eV (13.77%), and 136.85 eV (3.30%), which correspond to Pb–S, Pb(OH)2, PbCO3, PbNO3, and Pb–NH2, respectively (according to NIST XPS data). Chemical and physical sorption accounted for 27.08% and 72.92% of the adsorption process, respectively. Therefore, S atoms played a leading role in chemical sorption. In physical sorption, Pb2+ likely formed crystals and was adsorbed on the XCMCP surface. This speculation is consistent with the SEM and XRD results.
The Cu 2p XPS spectrum revealed three segments, Cu 2p1/2, Cu 2p3/2, and satellites (Fig. 7h). The appearance of satellites demonstrated the presence of Cu2+ ions.58 The Cu 2p3/2 peak could be decomposed into five contributions at 935.1 eV (29.52%), 935.0 eV (17.81%), 934.9 eV (6.43%), 934.5 eV (7.69%), and 932.7 eV (38.55%), which were assigned to Cu–S, CuCO3, CuSO4, Cu–NH2, and Cu(OH)2, respectively (according to NIST XPS data). Chemical and physical sorption accounted for 37.21% and 62.79% of the adsorption process, respectively. The mechanisms of Cu(II) sorption were similar to those of Pb(II).
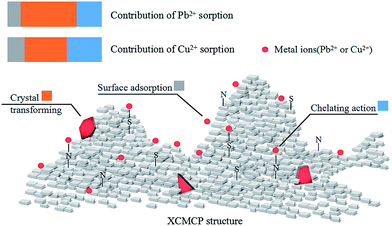
In summary, the FTIR, SEM, and XRD analyses demonstrated that the xanthate group participated in the adsorption process, and that crystals appeared on the XCMCP surface after adsorption. These conclusions were confirmed by the XPS analysis, which indicated the following possible mechanism of heavy metal absorption by XCMCP: (1) N and S atoms interacted with heavy metals, (2) heavy metals were transformed to crystals, and (3) heavy metals adsorbed on the XCMCP surface (Fig. 8).
Conclusions
XCMCP was synthesized and tested for metal ions removal from aqueous solution. The characterization results showed that XCMCP was a rough and magnetic material with xanthate groups. The adsorption capacity of XCMCP for Pb(II) or Cu(II) was better in near-neutral pH. Chemical sorption was likely the rate-limiting step in Pb(II) and Cu(II) adsorption process. Physical sorption was important in the adsorption process. External surface adsorption was the main rate-determining step for adsorption. Based on the isotherm models, the maximum adsorption capacities of XCMCP were 59.855 and 139.797 mg g−1 for Pb(II) and Cu(II) at 328 K, respectively, and the reaction was a combination of homogeneous and heterogeneous adsorption. XCMCP exhibited a good property for repeated use and could still retain an effective adsorption efficiency after seven cycles. The mechanism for Pb(II) and Cu(II) adsorption onto XCMCP involved the interactions of N and S atoms with heavy metals, and the transformation of heavy metals to crystals followed by their adsorption on the XCMCP surface. The magnetic and reusability properties of XCMCP make it a promising adsorbent for hazardous-metal-ion-contaminated water treatment.Acknowledgements
The authors acknowledge financial supports from the National Natural Science Foundation of China (NSFC) (No. 21407129; No. 51578519).References
- J. He, Y. Lu and G. Luo, Chem. Eng. J., 2014, 244, 202–208 CrossRef CAS.
- R. Laus, T. G. Costa, B. Szpoganicz and V. T. Fávere, J. Hazard. Mater., 2010, 183, 233–241 CrossRef CAS PubMed.
- O. Ozay, S. Ekici, Y. Baran, S. Kubilay, N. Aktas and N. Sahiner, Desalination, 2010, 260, 57–64 CrossRef CAS.
- S. Amirnia, M. B. Ray and A. Margaritis, Chem. Eng. J., 2015, 264, 863–872 CrossRef CAS.
- O. O. Ayantobo, J. A. Awomeso, G. O. Oluwasanya, B. S. Bada and A. M. Taiwo, Am. J. Environ. Sci., 2014, 10, 289–300 CrossRef CAS.
- F. E. Ekpo, N. N. Agu and U. I. Udoakpan, Am.-Eurasian J. Toxicol. Sci., 2013, 1–11 Search PubMed.
- J. J. Musa and J. J. Ahanonu, Int. J. Basic Appl. Sci., 2013, 548–563 Search PubMed.
- R. U. Adindu, M. U. Igboekwe and L. Nnanna, Am. J. Chem., 2012, 2, 121–125 CrossRef CAS.
- F. Fu and Q. Wang, J. Environ. Manage., 2011, 92, 407–418 CrossRef CAS PubMed.
- F. Gode and E. Pehlivan, J. Hazard. Mater., 2006, 136, 330–337 CrossRef CAS PubMed.
- J. Landaburu-Aguirre, E. Pongrácz, P. Perämäki and R. L. Keiski, J. Hazard. Mater., 2010, 180, 524–534 CrossRef CAS PubMed.
- M. Mohsen-Nia, P. Montazeri and H. Modarress, Desalination, 2007, 217, 276–281 CrossRef CAS.
- C. P. Nanseu-Njiki, S. R. Tchamango, P. C. Ngom, A. Darchen and E. Ngameni, J. Hazard. Mater., 2009, 168, 1430–1436 CrossRef CAS PubMed.
- A. Jusoh, L. S. Shiung, N. A. Ali and M. J. M. M. Noor, Desalination, 2007, 206, 9–16 CrossRef CAS.
- H. I. Chung, K. K. Sang, S. L. Yong and J. Yu, Geosci. J., 2007, 11, 137–145 CrossRef CAS.
- C. Brunori, C. Cremisini, P. Massanisso, V. Pinto and L. Torricelli, J. Hazard. Mater., 2005, 117, 55–63 CrossRef CAS PubMed.
- J. Zang, S. Jia, Y. Liu, S. Wu and Y. Zhang, Catal. Commun., 2012, 27, 73–77 CrossRef CAS.
- H. Y. Zhu, J. Ru, X. Ling and L. Wei, J. Hazard. Mater., 2010, 179, 251–257 CrossRef CAS PubMed.
- Y. Xie, S. Li, K. Wu, J. Wang and G. Liu, Energy, 2011, 366, 237–244 CAS.
- C. H. Chen, F. Y. Wang, C. F. Mao and C. H. Yang, J. Appl. Polym. Sci., 2007, 105, 1086–1092 CrossRef CAS.
- W. S. W. Ngah, A. Kamari and Y. J. Koay, Int. J. Biol. Macromol., 2004, 34, 155–161 CrossRef PubMed.
- H. Y. Zhu, Y. Q. Fu, R. Jiang, J. Yao, L. Xiao and G. M. Zeng, Bioresour. Technol., 2012, 105, 24–30 CrossRef CAS PubMed.
- Q. Song, C. Wang, Z. Zhang and J. Gao, Water Sci. Technol., 2014, 69, 298–304 CrossRef CAS PubMed.
- D. Chauhan and N. Sankararamakrishnan, Bioresour. Technol., 2008, 99, 9021–9024 CrossRef CAS PubMed.
- D. H. K. Reddy and S. M. Lee, Adv. Colloid Interface Sci., 2013, 201–202, 68–93 CrossRef CAS PubMed.
- Y. Chen and J. Wang, Chem. Eng. J., 2011, 168, 286–292 CrossRef CAS.
- E. Guibal, C. Milot, O. Eterradossi, C. Gauffier and A. Domard, Int. J. Biol. Macromol., 1999, 24, 49–59 CrossRef CAS PubMed.
- Y. Chen and J. Wang, Nucl. Eng. Des., 2012, 242, 452–457 CrossRef CAS.
- L. Zhou, C. Shang, Z. Liu, G. Huang and A. A. Adesina, J. Colloid Interface Sci., 2012, 366, 165–172 CrossRef CAS PubMed.
- H. Liu, Y. Du, X. Wang, Y. Hu and J. F. Kennedy, Carbohydr. Polym., 2004, 56, 243–250 CrossRef CAS.
- S. Sun and A. Wang, Sep. Purif. Technol., 2006, 49, 197–204 CrossRef CAS.
- J. Zhi, Y. Wang, Y. Lu, J. Ma and G. Luo, React. Funct. Polym., 2006, 66, 1552–1558 CrossRef CAS.
- H. Y. Zhu, R. Jiang, L. Xiao and G. M. Zeng, Bioresour. Technol., 2010, 101, 5063–5069 CrossRef CAS PubMed.
- Q. Peng, Y. Liu, G. Zeng, W. Xu, C. Yang and J. Zhang, J. Hazard. Mater., 2010, 177, 676–682 CrossRef CAS PubMed.
- T. T. Li, Y. G. Liu, Q. Q. Peng, X. J. Hu, T. Liao, H. Wang and M. Lu, Chem. Eng. J., 2013, 214, 189–197 CrossRef CAS.
- X. Li, Y. Li and Z. Ye, Chem. Eng. J., 2011, 178, 60–68 CrossRef CAS.
- A. A. Sarhan, D. M. Ayad, D. S. Badawy and M. Monier, React. Funct. Polym., 2009, 69, 358–363 CrossRef CAS.
- Z. P. Liang, Y. Q. Feng, S. X. Meng and Z. Y. Liang, Process Biochem., 2005, 40, 3218–3224 CrossRef CAS.
- F. C. Wu, R. L. Tseng and R. S. Juang, J. Colloid Interface Sci., 2005, 283, 49–56 CrossRef CAS PubMed.
- H. Yan, J. Dai, Z. Yang, H. Yang and R. Cheng, Chem. Eng. J., 2011, 174, 586–594 CrossRef CAS.
- F. Wu, J. Rs and T. Rl, Water Res., 2001, 35, 613–618 CrossRef CAS PubMed.
- A. Özer and G. Dursun, J. Hazard. Mater., 2007, 146, 262–269 CrossRef PubMed.
- S. Chatterjee and S. H. Woo, J. Hazard. Mater., 2009, 164, 1012–1018 CrossRef CAS PubMed.
- Y. T. Zhou, H. L. Nie, C. Branford-White, Z. Y. He and L. M. Zhu, J. Colloid Interface Sci., 2009, 74, 29–37 CrossRef PubMed.
- O. Altın, H. Ö. Özbelge and T. Doğu, J. Colloid Interface Sci., 1998, 198, 130–140 CrossRef.
- X. Li, Y. Li and Z. Ye, Chem. Eng. J., 2011, 178, 60–68 CrossRef CAS.
- D. Kavitha and C. Namasivayam, Bioresour. Technol., 2007, 98, 14–21 CrossRef CAS PubMed.
- Y. Lu, J. He and G. Luo, Chem. Eng. J., 2013, 226, 271–278 CrossRef CAS.
- I. A. W. Tan, B. H. Hameed and A. L. Ahmad, Chem. Eng. J., 2007, 127, 111–119 CrossRef CAS.
- Y. Ren, H. A. Abbood, F. He, H. Peng and K. Huang, Chem. Eng. J., 2013, 226, 300–311 CrossRef CAS.
- M. Xie, L. Zeng, Q. Zhang, Y. Kang, H. Xiao, Y. Peng, X. Chen and J. Luo, J. Alloys Compd., 2015, 647, 892–905 CrossRef CAS.
- X. Luo, Z. Jian, S. Liu and L. Zhang, Bioresour. Technol., 2015, 194, 403–406 CrossRef CAS PubMed.
- L. Rozumová, O. Životský, J. Seidlerová, O. Motyka, I. Šafařík and M. Šafaříková, J. Environ. Chem. Eng., 2015, 4, 549–555 CrossRef.
- D. C. Culita, C. M. Simonescu, M. Dragne, N. Stanica, C. Munteanu, S. Preda and O. Oprea, Ceram. Int., 2015, 41, 13553–13560 CrossRef CAS.
- P. Huang, M. Cao and Q. Liu, Colloids Surf., A, 2012, 409, 167–175 CrossRef CAS.
- G. Lawrie, I. Keen, B. Drew, A. Chandlertemple, L. Rintoul, P. Fredericks and L. Grøndahl, Biomacromolecules, 2007, 8, 2533–2541 CrossRef CAS PubMed.
- S. Hasan, A. Krishnaiah, T. K. Ghosh, D. S. Viswanath, V. M. Boddu and E. D. Smith, Ind. Eng. Chem. Res., 2006, 45, 5066–5077 CrossRef CAS.
- J. Xiao, J. Qiao, I. M. C. Lo, W. Lei, X. Guan, Z. Lu, G. Zhou and C. Xu, J. Hazard. Mater., 2014, 283, 880–887 Search PubMed.
Footnote |
| † Electronic supplementary information (ESI) available. See DOI: 10.1039/c7ra02810e |
| This journal is © The Royal Society of Chemistry 2017 |

