 Open Access Article
Creative Commons Attribution 3.0 Unported Licence
Loading of Co3O4 onto Pt-modified nitrogen-doped TiO2 nanocomposites promotes photocatalytic hydrogen production†
Wen-Dong Wei,
Xiang-Yu Liu,
Shi-Cong Cui* and
Jin-Gang Liu *
*
Key Laboratory for Advanced Materials, School of Chemistry & Molecular Engineering, East China University of Science and Technology, Shanghai 200237, P. R. China. E-mail: shicongcui@ecust.edu.cn; liujingang@ecust.edu.cn
First published on 12th May 2017
Abstract
Photocatalytic water splitting has been considered as one of the most promising methods to produce hydrogen as a source of clean fuel. Use of co-catalysts and elemental doping in TiO2 has been extensively explored for effective photocatalysis. Here we report the synthesis of visible light responsive Pt and Co3O4 co-modified nitrogen-doped TiO2 (N–TiO2) nanocomposites for efficient photocatalytic hydrogen production. Pt–Co3O4(S)/N–TiO2 (PCNT(S)) and Pt–Co3O4(D)/N–TiO2 (PCNT(D)) composites were synthesized by one- and two-step methods, respectively. Experimental results showed that additional loading of Co3O4 onto a very low content (0.02 wt%) Pt-modified N–TiO2 nanocomposite significantly increases the efficiency of photocatalytic hydrogen production. Catalyst composites prepared by the two-step method, where close interaction occurred between the surface-loaded Co3O4 and Pt on the N–TiO2 nanoparticles, showed much higher photocatalytic activity for hydrogen production than that prepared by the one-step method, where Co3O4 is evenly dispersed in N–TiO2. The position of the co-catalyst Co3O4 in TiO2 has a significant effect on the photocatalytic properties of the prepared photocatalysts.
1 Introduction
Nowadays, cleaner renewable energy production has become the most prevailing global issue owing to the growing demand for nonrenewable fossil fuels and the environmental pollution caused by these fossil fuels.1 Recently, hydrogen (H2), as a secondary source of energy, has been proved to be a promising fuel and energy carrier owing to its renewability, no pollution, ideal calorific value, and universal element properties.2–5 Photocatalytic water splitting has been considered as one of the most promising methods to produce H2 because of its environmentally benign process and the use of solar energy as an energy source.6–8 The process was originally discovered by Fujishima and Honda in 1972 through photoelectrochemical water splitting by TiO2 single crystal electrodes under ultraviolet (UV) light radiation.9 Since then, TiO2 has drawn immense attraction of researchers to water splitting by photoelectrochemical or photocatalytic systems.10Nevertheless, the large bandgap (3.2 eV) and high photogenerated electron–hole recombination rate constrain the practical use of TiO2 in the H2 evolution reaction.11,12 Elemental doping is an effective way to decrease the semiconductor bandgap.13–15 Nitrogen-doped (N-doped) TiO2 has widely been used in photocatalytic water splitting, which showed efficient H2 production under visible light irradiation by narrowing the bandgap energy of TiO2.16,17 At the same time, application of co-catalyst was found to be effective in reducing the recombination of photo generated electron and holes.18,19 Thus far, many studies have reported that loading of noble metals such as Au,20,21 Ag,22 Pt,23 and Rh24 on the surface of a semiconductor as a co-catalyst plays an important role in photocatalytic water splitting, which revealed that high H2 production is due to the electron trapping properties of noble metals. Application of Pt has been extensively studied because an appropriate Schottky barrier is found in it, which is beneficial for H+ reduction.25–27 Yu et al.28 fabricated Pt/TiO2 by the photochemical reduction of H2PtCl6 on TiO2 and found that the rate of photocatalytic H2 production was significantly enhanced by loading Pt on the surface of TiO2, and the optimal content of Pt loading was about 2.0 wt%. In addition to noble metals, cobalt oxide has recently been explored as an alternative co-catalyst for photocatalytic H2 production.29,30 Bala et al.31 synthesized the Co3O4/TiO2 composite using Co(II) metal–organic frameworks as a TiO2 absorbent and sacrificial template, in which Co3O4 acted as a co-catalyst to extract the photogenerated charge carrier, exhibiting high H2 evolution rate. However, to the best of our knowledge, no example has been reported about the synergistic effect of different co-catalysts on the H2 evolution rate of related TiO2-based photocatalysts.
In this study, we have used two different methods to prepare Pt and Co3O4 co-modified N-doped TiO2 (N–TiO2) composites and investigated the H2 evolution from water photocatalyzed by these composites. Results showed that the presence of Co3O4 on very low content Pt-modified N–TiO2 composite further enhanced the photocatalytic efficiency as compared to the Pt-only-modified composite, Pt@N–TiO2. Moreover, the position of the Co3O4 particles on the composite has a significant effect on the photocatalytic activity of the catalyst.
2 Experimental methods
2.1 Preparation of N–TiO2
All chemicals used in this study were of analytical grade and used as received without further purification. In the typical synthetic procedure, tetrabutyltitanate (TBOT, 0.029 mol) was added to 30 mL of isopropanol with magnetic stirring. Then, 40 mL of acetic acid solution (VCH3COOH![[thin space (1/6-em)]](https://www.rsc.org/images/entities/char_2009.gif) :
:![[thin space (1/6-em)]](https://www.rsc.org/images/entities/char_2009.gif) VH2O = 1
VH2O = 1![[thin space (1/6-em)]](https://www.rsc.org/images/entities/char_2009.gif) :
:![[thin space (1/6-em)]](https://www.rsc.org/images/entities/char_2009.gif) 3) was added dropwise to the above mixture and kept in an ice bath until a white precipitate was obtained. After stirring the solution continuously for 3 h to complete the hydrolysis, a certain amount of cholamine was added till the pH of the solution reached 9.0. The precursor was then transferred into a 50 mL Teflon-lined autoclave and heated at 180 °C for 24 h in an oven. Then, it was allowed to cool to room temperature naturally. A yellowish-white precipitate was obtained after centrifuging the solution, and the precipitate was washed several times with water and ethanol and dried at 60 °C overnight. The obtained composite was further annealed at 300 °C for 3 h (2 °C min−1) under air atmosphere to afford N–TiO2.
3) was added dropwise to the above mixture and kept in an ice bath until a white precipitate was obtained. After stirring the solution continuously for 3 h to complete the hydrolysis, a certain amount of cholamine was added till the pH of the solution reached 9.0. The precursor was then transferred into a 50 mL Teflon-lined autoclave and heated at 180 °C for 24 h in an oven. Then, it was allowed to cool to room temperature naturally. A yellowish-white precipitate was obtained after centrifuging the solution, and the precipitate was washed several times with water and ethanol and dried at 60 °C overnight. The obtained composite was further annealed at 300 °C for 3 h (2 °C min−1) under air atmosphere to afford N–TiO2.
2.2 Preparation of Co3O4/N–TiO2
The Co3O4/N–TiO2 composites were synthesized by two different methods: two-step and one-step methods. The composites prepared by the two-step method were represented as Co3O4(D)/N–TiO2 (CNT(D)). The Co3O4 co-catalyst was loaded onto N–TiO2 through impregnation of aqueous Co(NO3)2 solution on the N–TiO2 nanoparticles. About 0.5 mL of aqueous Co(NO3)2 solution with different concentrations (25, 62.5, 125, and 312.5 mmol L−1) was slowly added to 0.5 g of N–TiO2 powder, and the resultant composite was left for several hours till the powder was thoroughly soaked. The impregnated powder was dried at 60 °C and calcined under air atmosphere at 300 °C for 3 h (2 °C min−1). In Co3O4/N–TiO2 composites having different concentrations of Co(NO3)2, the molar ratios of Co![[thin space (1/6-em)]](https://www.rsc.org/images/entities/char_2009.gif) :
:![[thin space (1/6-em)]](https://www.rsc.org/images/entities/char_2009.gif) Ti atoms were 0.002, 0.005, 0.01, and 0.025, respectively, and they were represented as CNT(D)-1, CNT(D)-2, CNT(D)-3, and CNT(D)-4, respectively.
Ti atoms were 0.002, 0.005, 0.01, and 0.025, respectively, and they were represented as CNT(D)-1, CNT(D)-2, CNT(D)-3, and CNT(D)-4, respectively.
The Co3O4/N–TiO2 composites synthesized by the one-step method were represented as Co3O4(S)/N–TiO2 (CNT(S)). First, TBOT (0.029 mol) and different amounts of cobalt nitrate hexahydrate (Co(NO3)2·6H2O) were added to 30 mL of isopropanol with constant magnetic stirring. The procedure was the same as that described for the two-step method in Section 2.1. However, the molar ratios of Co![[thin space (1/6-em)]](https://www.rsc.org/images/entities/char_2009.gif) :
:![[thin space (1/6-em)]](https://www.rsc.org/images/entities/char_2009.gif) Ti atoms (Co
Ti atoms (Co![[thin space (1/6-em)]](https://www.rsc.org/images/entities/char_2009.gif) :
:![[thin space (1/6-em)]](https://www.rsc.org/images/entities/char_2009.gif) Ti = 0.002, 0.005, 0.01, and 0.025) were adjusted by controlling the concentration of Co(NO3)2 solution (25 mM to 0.31 M) during the preparation process. The composites thus prepared were labeled as CNT(S)-1, CNT(S)-2, CNT(S)-3, and CNT(S)-4, respectively.
Ti = 0.002, 0.005, 0.01, and 0.025) were adjusted by controlling the concentration of Co(NO3)2 solution (25 mM to 0.31 M) during the preparation process. The composites thus prepared were labeled as CNT(S)-1, CNT(S)-2, CNT(S)-3, and CNT(S)-4, respectively.
2.3 Preparation of Pt–Co3O4/N–TiO2
The Pt–Co3O4/N–TiO2 composites were prepared by in situ photoreduction of H2PtCl6 on Co3O4/N–TiO2 under light irradiation. CNT(S) or CNT(D) powder (1.0 g) was dispersed in a H2PtCl6 solution (100 mL, 0.01 mmol L−1) to produce the Pt 0.02 wt% loaded Co3O4(S)/N–TiO2 (PCNT(S)) or the Pt 0.02 wt% loaded Co3O4(D)/N–TiO2 (PCNT(D)). The different loading amount of Pt in the system was controlled by changing the concentration of the H2PtCl6 solution. The resulting suspension was stirred and irradiated by a 300 W Xe arc lamp for 1 h in a top-irradiation cell with a Pyrex window. The composites were then centrifuged and freeze dried.2.4 Characterizations
The morphology and structure of these composites were analyzed through transmission electron microscopy (TEM) and high-resolution transmission electron microscopy (HRTEM) with a JEOL model JEM 2100 EX instrument at an acceleration voltage of 200 kV. X-ray powder diffraction (XRD) was performed with a Rigaku Dmax-3C diffractometer using Cu Kα radiation (λ = 0.15408 nm) operated at 40 kV and 20 mA to characterize the crystal phases and crystallinity of the samples. Ultraviolet-visible (UV-Vis) absorption spectra of the samples were recorded by a Shimadzu UV-2600 spectrophotometer at a wavelength of 1000–200 nm. The photoluminescence (PL) spectra were measured using a fluorospectrophotometer (Horiba Fluoromax-4) at room temperature. The chemical states of surface elements were analyzed by X-ray photoelectron spectroscopy (XPS; Perkin-Elmer PHI 5000C).2.5 Photocatalytic hydrogen production
During water splitting for the evolution of H2, photocatalytic activity was evaluated under visible light and full spectrum irradiation. Photocatalytic experiments were performed in a gas-closed system using a Pyrex cell with a top quartz window. Typically, 100 mg of photocatalyst powder was ultrasonically dispersed in 100 mL of aqueous solution containing methanol as a sacrificial agent (VH2O![[thin space (1/6-em)]](https://www.rsc.org/images/entities/char_2009.gif) :
:![[thin space (1/6-em)]](https://www.rsc.org/images/entities/char_2009.gif) VMeOH = 9
VMeOH = 9![[thin space (1/6-em)]](https://www.rsc.org/images/entities/char_2009.gif) :
:![[thin space (1/6-em)]](https://www.rsc.org/images/entities/char_2009.gif) 1). Before irradiation, the system was evacuated several times to remove the residual air completely and then irradiated from the top window using a 300 W Xe lamp and a UV light cutoff filter (λ > 400 nm) with a light intensity of 380 mW cm−2. The reaction temperature was maintained at 25 °C with a water cooling circulator. The reaction was performed for 6 h, and the H2 gas produced was analyzed by a gas chromatograph (SHIMADZU GC-2014) equipped with a thermal conductivity detector. The sample of the gaseous mixture (2.0 mL) was drawn from the online sampling loop and argon was used as the carrier gas. Control experiments were performed without and with photocatalysts under light irradiation and in the dark, respectively.
1). Before irradiation, the system was evacuated several times to remove the residual air completely and then irradiated from the top window using a 300 W Xe lamp and a UV light cutoff filter (λ > 400 nm) with a light intensity of 380 mW cm−2. The reaction temperature was maintained at 25 °C with a water cooling circulator. The reaction was performed for 6 h, and the H2 gas produced was analyzed by a gas chromatograph (SHIMADZU GC-2014) equipped with a thermal conductivity detector. The sample of the gaseous mixture (2.0 mL) was drawn from the online sampling loop and argon was used as the carrier gas. Control experiments were performed without and with photocatalysts under light irradiation and in the dark, respectively.
3 Results and discussions
3.1 Morphologies and structures
The micromorphology and structures of the catalysts PCNT(D)-2 and PCNT(S)-2 with best photocatalytic performance were analyzed by TEM and HRTEM. In Fig. 1a, PCNT(D)-2 was shown with TiO2 nanoparticles that have an average diameter of 17 nm. There were also other small particles attached to the TiO2 nanoparticles, indicating the presence of Co3O4 on the surface of TiO2. Fig. 1b displayed the HRTEM image of PCNT(D)-2. A lattice spacing of 0.35 nm matched well with the (101) crystal plane of anatase TiO2. Moreover, a lattice fringe of 0.24 nm indicated that the bare crystal of (311) plane over Co3O4 emerged,32 revealing the successful loading of Co3O4. When Pt–Co3O4/N–TiO2 was prepared by the one-step method, an average particle diameter of 12 nm ranging from 9 to 16 nm were obtained, which may be due to the disturbance of Co during the formation of TiO2. A lattice spacing of 0.37 nm corresponded to anatase TiO2 (101) crystal plane (Fig. 1d).33,34 No other crystal was found in the HRTEM image of PCNT(S)-2, indicating that Co3O4 were probably dispersed in the N–TiO2 particles rather than loaded onto the surface of N–TiO2. No Pt particle was found in either sample, suggesting the low content of Pt in the composites.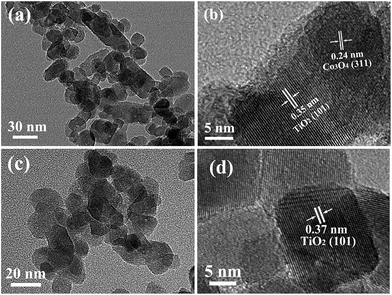 | ||
| Fig. 1 Transmission electron microscope and high-resolution transmission electron microscopic images of PCNT(D)-2 (a and b) and PCNT(S)-2 (c and d). | ||
3.2 XRD analysis
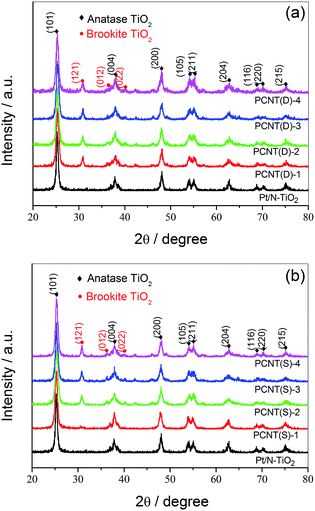
With the help of XRD measurements, the crystal phases of the samples were evaluated. Fig. 2a displayed the XRD patterns of PCNT(D). In the case of N–TiO2, all the diffraction peaks around 2θ = 25.28°, 37.80°, 48.05°, 53.89°, 55.06°, 62.69°, 68.76°, 70.31°, and 75.03° were attributed to (101), (004), (200), (105), (211), (204), (116), (220), and (215) crystal planes of anatase TiO2 (JCPDS card no. 21-1272),35,36 respectively. Different from N–TiO2, a small portion of anatase TiO2 began to transfer to brookite TiO2 when 0.002 of Co was introduced. The diffraction peaks at 30.81°, 36.25°, and 40.15°, which were in accordance with (121), (012), and (022) lattice planes of brookite TiO2, respectively, confirmed the existence of brookite.37 As shown in Fig. 2b, no brookite TiO2 was observed till the amount of Co was about 0.005 in PCNT(S) (PCNT(S)-2), which was different from that of PCNT(D). By increasing the Co content from 0.002 to 0.005, brookite was found in TiO2, indicating the co-existence of both anatase and brookite TiO2. The presence of Co3O4 probably affects the rearrangement of the atoms in TiO2 thus promoting anatase to brookite transformation during the crystal formation process. This phenomenon has also been found in other publications.38,39 It was reported that TiO2 mixture containing both anatase and brookite revealed excellent thermal stability, which might be a valuable factor for the high efficiency of photocatalytic water splitting.40 Moreover, no typical diffraction peaks assignable to Pt- and Co-based components were detected, which may be because of their low content.3.3 UV-Vis diffuse reflectance spectroscopy analysis
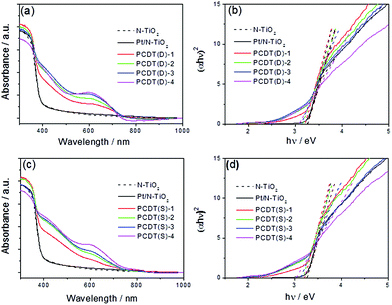
The optical properties of the samples were investigated by UV-Vis diffuse reflectance spectroscopy (DRS), and the corresponding bandgap energies (Eg) were estimated by the Kubelka–Munk plots.41 Fig. 3a shows the DRS spectra of N–TiO2, Pt/N–TiO2 and PCNT(D), from which we could observe that N–TiO2 exhibited slight visible light absorption. After loading Co3O4 to N–TiO2, the absorption of the PCNT(D) composites in visible region further increased. The composites showed prominent light absorption in the range of 400–700 nm, which was mainly attributed to the O2− → Co3+ and O2− → Co2+ transitions of loaded Co3O4 that has small band gaps.42,43 With the increase of Co content, the absorption intensity increased gradually, particularly in the region from 500 to 700 nm. The Eg values of TiO2 in Pt/N–TiO2, PCNT(D)-1, PCNT(D)-2, PCNT(D)-3, and PCNT(D)-4 were estimated to be 3.26, 3.21, 3.16, 3.13, and 3.08 eV, respectively (Fig. 3b). The samples prepared by two-step method showed similar UV-Vis absorption as that prepared by the one-step method (Fig. 3c). As shown in Fig. 3d, the Eg values of TiO2 in N–TiO2, PCNT(S)-1, PCNT(S)-2, PCNT(S)-3, and PCNT(S)-4 were 3.26, 3.21, 3.17, 3.12, and 3.02 eV, respectively. Obviously, loading Co3O4 to the composite promotes the catalyst for higher visible light absorption. This would beneficially contribute to the photo-activity of the composite under visible light irradiation. While, it should be noted that the catalyst composite with the best catalytic activity is not the one with the most visible light absorption as observed in this study for the H2 production. Similar phenomena have also been reported by other researchers.44,453.4 PL behavior
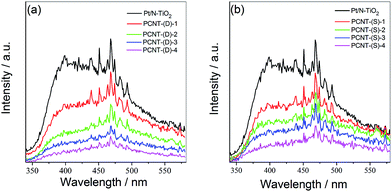
The photocatalytic activity of photocatalysts is usually closely associated with the separation and recombination behavior of the photogenerated electrons and holes.46,47 PL spectra of PCNT(D) and PCNT(S) with different amounts of Co were then measured. From Fig. 4a and b, it was obvious that the PL intensities of PCNT(D) and PCNT(S) were significantly smaller than that of Pt/N–TiO2. For the PCNT catalyst composites, the photogenerated electrons in the conduction band of N–TiO2 could transfer into the energy level of modified Co3O4, which may reduce the radiative recombination efficiency of photogenerated electrons and holes. This indicates that loading Co3O4 on the catalyst composite separates the photogenerated charge carriers effectively, which is beneficial for the photocatalytic activity.3.5 XPS analysis
XPS spectra were measured to investigate the surface chemical components and chemical states of the samples. Fig. 5 showed the XPS spectra of Pt/N–TiO2, PCNT(D)-2, and PCNT(S)-2. In Fig. 5a, the XPS survey spectra showed that Pt/N–TiO2 contained Ti, O, N, and Pt elements, whereas both PCNT(D)-2 and PCNT(S)-2 contained Ti, O, N, Pt, and Co elements due to the introduction of Co. High-resolution XPS spectra of Pt 4f and Co 2p were shown in Fig. 5b and c, respectively. The Pt 4f band of Pt/N–TiO2 and PCNT(S)-2 was divided into two Gaussian–Lorentzian peaks with binding energies at around 74.9 and 76.8 eV, respectively, corresponding to metallic (Pt0) Pt 4f7/2 and 4f5/2 states.48 The blue shifts of the Pt peaks in PCNT(D)-2 (74.4 and 75.7 eV) and PCNT(S)-2 (75.0 and 76.5 eV) were compared (Fig. 5b). This could be attributed to the interaction of Co in Co3O4 with Pt on the surface of PCNT(D)-2. As shown in Fig. 5c, Co was detected in both PCNT(D)-2 and PCNT(S)-2. The peaks of Co in PCNT(D)-2 were found at approximate 780.8 and 795.7 eV which were assignable to the binding energies of Co 2p3/2 and 2p1/2.49 While the binding energies for Co in PCNT(D)-2 were found at about 783.3 and 796.6 eV, which shifted to higher energy relative to PCNT(S)-2, suggesting the interaction between Co3O4 and Pt.50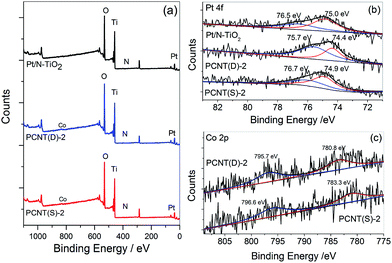 | ||
| Fig. 5 X-ray photoelectron spectra (XPS) of Pt/N–TiO2, PCNT(D)-2, and PCNT(S)-2 for survey (a), Pt 4f (b), and Co 2p (c). | ||
XPS etching was then employed to explore the existence of Co in PCNT(D)-2 and PCNT(S)-2. The Co contents on the surface and 5 nm inside PCNT(D)-2 were 2.39 and 2.01 at%, respectively. The larger content of Co on the surface than that in the interior could be ascribed to the additional loading of Co3O4 on the surface of N–TiO2. On the other hand, in the case of PCNT(S)-2, both values were essentially the same, 1.02 and 1.03 at%, respectively. The XPS etching results indicated that Co3O4 was evenly dispersed in N–TiO2 when prepared by the one-step method, but it was mainly loaded on the surface of N–TiO2 when synthesized by the two-step method.
3.6 Water splitting activity
The effects of Pt loading amount on the H2 evolution rate of CNT(D)-2 and CNT(S)-2 under UV-Vis and visible light irradiation were shown in Fig. 6. The H2 evolution rates of CNT(D)-2 and CNT(S)-2 under UV-Vis light varied with the Pt-loading amount. It was clearly shown that additional loading of Co3O4 onto appropriate amount of Pt modified N–TiO2 composite remarkably improved the photocatalytic efficiency for H2 production (Fig. 6a, Table S1†), which signifies the important contribution from the loaded Co3O4. It is interesting to note that CNT(D)-2 exhibited higher H2 evolution rates in all cases than CNT(S)-2. The maximum differences of H2 production rates were obtained with a Pt loading of 0.02 wt% in both CNT(D)-2 and CNT(S)-2, which revealed the optimal concentration of Pt loading. With Pt loading higher than 0.02 wt%, the rate of H2 evolution declined quickly at 0.2 wt%. The same trend was observed when the samples were irradiated under visible light (Fig. 6b, Table S2†). The higher catalytic activity of CNT(D)-2 than CNT(S)-2 could be attributed to the synergistic effect played by the closely contacted Pt with Co3O4 on the surface of N–TiO2.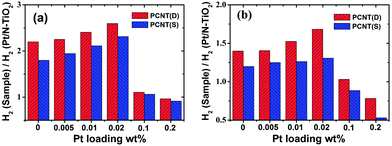 | ||
| Fig. 6 Effects of different amounts of Pt loading on H2 evolution rate of PCNT(D) and PCNT(S) under UV-Vis (a) and visible light (b) irradiation, respectively. | ||
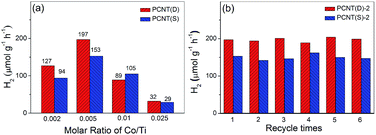
The effect of Co contents on the photocatalytic performance of PCNT(D) and PCNT(S) was then investigated. Fig. 7a showed the H2 evolution rate of PCNT(D) and PCNT(S) with different Co contents under visible light irradiation (λ > 400 nm). It was clear that the H2 evolution rate of PCNT(D) increased with the increase in Co contents from 0.002 to 0.005 and then decreased with further increase in Co content to 0.025. The H2 evolution rate achieved a maximum value of 197 μmol g−1 h−1 at 0.005 content, suggesting optimal Co content. In addition, it was noteworthy that when Co content increased to 0.025, the H2 evolution rate rapidly decreased to 32 μmol g−1 h−1. The extremely low H2 production was probably due to the formation of vast crystal defects, which greatly promoted the recombination of photoelectrons and holes. A similar trend was observed in PCNT(S) samples with different Co contents, in which Co content at 0.005 showed the highest H2 evolution (Fig. 7a, Table S3†). The stability of the photocatalysts was investigated by a six-run recycling experiment of H2 evolution under similar conditions. PCNT(D) showed higher photocatalytic activities as compared to PCNT(S). As shown in Fig. 7b, after six-run cycles, H2 evolution, catalyzed by PCNT(D) and PCNT(S), mainly remained as high as the initial, suggesting the excellent stabilities of both PCNT(D) and PCNT(S).
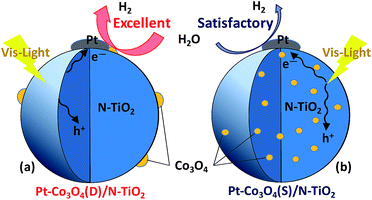
Taken all the experimental results together, it can be concluded that loading of Co3O4 on Pt/N–TiO2 composite significantly promotes the PCNT catalysts photocatalytic activity, and PCNT(D) showed much higher H2 evolution rates than PCNT(S) composites under the same Pt-loading content. This indicates that the existing state of Co3O4 in the composites played a crucial role in the photocatalytic performance of the catalyst. XPS spectra and TEM images of the composites showed the distribution of Co3O4 in PCNT(D) and PCNT(S), where Co3O4 was located on the surface of N–TiO2 in PCNT(D) (Fig. 8a) and was evenly dispersed in N–TiO2 in the case of PCNT(S) (Fig. 8b). For the PCNT(D) composites (Fig. 8a), visible light irradiation of N–TiO2 produces photogenerated electrons and holes; the generated electrons are then captured by the closely contacted Pt/Co3O4 particles on which water splits to produce hydrogen, and the holes were consumed by reacting with the sacrificial donor reagent. In the case of PCNT(S) composites, Co3O4 and Pt were located separately on the surface of N–TiO2 lacking of direct interaction (Fig. 8b), in which charge separation efficiency would be lower than that in the PCNT(D) composites when photo-irradiated. Accordingly, when appropriate amounts of Co3O4 and Pt were loaded onto the surface of N–TiO2 nanoparticles, the close interaction between Co3O4 and Pt may provide more effective electric transmission, showing synergistic effect for promoting the separation of photogenerated electrons and holes and thus boosting the photocatalytic activity.
4 Conclusions
The visible light responsive photocatalysts PCNT(S) and PCNT(D) were synthesized successfully by one-step and two-step methods, respectively. Compared with the Pt@N–TiO2 catalyst, Co3O4-modified composites show significant improvements in the photocatalytic performance for H2 production with very low loading of Pt (0.02 wt%). Catalyst composites prepared by the two-step method showed higher photocatalytic activity for H2 production than that prepared by the one-step method. The two-step method led to close interaction between the loaded Co3O4 and Pt on the N–TiO2 nanoparticles, whereas the one-step method produced composites with Co3O4 evenly dispersed in N–TiO2. The methods of preparation and thus the co-catalyst distribution in TiO2 have a strong influence on the catalytic properties of the prepared composites. The results obtained may have implications for further development of high-performance catalysts for photocatalytic H2 production.Acknowledgements
This study was financially supported by the NSF of China (no. 21271072, 21571062 to JGL; 21571063 to SCC), the Program for Professor of Special Appointment (Eastern Scholar) at Shanghai Institutions of Higher Learning to JGL, and the Fundamental Research Funds for the Central Universities (no. 222201717003).Notes and references
- M. Y. Liu, W. Zhou, T. Wang, D. F. Wang, L. Q. Liu and J. H. Ye, Chem. Commun., 2016, 52, 4694–4697 RSC.
- D. F. Su, J. Wang, H. Y. Jin, Y. T. Gong, M. M. Li, Z. F. Pang and Y. Wang, J. Mater. Chem. A, 2015, 3, 11756–11761 CAS.
- M. Z. Ge, C. Y. Cao, S. H. Li, Y. X. Tang, L. N. Wang, N. Qi, J. Y. Huang, K. Q. Zhang, S. S. Al-Deyabe and Y. K. Lai, Nanoscale, 2016, 8, 5226–5234 RSC.
- R. Liu, Z. Zheng, J. Spurgeon and X. G. Yang, Energy Environ. Sci., 2014, 7, 2504–2517 CAS.
- M. N. Ha, F. Zhu, Z. F. Liu, L. C. Wang, L. Y. Liu, G. Z. Lu and Z. Zhao, RSC Adv., 2016, 6, 21111–21118 RSC.
- P. A. Bharad, K. Sivaranjani and C. S. Gopinath, Nanoscale, 2015, 7, 11206–11215 RSC.
- C. Marchal, M. Behr, F. Vigneron, V. Caps and V. Keller, New J. Chem., 2016, 40, 4428–4435 RSC.
- A. Iwase, S. Yoshino, T. Takayama, Y. H. Ng, R. Amal and A. Kudo, J. Am. Chem. Soc., 2016, 138, 10260–10264 CrossRef CAS PubMed.
- A. Fujishima and K. Honda, Nature, 1972, 238, 37–38 CrossRef CAS PubMed.
- W. Zhou, W. Li, J. Q. Wang, Y. Qu, Y. Yang, Y. Xie, K. F. Zhang, L. Wang, H. G. Fu and D. Y. Zhao, J. Am. Chem. Soc., 2014, 136, 9280–9283 CrossRef CAS PubMed.
- S. Pany and K. M. Parida, Phys. Chem. Chem. Phys., 2015, 17, 8070–8077 RSC.
- J. Fang, L. Xu, Z. Y. Zhang, Y. P. Yuan, S. W. Cao, Z. Wang, L. S. Yin, Y. S. Liao and C. Xue, ACS Appl. Mater. Interfaces, 2013, 5, 8088–8092 CAS.
- X. F. Zhang, B. Y. Zhang, Z. X. Zuo, M. K. Wang and Y. Shen, J. Mater. Chem. A, 2015, 3, 10020–10025 CAS.
- X.-Y. Liu, W.-D. Wei, S.-C. Cui and J.-G. Liu, Catal. Lett., 2016, 146, 1655–1662 CrossRef CAS.
- W. Q. Fang, Z. Y. Huo, P. R. Liu, X. L. Wang, M. Zhang, Y. Jia, H. M. Zhang, H. J. Zhao, H. G. Yang and X. D. Yao, Chem.–Eur. J., 2014, 20, 11439–11444 CrossRef CAS PubMed.
- W. Wang, Y. Liu, J. F. Qu, Y. B. Chen and Z. P. Shao, RSC Adv., 2016, 6, 40923–40931 RSC.
- T. Wang, X. Q. Yan, S. S. Zhao, B. Lin, C. Xue, G. D. Yang, S. J. Ding, B. L. Yang, C. S. Ma, G. Yang and G. R. Yang, J. Mater. Chem. A, 2014, 2, 15611–15619 CAS.
- N. Liu, C. Schneider, D. Freitag, U. Venkatesan, V. R. R. Marthala, M. Hartmann, B. Winter, E. Spiecker, A. Osvet, E. M. Zolnhofer, K. Meyer, T. Nakajima, X. M. Zhou and P. Schmuki, Angew. Chem., 2014, 126, 14425–14429 CrossRef.
- N. Liu, V. Häublein, X. M. Zhou, U. Venkatesan, M. Hartmann, M. Mačković, T. Nakajima, E. Spiecker, A. Osvet, L. Frey and P. Schmuki, Nano Lett., 2015, 15, 6815–6820 CrossRef CAS PubMed.
- R. Reichert, Z. Jusys and R. J. Behm, J. Phys. Chem. C, 2015, 119, 24750–24759 CAS.
- A. A. Melvin, K. Illath, T. Das, T. Raja, S. Bhattacharyya and C. S. Gopinath, Nanoscale, 2015, 7, 13477–13488 RSC.
- R. Kobayashi, S. Tanigawa, T. Takashima, B. Ohtani and H. Irie, J. Phys. Chem. C, 2014, 118, 22450–22456 CAS.
- F. L. Wang, Y. J. Jiang, D. J. Lawes, G. E. Ball, C. F. Zhou, Z. W. Liu and R. Amal, ACS Catal., 2015, 5, 3924–3931 CrossRef CAS.
- T. Ikeda, A. Xiong, T. Yoshinaga, K. Maeda, K. Domen and T. Teranishi, J. Phys. Chem. C, 2013, 117, 2467–2473 CAS.
- B. Banerjee, V. Amoli, A. Maurya, A. K. Sinha and A. Bhaumik, Nanoscale, 2015, 7, 10504–10512 RSC.
- P. Chowdhury, G. Malekshoar, M. B. Ray, J. Zhu and A. K. Ray, Ind. Eng. Chem. Res., 2013, 52, 5023–5029 CrossRef CAS.
- C. L. Muhich, Y. Zhou, A. M. Holder, A. W. Weimer and C. B. Musgrave, J. Phys. Chem. C, 2012, 116, 10138–10149 CAS.
- J. G. Yu, L. F. Qi and M. Jaroniec, J. Phys. Chem. C, 2010, 114, 13118–13125 CAS.
- G. J. Ai, R. Mo, H. X. Li and J. X. Zhong, Nanoscale, 2015, 7, 6722–6728 RSC.
- A. Meng, J. Zhang, D. Xu, B. Cheng and J. Yu, Appl. Catal., B, 2016, 198, 286–294 CrossRef CAS.
- S. Bala, I. Mondal, A. Goswami, U. Pal and R. Mondal, J. Mater. Chem. A, 2015, 3, 20288–20296 CAS.
- T. Wang, X. G. Meng, G. G. Liu, K. Chang, P. Li, Q. Kang, L. Q. Liu, M. Li, S. X. Ouyang and J. H. Ye, J. Mater. Chem. A, 2015, 3, 9491–9501 CAS.
- S. M. Y. M. Mukthar Ali and K. Y. Sandhya, RSC Adv., 2016, 6, 60522–60529 RSC.
- A. Y. Yermakov, G. S. Zakharova, M. A. Uimin, M. V. Kuznetsov, L. S. Molochnikov, S. F. Konev, A. S. Konev, A. S. Minin, V. V. Mesilov, V. R. Galakhov, A. S. Volegov, A. V. Korolyov, A. F. Gubkin, A. M. Murzakayev, A. D. Svyazhin and K. V. Melanin, J. Phys. Chem. C, 2016, 120, 28857–28866 CAS.
- R. Tang, Z. R. Xie, S. J. Zhou, Y. N. Zhang, Z. M. Yuan, L. Y. Zhang and L. W. Yin, ACS Appl. Mater. Interfaces, 2016, 8, 22201–22212 CAS.
- Y. J. Li, H. R. Yang, J. Tian, X. L. Hu and H. Z. Cui, RSC Adv., 2017, 7, 11503–11509 RSC.
- A. Zielinska-Jurek, I. Wysocka, M. Janczarek, W. Stampor and J. Hupka, Sep. Sci. Technol., 2015, 156, 369–378 CAS.
- C. Zhao, X. Shu, D. Zhu, S. Wei, Y. Wang, M. Tu and W. Gao, Superlattices Microstruct., 2015, 88, 32–42 CrossRef CAS.
- R. Jaiswal, N. Patel, A. Dashora, R. Fernandes, M. Yadav, R. Edla, R. S. Varma, D. C. Kothari, B. L. Ahuja and A. Miotello, Appl. Catal., B, 2016, 183, 242–253 CrossRef CAS.
- C. Perego, Y. H. Wang, O. Durupthy, S. Cassaignon, R. Revel and J. P. Jolivet, ACS Appl. Mater. Interfaces, 2012, 4, 752–760 CAS.
- L. Zhang, X. H. Huang, J. S. Hu, J. Song and I. Kim, Langmuir, 2017, 33, 1867–1871 CrossRef CAS PubMed.
- G. Dai, S. Liua, Y. Liang and T. Luo, Appl. Surf. Sci., 2013, 264, 157–161 CrossRef CAS.
- T. Wang, X. Meng, G. Liu, K. Chang, P. Li, Q. Kang, L. Liu, M. Li, S. Ouyang and J. Ye, J. Mater. Chem. A, 2015, 3, 9491–9501 CAS.
- S. Huang, Y. Yu, Y. Yan, J. Yuan, S. Yin and Y. Cao, RSC Adv., 2016, 6, 29950–29957 RSC.
- S. G. Babu, R. Vinoth, D. P. Kumar, M. V. Shankar, H.-L. Chou, K. Vinodgopal and B. Neppolian, Nanoscale, 2015, 7, 7849–7857 RSC.
- J. J. Wu, S. L. Lu, D. H. Ge, L. Z. Zhang, W. Chen and H. W. Gu, RSC Adv., 2016, 6, 67502–67508 RSC.
- P.-P. Sun, L. Liu, S.-C. Cui and J.-G. Liu, Catal. Lett., 2014, 144, 2107–2113 CrossRef CAS.
- Y. Chang, C. H. Yuan, Y. T. Li, C. Liu, T. Wu, B. Zeng, Y. T. Xu and L. Z. Dai, J. Mater. Chem. A, 2017, 5, 1672–1678 CAS.
- B. Huang, W. J. Yang, Y. W. Wen, B. Shan and R. Chen, ACS Appl. Mater. Interfaces, 2015, 7, 422–431 CAS.
- D. B. Hamal and K. J. Klabunde, J. Phys. Chem. C, 2011, 115, 17359–17367 CAS.
Footnote |
| † Electronic supplementary information (ESI) available: TEM images of other samples, data of photocatalytic water splitting, and BET of surface areas of all samples. See DOI: 10.1039/c7ra03216a |
| This journal is © The Royal Society of Chemistry 2017 |

