DOI:
10.1039/C7RA03418K
(Paper)
RSC Adv., 2017,
7, 24430-24437
Effective removal of glyphosate from water by resin-supported double valent nano-sized hydroxyl iron oxide
Received
23rd March 2017
, Accepted 17th April 2017
First published on 4th May 2017
Abstract
The double valent composite resin (DR) was prepared within nano-sized Fe(II) and Fe(III) hydroxyl oxide crosslinking polystyrene anion exchanger resin for efficient glyphosate removal from water. The structure, morphology, Fe species, crystal phase, and elemental composition of the prepared DR composites were characterized using scanning electron microscopy (SEM), transmission electron microscopy (TEM), X-ray diffraction (XRD) and X-ray photoelectron spectroscopy (XPS). The effects of contact time, pH, temperature, coexisting anions and regeneration were studied in batch mode. It was found that a low pH value favors the adsorption of glyphosate, and the adsorption kinetics were well fitted by a pseudo-second-order model. The exhausted DR composites could be regenerated by NaOH solution for repeated use without any significant capacity loss, where the adsorbed glyphosate was effectively desorbed into the solution. Fixed-bed adsorption further validated that DR composites would be of considerable potential in the removal of glyphosate from contaminated waters.
1. Introduction
Glyphosate (N-(phosphonomethyl)glycine, CAS registry no. 1071-83-6) is a highly effective post-emergence, broad-spectrum and non-selective herbicide that has been widely applied in agriculture.1,2 However, the discharge of large volumes of water during glyphosate manufacturing, using and recycling brings a serious threat to the environment and human health. Glyphosate is a relatively persistent compound and has been found in food, animals, plants, rivers, wastewater, soil, source water and aquatic sediment.3–5 Numerous studies have suggested that glyphosate induces disruption of intelligence and reproductive and nervous systems.6,7 Glyphosate has been classified as probably carcinogenic to humans (group 2A) by the International Agency for Research on Cancer (IARC) of the World Health Organization (WHO) because there is convincing evidence that it can cause cancer in laboratory animals.8
Various processes were developed to treat the glyphosate-containing effluents including advanced oxidation,9,10 chlorination,11 filtration,12 biodegradation13,14 and adsorption.15–17 Among these, adsorption is still the most versatile and widely used method as it can remove various types of pollutants. Adsorption technology is convenient and is proven to be one of the most attractive and effective techniques for purification and separation in wastewater treatment.18–21
There are some studies that deal with the removal of glyphosate in water using adsorption technology. In these studies, several adsorbents include inorganic materials as well as organic materials that have been used and shown to have efficient processes for removing glyphosates.22–25 Due to unique surface chemistry and porous structure, resins exhibit strong adsorption affinity to glyphosates in aqueous solutions. However, their application in wastewater treatment is limited mainly because of the low selectivity when a quantity of inorganic salt exists with glyphosate. Thus, novel adsorbents with high adsorption selectivity are increasingly needed for enrichment or recycling of glyphosate and treatment of wastewater.
It is also well-known that the hydrous ferric oxides may form inner-sphere surface complexes with the phosphonate group of glyphosate.22,26 It is thus thought that nanoiron ion modification to resin can offer significant enhancement of the high specific surface area, short intraparticle diffusion distance and surface chemistry. Therefore, the combination of nanoiron ions and resin may provide excellent selectivity for the treatment of glyphosates.
In this study, a new resin-loaded reactive double valent nanosized hydroxyl iron oxide (DHIO) was synthesized via a reaction, followed by the introduction of iron ions by protonation of amine groups on the surface of weakly basic resin (WR). The double valent hydroxyl iron oxide composite resin (DR) obtained was characterized by a series of analytical techniques. The novel synthetic double valent iron composite resin possesses high selectivity and efficiency for the removal of glyphosates.
2. Materials and methods
2.1. Chemicals and materials
Glyphosate (purity 98%, CAS registry no. 1071-83-6) was purchased from Qiaochang Chemistry Co. Ltd. (Shandong Province, China). Chemicals used in this study were of analytical reagent grade and purchased from Shanghai Reagent Station (Shanghai, China). WR was from Nankai Resin Co. Ltd. (Tianjin, China) and was subjected to washing with diluted NaOH and HCl in a beaker to remove possible residue impurities. Then, they were rinsed with deionized water several times and vacuum-dried at 303 K. All solutions and dispersions were prepared using deionized water.
2.2 Preparation of adsorbents
The DR composites were synthesized as follows: (i) 3 g of weakly basic resins were dispersed in 100 mL ethanol in a glass beaker and soaked for about 8 h; (ii) then, the resins were added into a mixed salt solution, followed by continuous agitation for 24 h with a thermostat and shaken at 120 rpm at 298 K. The mixed salt solution was prepared with 0.05–0.1 M FeCl2, 0.2 M FeCl3, 1 M NaCl, 2 M HCl and deionized water. (iii) The Fe2+/3+ loaded resins were filtered out and quickly placed in 2 M NaOH solution at 298 K. (iv) The obtained composites were washed with ethanol until no floc appeared, washed with distilled water until the pH was neutral, and then dried in a vacuum oven at 303 K for 24 h to obtain the DR composites. The content of Fe loading was controlled by adjusting the concentration of ferric dichloride and ferric trichloride, and the Fe content (wt%) of the composites was analyzed by acid washing. Next, 0.1 g of DR composites was dispersed in 50 mL 5 M HCl in a glass beaker and shaken for about 48 h. Then, the solution was filtered and analyzed using an atomic absorption spectrophotometer (Thermo). Correspondingly, the three synthesized hybrid adsorbents that had different Fe content were denoted as DR-a, DR-b and DR-c.
2.3 Characterization of the resins
SEM was used to study the morphology of the synthesized DR on an S-4800 N scanning electron microscope (Hitachi). The morphology and size of the nanoparticles of DR composites were characterized with TEM (JEM-1011, JEOL, Japan). XRD was performed to determine the crystalline structure of the hydroxyl iron oxide of DR on a Bruker D8-Advance diffractometer using Cu Kα radiation. The BET surface area, pore volume, and pore diameter distribution of the resins were determined by N2 adsorption–desorption isotherms using a Micromeritics Tristar 3000 surface area and porosity analyzer. XPS in C (1s) and O (1s) spectral regions were obtained with a VG ESCALAB 220i-XL spectrometer, using a non-monochromatized Al Kα X-ray source (1486.6 eV). The vacuum in the analysis chamber was at a pressure of 4 × 10⁻⁹ mbar. The survey scan spectra were collected with a pass energy of 50 eV, whereas the high-energy resolution spectra were obtained with a pass energy of 25 eV. The deconvolution of peaks was carried out by adjusting Gaussian functions.
The glyphosate concentrations in samples were determined by high-performance liquid chromatography (HPLC, Waters 2695, Waters Corporation, USA), and separation was performed using a strong anion exchange (SAX) column (250 mm × 4.6 mm internal diameter, particle size 5.5 mm; Elite, Dalian, China). The mobile phase was methanol-water (15/85, v/v) containing 0.5% KH2PO4 as a pH regulator. The mobile-phase flow rate was 0.8 cm3 min−1, and the detector wavelength was 195 nm. Under these conditions, the retention time for glyphosate was 7.0 minutes.
2.4 Batch adsorption
Batch experiments were employed to evaluate glyphosate adsorption characteristics and mechanism on DR composites. Typically, all glyphosate experimental samples were prepared at preselected concentrations, and the desired pH of the suspensions in each flask was adjusted by 0.1 M HCl or NaOH solution. The flasks were transferred into an incubator and shaken at 120 rpm. Immediately after the suspensions were shaken for 24 h to achieve adsorption equilibrium, the sample was separated from the solution using 0.45 μm membrane filters, and the concentration of glyphosate in the filtrate was analyzed using HPLC. Glyphosate adsorption kinetics on DR composites was performed with 0.1 g of adsorbents added into a series of flasks containing 100 mL of 400 mg L−1 glyphosate solution and strongly shaken in the oscillator at 303 K. During the adsorption process, a sample was withdrawn from one flask at a certain time interval. The adsorption capacity q (mg g−1) amount of glyphosate adsorbed on the resin was calculated as follows:| |
 | (1) |
where C0 and Ce are the initial and residual concentrations (mg L−1) of glyphosate in solution, respectively, and V and W are the test solution volume (L) and mass (g) of adsorbent used for the test, respectively. All adsorption experiments were performed in duplicate, and the relative errors were 1.5% ± 0.5%.
2.5 Fixed-bed adsorption and recycling test
Fixed-bed column experiments were conducted in a glass column (12 mm in diameter and 230 mm in length) equipped with a water bath to maintain a constant temperature. The adsorbent was placed in separate glass columns, and the bed height was 9 cm. Then, the solution of 200 mg L−1 glyphosate was percolated through each of the columns, and the effluent from each column was collected at an interval of 20 min and kept for glyphosate analysis. A speed-adjustable peristaltic pump (BT-200F, Shanghai Qite Analysis Instrument Co., Ltd., China) was used to control the flow rate. The effluent samples were collected with an automatic collection (BSZ-40-LCD, Shanghai Qite Analysis Instrument Co., Ltd., China) and analyzed with a UV/vis spectrometer.
3. Results and discussion
3.1 Characterization of adsorbents
The SEM and TEM images of DR composites are shown in Fig. 1. Fig. 1 indicates that hydroxyl iron oxide (HIO) particles were loaded as nanoparticles or nanorods on WR, and HIO nanoparticles were abundant and well distributed throughout the resin. TEM images of DR composites showed that the size of nanoparticles on the surface of DR composites was about 100 nm. When nano-sized hydroxyl iron oxide particles were supported onto WR, numerous HIO particles were clearly observed on the surface of the resin, and the surface roughness was significantly improved. The resin loaded nanosized HIO particles are expected to display higher adsorption activity.
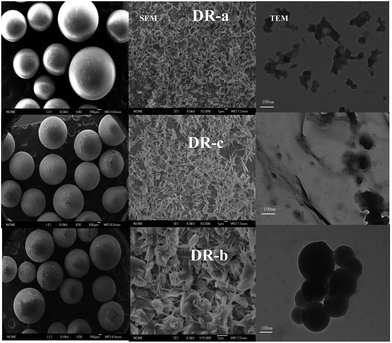 |
| | Fig. 1 Scanning electron microscopy and transmission electron microscopy images of DR-a, DR-b and DR-c. | |
The major properties of DR composites are characterized, and the results are summarized in Table 1. According to BET method, the specific surface areas of WR, DR-a, DR-b and DR-c were 32.32, 31.19, 25.26 and 24.23 m2 g−1, respectively. The nano-sized hydroxyl iron oxide modification of resin further reduced the surface areas of the resin to 3.49%, 21.84% and 25.03%, respectively. This reaction could arise from the pore blocked by loaded nano-sized hydroxyl iron oxide molecules. The double valent nano-sized hydroxyl iron oxides had a small molecular size and thus, could easily access the pore of the resin.
Table 1 Physical characteristics of adsorbents
| Adsorbent |
Functional group |
BET specific surface area (m2 g−1) |
Total pore volume (cm3 g−1) |
Fe content (wt%) |
| WR |
–N+(CH3)2 |
32.32 |
0.212 |
0 |
| DR-a |
–N+(CH3)2 |
31.19 |
0.187 |
4.1 |
| 0.1 M FeCl2 + 0.2 M FeCl3 |
Fe(OH)2 |
| Fe(OH)3 |
| DR-b |
–N+(CH3)2 |
25.26 |
0.180 |
3.8 |
| 0.08 M FeCl2 + 0.2 M FeCl3 |
Fe(OH)2 |
| Fe(OH)3 |
| DR-c |
–N+(CH3)2 |
24.23 |
0.133 |
3.4 |
| 0.05 M FeCl2 + 0.2 M FeCl3 |
Fe(OH)2 |
| Fe(OH)3 |
The XRD patterns of WR, DR-a, DR-b and DR-c are shown in Fig. 2. DR-a, DR-b and DR-c showed characteristic peaks (2θ) at 31.9° and 45.6° corresponding to γ-FeO(OH) and cubic α-FeO 110, respectively. It also indicated that for DR-a, DR-b and DR-c, the small peak observed at 35.2° was Fe3O4.27 Diffraction peaks of Fe-oxide were found in the XRD pattern of DR-a, DR-b and DR-c, suggesting that its major surface species are FeO(OH) and Fe3O4.
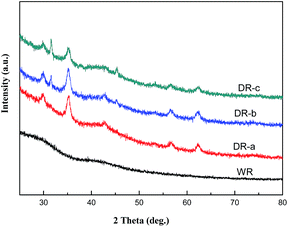 |
| | Fig. 2 XRD patterns of WR, DR-a, DR-b and DR-c. | |
The surface elemental composition of the DR-a is determined by X-ray photoelectron spectroscopy (XPS). A comparison of the XPS wide scan spectrum of DR-a is given in Fig. 3. It shows that the spectrum of the DR-a had five peaks (Cl 2p, C 1s, N 1s, O 1s, Fe 2p) in the wide-scan spectrum. The peak at 711.3 eV refers to Fe 2p3/2 of [Fe(Cl)4]− in the Fe 2p spectrum (Fig. 4). The peaks for Fe 2p1/2 and Fe 2p3/2 appeared at 721.2 and 711.3 eV, indicating the formation of Fe–O.28 According to the XPS data, the hydroxyl iron oxide particles caused an important incorporation of tertiary ammonium (–N(CH3)2) functional groups on the most external resin surface. The percentage of hydroxyl iron oxide groups in DR-a determined by XPS analysis meant that most of the hydroxyl iron oxide groups had been fixed in the external surface of the resins.
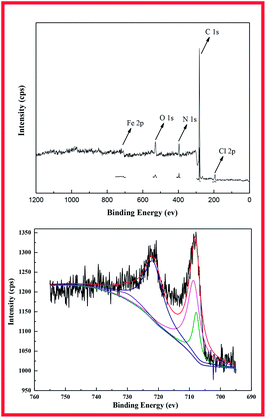 |
| | Fig. 3 Fe 2p XPS spectra of DR-a. | |
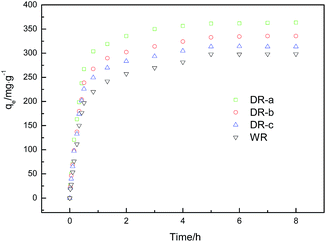 |
| | Fig. 4 Effect of time on the adsorption of glyphosate onto WR, DR-a, DR-b and DR-c (initial glyphosate concentration, 400 mg L−1; agitation speed, 120 rpm; and adsorbent dose, 100 mg (100 mL)−1). | |
3.2. Adsorption kinetics
Adsorption kinetic data of glyphosate on DR composites in contact times ranging from 1 h to 8 h are presented in Fig. 4. The results showed that the adsorption capacity of glyphosate on WR and DR increases rapidly with increased adsorption time. Compared with WR, the adsorption capacity of the DR-a, DR-b and DR-c increased by 21.84%, 12.47% and 5.19%, respectively, and the adsorption reached over 90% of the equilibrium in 2 h, suggesting that the adsorption was a fast process. The equilibrium tended to be established after approximately 5 h of shaking. Moreover, it can be seen that the DR-a had the highest capacity at 303 K in glyphosate adsorption, followed by DR-b and DR-c.
To demonstrate the adsorption process of glyphosate on DR composites, a kinetic investigation is carried out with the pseudo-first-order (2) and pseudo-second-order (3) kinetic models.29,30
| |
 | (2) |
| |
 | (3) |
where
k1 and
k2 represent the pseudo-first-order rate constant (h
−1) and the pseudo-second-order rate constant (g mg
−1 h
−1), respectively, and
t means time (h).
qe and
qt are the adsorption capacity (mg g
−1) at equilibrium time and time
t, respectively.
Table 2 summarizes the corresponding kinetic parameters for the adsorption of glyphosate at different initial temperatures by DR composites. Based on the correlation coefficient (R2) of each kinetic model, the pseudo-second-order model clearly fitted the experimental kinetic data. Therefore, adsorption of glyphosate on DR composites perfectly fit the pseudo-second-order model rather than the pseudo-first-order model. The pseudo-second-order model assumed that the determining rate step may be chemisorption promoted by covalent forces through the electrons sharing between adsorbent and adsorbate, suggesting that the adsorption of glyphosate on DR composites was mainly the chemical reactive adsorption.31,32 The values of qe for DR-a, DR-b and DR-c were 384.62, 357.14 and 333.33 mg g−1, respectively, indicating an adsorption capacity for glyphosate in the order DR-a > DR-b > DR-c. The calculated qe values resulting from the pseudo-second-order kinetic model were very close to the experimental data.
Table 2 Parameters for glyphosate adsorption by DR according to different kinetic models
| Kinetic parameters |
DR-a |
DR-b |
DR-c |
| Pseudo-first-order |
k1/(h−1) |
0.919 |
0.870 |
1.167 |
| R2 |
0.9769 |
0.9498 |
0.8937 |
| Pseudo-second-order |
qe (mg g−1) |
384.62 |
357.14 |
333.33 |
| k2/(g mg−1 h−1) |
0.0085 |
0.0087 |
0.0090 |
| R2 |
0.9994 |
0.9996 |
0.9996 |
3.3 Effect of pH
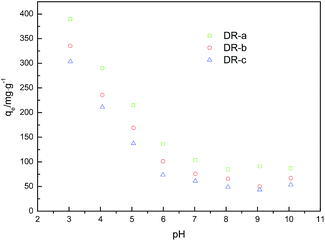
The effect of solution pH on DR composite adsorption to glyphosate is studied, and the results are shown in Fig. 5. It was found that the adsorption capacity was evidently dependent on solution pH. This effect may be explained by taking into account the change of adsorbate species and absorbent surface at different pH values. According to the reported pKa1 (2.20), pKa2 (5.46) and pKa3 (10.14) of glyphosate in aqueous solution,33 the species distributions of glyphosate, monoanion of glyphosate (H2L−), dianion of glyphosate (HL2−) and trianion of glyphosate (L3−) in aqueous solution were predicted as a function of the solution pH. There were different ionic forms of iron (oxy-hydr)oxides varying with the pH of the solution. The Fe–OH groups on the surface of hybrid adsorbents attained negative or positive charge by dissociation or association of protons. Protonation and deprotonation reactions of Fe–OH groups can be written as follows:34| |
![[triple bond, length as m-dash]](https://www.rsc.org/images/entities/char_e002.gif) FeOH + H+ ↔ FeOH2+, pH < pHPZC FeOH + H+ ↔ FeOH2+, pH < pHPZC
| (4) |
| |
![[triple bond, length as m-dash]](https://www.rsc.org/images/entities/char_e002.gif) FeOH ↔ FeO− + H+, pH > pHPZC FeOH ↔ FeO− + H+, pH > pHPZC
| (5) |
| |
![[triple bond, length as m-dash]](https://www.rsc.org/images/entities/char_e002.gif) FeOH + OH− ↔ FeO− + H2O, pH > pHPZC FeOH + OH− ↔ FeO− + H2O, pH > pHPZC
| (6) |
 |
| | Fig. 5 Effect of initial solution pH on adsorption capacity of glyphosate on DR composites. | |
At low pHs, the predominant ionic forms of iron species were Fe2+, FeOH+ and FeOH2+.35 Moreover, the predominant glyphosate species were H3L (pH = 0–2) and H2L− (pH = 3–5.5) at low pHs.33 Considering that the pHPZC values of Fe(II) and Fe(III) complexes of glyphosate were about 6.0–6.5,36,37 electrostatic attractions would occur between negative charged glyphosate species and positive charged surface sites of adsorbent at pH from 3 to 7, and the DR composites would have a high adsorption capacity to glyphosate. Moreover, we noted that the adsorption process was intensively affected by the amino groups on the surface of DR composites. At lower pH, amino groups of DR were gradually protonated, which was favorable for the adsorption of glyphosate anion. Glyphosate adsorption decreased with increasing pH, which was likely due to the decrease in the positive charge of the DR composites and decline in the adsorption capacity to the negatively charged glyphosate species.
3.4 Adsorption isotherm
Adsorption isotherm expressed the relationship between the mass of glyphosate adsorbed at constant temperature per unit mass of the adsorbent and the liquid phase glyphosate concentration. To quantify the adsorption capacity of DR composites for glyphosate adsorption, two-parameter equations, namely Langmuir (eqn (7)) and Freundlich (eqn (8)), have been adopted in this study.38,39| |
 | (7) |
where Ce (mg L−1) is the equilibrium liquid phase concentration, qmax (mg g−1) is a constant related to the area occupied by a monolayer of adsorbate, which reflects the maximum adsorption capacity, and b is a constant (L mg−1).| |
 | (8) |
where k is the Freundlich adsorption affinity coefficient, and n is indicative of the homogeneity of the adsorbent.
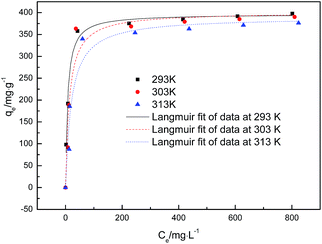
Fig. 6 shows the glyphosate adsorption isotherms at 293, 303 and 313 K. The results indicated that the qe values increased quickly when the glyphosate concentration increased from 0 to 400 mg L−1. The quantity of glyphosate adsorbed slightly decreased as the temperature increased. The isotherm parameters are given in Table 3. The adsorption capacities calculated by the Langmuir model were close to those obtained experimentally. The better fit with the experimental data was obtained using the Langmuir model, indicating a monolayer adsorption process of glyphosate onto DR-a.
 |
| | Fig. 6 Adsorption isotherms of glyphosate on DR-a at 293 K, 303 K and 313 K. | |
Table 3 Parameters for glyphosate adsorption by DR-a according to different isotherm models
| Isotherm |
Parameters |
293 K |
303 K |
313 K |
| Langmuir |
qmax/mg g−1 |
396.78 |
401.12 |
389.85 |
| b |
0.1363 |
0.0737 |
0.0484 |
| R2 |
0.9816 |
0.9378 |
0.9475 |
| Freundlich |
k |
148.60 |
134.05 |
111.53 |
| n |
6.3408 |
5.8761 |
5.1973 |
| R2 |
0.9018 |
0.8228 |
0.8489 |
3.5 Effect of competing anions
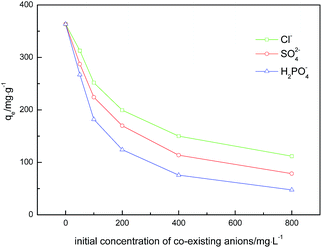
It is important to investigate the possible competitive effects of the competing anions on the adsorption of glyphosate because the natural and industrial effluents rarely contain only one type of anion. The effects of three common anions including Cl−, SO42− and H2PO4− are investigated for the three DR composites. As shown in Fig. 7, a clear decline in the glyphosate adsorption capacity of all DR composites was observed with the increase of the three competing anions from 0 to 800 mg L−1. In the presence of Cl−, SO42− and H2PO4−, the uptake capacity of glyphosate on DR-a decreased to 111.77, 78.33 and 37.37 mg g−1, respectively. From this point, the presence of H2PO4− might have a serious influence on glyphosate adsorption on DR-a, followed by SO42−, and finally Cl−, indicating that the order of anion influence of the adsorption amount of glyphosate on DR-a was H2PO4− > SO42− > Cl−. The decline was due to the fact that competing anions greatly occupied adsorption sites and electrostatic effects due to the change in charge of the solid upon adsorption.40,41 The anions of higher valence adsorbed on the surface of adsorbents might produce a stronger interfering effect because of the electrostatic effects.42,43 Phosphate could be adsorbed onto iron (oxy)hydroxides through the formation of innersphere complexes with the hydroxyl groups.44 In contrast, Cl− and SO42−could only form an outersphere complex with iron (oxy)hydroxides.45 The adsorption of glyphosate mainly relied on the innersphere complexation with the FeOOH nanoparticles.
 |
| | Fig. 7 Effect of competing anions on the adsorption of glyphosate by DR-a at 303 K and initial glyphosate at 400 mg L−1. | |
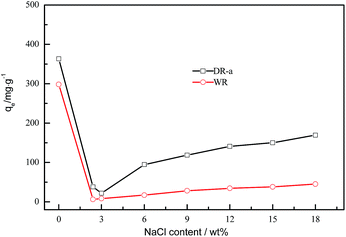
NaCl (about 10–20 wt%) exists in the mother liquor of glyphosate.46 Therefore, NaCl is used to evaluate the salinity resistance of the DR-a. The adsorption capacities of glyphosate onto WR and DR-a in the presence of NaCl are shown in Fig. 8. As shown in Fig. 8, with the content of NaCl increasing, the capacity of glyphosate onto DR-a and WR increased gradually. With 18 wt% NaCl coexisting, the adsorption capacity of DR-a to glyphosate increased 174.55% than that of WR. DR-a exhibits excellent salinity resistance.
 |
| | Fig. 8 Effect of NaCl on the adsorption of glyphosate onto WR and DR-a at 303 K and initial glyphosate at 400 mg L−1. | |
3.6 Desorption
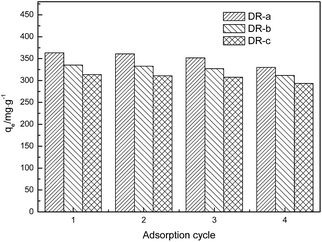
Regeneration of the adsorbent is a crucial factor with regard to the practical application. Desorption of glyphosate from the DR composites had been done with 5% NaOH solution. Fig. 9 shows the regeneration efficiency of DR composites after four adsorption desorption cycles. The regeneration efficiency R can be calculated using eqn (9).| |
 | (9) |
where qei and qe1 (mg g−1) are the adsorption capacity of regenerated adsorbent and the original adsorption capacity of virgin adsorbent, respectively. The regeneration results after adsorption suggested that adsorption efficiency was affected by regeneration. After the first cycle of regeneration, the adsorption capacity of the DR-a, DR-b and DR-c decreased by 0.69%, 0.75% and 0.85%, respectively; after the fourth cycle, it decreased by 6.64%, 7.05% and 7.20%, respectively. This decrease can be attributed to loss of activated sites after each desorption step.30,41 DR composites had two distinctly different active sites on the surface of resin. One is the tertiary ammonium (–N(CH3)2) functional group and the other is the surface hydroxyl iron oxide particles with high affinity toward ligands such as glyphosate. It was concluded that the change in the adsorption capacity was mainly governed by the amount of active sites of the hydroxyl iron oxide particles during the regeneration process. The result also suggested that using NaOH could effectively regenerate the adsorbent with regeneration efficiencies ranging from 90.8% to 99.3%.
 |
| | Fig. 9 Adsorption capacities of DR composites to glyphosate after regeneration (four cycles). | |
3.7 Column adsorption
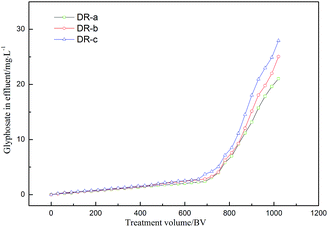
In order to evaluate the reliability and feasibility of DR composites for potential application, the column adsorption of DR composites was performed, and the results are shown in Fig. 10. As shown in Fig. 10, glyphosate could be effectively removed by DR composites within approximately 750 BV per run without exceeding the concentration of 5 mg L−1. The treatment volumes at the 10% breakthrough point were 990, 960, and 930 bed volumes (BV) for DR-a, DR-b and DR-c, respectively.
 |
| | Fig. 10 Breakthrough profiles of glyphosate removal by DR-a, DR-b and DR-c at 303 K. | |
3.8 Adsorption mechanism
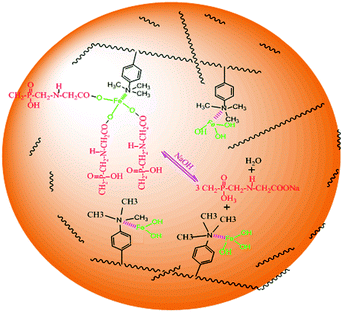
The glyphosate adsorption onto DR composites may be explained by Fig. 11. The DR composites had two distinctly different active sites within the polymer phase. One is covalently attached functional groups bound to the polymeric matrix of the host resin, which has high affinity toward hydrophobic anions and the other is surface nanosized iron hydroxyl oxide particles, which has high affinity toward ligands. The amount of active sites of nanosized iron hydroxyl oxide particles was much more than that of functional groups on the surface. Therefore, DR composites exhibited high adsorption capacity, which was mainly due to the bonding between nanosized iron hydroxyl oxides and glyphosate. The pH of the aqueous solution after glyphosate adoption had almost no change or increase in the present experiments, which also further supported these mechanisms.
 |
| | Fig. 11 The mechanism of glyphosate adsorption onto DR composites. | |
4. Conclusions
In this study, a novel macroporous anion exchanger-supported double valent nano-sized hydroxyl iron oxide was synthesized, which could be an efficient adsorbent for glyphosate separation from water. DR composites were ascertained by adopting various characterizing methods like SEM, TEM, XRD, BET and XPS. The DR composites were successfully applied to remove glyphosate from water in batch and column experiments. The order of adsorption capacity of DR composites to glyphosate was DR-a > DR-b > DR-c, and this adsorption process could be well-described by a pseudo-second-order kinetics model. With an increase in pH, the adsorption capacity gradually decreased. The Langmuir model exhibited the better fit with the experimental data for DR-a. In addition, the presence of a co-anion, such as Cl−, SO42− and H2PO4−, could reduce the DR composite uptake. DR-a exhibits excellent salinity resistance. The regeneration test and fixed-bed adsorption test further demonstrated that the DR composites had great potential to be a cost-effective technology for the removal of glyphosate from wastewater.
Acknowledgements
We gratefully acknowledge the generous support provided by the National Natural Science Foundation of China (51290282, 51438008 and 21276027) and Shandong Province Higher Educational Science and Technology Program, China (Grant No. J14LC05 and J15LD04).
References
- A. Manassero, C. Passalia, A. C. Negro, A. E. Cassano and C. S. Zalazar, Water Res., 2010, 44, 3875–3882 CrossRef CAS PubMed.
- R. T. Carneiro, T. B. Taketa, R. J. Gomes Neto, J. L. Oliveira, E. V. Campos, M. A. De Moraes, C. M. da Silva, M. M. Beppu and L. F. Fraceto, J. Environ. Manage., 2015, 151, 353–360 CrossRef CAS PubMed.
- J. Ma and X. Li, Chemosphere, 2015, 128, 293–298 CrossRef CAS PubMed.
- J. M. Arroyave, C. C. Waiman, G. P. Zanini and M. J. Avena, Chemosphere, 2016, 145, 34–41 CrossRef CAS PubMed.
- X. Yang, F. Wang, C. P. M. Bento, S. Xue, L. Gai, R. van Dam, H. Mol, C. J. Ritsema and V. Geissen, Sci. Total Environ., 2015, 512–513, 406–414 CrossRef CAS PubMed.
- M. Muneer and C. Boxall, Int. J. Photoenergy, 2008, 2, 145–148 Search PubMed.
- G. R. M. Echavia, F. Matzusawa and N. Negishi, Chemosphere, 2009, 76, 595–600 CrossRef CAS PubMed.
- W. A. Morley and S. Seneff, Surg. Neurol. Int., 2014, 5, 97 CrossRef PubMed.
- Y. Chen, F. Wu, Y. Lin, N. Deng, N. Bazhin and E. Glebov, J. Hazard. Mater., 2007, 148, 360–365 CrossRef CAS PubMed.
- P. L. Huston and J. J. Pignatello, Water Res., 1999, 33, 1238–1246 CrossRef CAS.
- A. Mehrsheikh, M. Bleeke, S. Brosillon, A. Laplanche and P. Roche, Water Res., 2006, 40, 3003–3014 CrossRef CAS PubMed.
- M. J. Hedegaard and H. J. Albrechtsen, Water Res., 2014, 48, 71–81 CrossRef CAS PubMed.
- M. M. Nourouzi, T. G. Chuah, T. S. Y. Choong and F. Rabiei, J. Environ. Sci. Health, Part B, 2012, 47, 455–465 CrossRef CAS PubMed.
- L. Lyliam, D. F. Mario, S. Verońica, M. Daiman, L. Cynthia, F. Lucıa, F. Ana and L. Claudia, Bioresour. Technol., 2007, 98, 1045–1051 CrossRef PubMed.
- A. Khenifi, Z. Derriche, C. Mousty, V. Prévot and C. Forano, Appl. Clay Sci., 2010, 47, 362–371 CrossRef CAS.
- F. X. Chen, C. R. Zhou, G. P. Li and F. F. Peng, Arabian J. Chem., 2016, 9, 1665–1669 CrossRef.
- G. Xiao and R. Wen, Fluid Phase Equilib., 2016, 411, 1–6 CrossRef CAS.
- C. M. Jonsson, P. Persson, S. Sjoberg and J. S. Loring, Environ. Sci. Technol., 2008, 42, 2464–2469 CrossRef CAS PubMed.
- K. A. Lin and C. Wu, RSC Adv., 2016, 6, 68111–68119 RSC.
- Q. Q. Shi, A. M. Li, Q. Zhou, C. D. Shuang, Y. Li and Y. Ma, J. Ind. Eng. Chem., 2014, 20, 4256–4260 CrossRef CAS.
- A. Asfaram, M. Ghaedi, S. Agarwal, I. Tyagi and V. Kumar Gupta, RSC Adv., 2015, 5, 18438–18450 RSC.
- B. C. Barja and S. A. M. Dos, Environ. Sci. Technol., 2005, 39, 585–592 CrossRef CAS PubMed.
- C. M. Jonsson, P. Persson, S. Sjöberg and J. S. Loring, Environ. Sci. Technol., 2008, 42, 2464–2469 CrossRef CAS PubMed.
- H. Cui, Q. Li, Y. Qian, Q. Zhan and J. P. Zhai, Environ. Technol., 2012, 33, 2049–2056 CrossRef CAS PubMed.
- E. Morillo, T. Undabeytia, C. Maqueda and A. Ramos, Chemosphere, 2000, 40, 103–107 CrossRef CAS PubMed.
- C. Su and R. W. Puls, Environ. Sci. Technol., 2001, 35, 4562–4568 CrossRef CAS PubMed.
- S. Luo, P. Qin, J. Shao, L. Peng, Q. Zeng and J. Gu, Chem. Eng. J., 2013, 223, 1–7 CrossRef CAS.
- V. Chandra, J. Park, Y. Chun, J. W. Lee, I. Hwang and K. S. Kim, ACS Nano, 2010, 4, 3979–3986 CrossRef CAS PubMed.
- Y. S. Ho and G. McKay, Water Res., 2000, 34, 735–742 CrossRef CAS.
- Y. S. Ho and G. McKay, Process Biochem., 1999, 34, 451–465 CrossRef CAS.
- Y. Guo, J. Deng, J. Zhu, C. Zhou, C. Zhou, X. Zhou and R. Bai, RSC Adv., 2016, 6, 39762–39773 RSC.
- Y. S. Ho and A. E. Ofomaja, J. Hazard. Mater., 2006, 129, 137–142 CrossRef CAS PubMed.
- J. Sheals, P. Persson and B. Hedman, Inorg. Chem., 2001, 40, 4302–4309 CrossRef CAS PubMed.
- T. M. Petrova, L. Fachikov and J. Hristov, International Review of Chemical Engineering, 2011, 3, 134–152 Search PubMed.
- R. M. Cornell and U. Schwertmann, The Iron Oxides-Structures, Properties, Occurances and Uses, WILEY-VCH Verlag GmbH&Co. KGaA, Weinheim, 2nd edn, 2003 Search PubMed.
- B. C. Barja and M. dos Santos Afonso, Environ. Sci. Technol., 1998, 32, 3331–3335 CrossRef CAS.
- J. Sheals, S. Sjöberg and P. Persson, Environ. Sci. Technol., 2002, 36, 3090–3095 CrossRef CAS PubMed.
- I. Langmuir, J. Am. Chem. Soc., 1916, 38, 2221–2295 CrossRef CAS.
- H. M. F. Freundlich, Z. Phys. Chem., 1906, 57, 385–470 CAS.
- A. Jain and R. H. Loeppert, J. Environ. Qual., 2000, 29, 1422–1430 CrossRef CAS.
- Y. Tang, X. Guan, T. Su, N. Gao and J. Wang, Colloids Surf., A, 2009, 337, 33–38 CrossRef CAS.
- K. H. Goh, T. T. Lim and Z. Dong, Water Res., 2008, 42, 1343–1368 CrossRef CAS PubMed.
- H. Li, C. Shan, Y. Zhang, J. Cai, W. Zhang and B. Pan, ACS Appl. Mater. Interfaces, 2016, 8, 3012–3020 CAS.
- L. Cumbal and A. K. SenGupta, Environ. Sci. Technol., 2005, 39, 6508–6515 CrossRef CAS PubMed.
- X. Meng, S. Bang and G. P. Korfiatis, Water Res., 2000, 34, 1255–1261 CrossRef CAS.
- D. M. Jia, L. S. Wang, C. H. Li and X. X. Wang, Fluid Phase Equilib., 2012, 327, 1–8 CrossRef CAS.
|
| This journal is © The Royal Society of Chemistry 2017 |
Click here to see how this site uses Cookies. View our privacy policy here.  Open Access Article
 *ab,
C. H. Lib and
A. M. Li*a


![[triple bond, length as m-dash]](https://www.rsc.org/images/entities/char_e002.gif) FeOH + H+ ↔ FeOH2+, pH < pHPZC
FeOH + H+ ↔ FeOH2+, pH < pHPZC
![[triple bond, length as m-dash]](https://www.rsc.org/images/entities/char_e002.gif) FeOH ↔ FeO− + H+, pH > pHPZC
FeOH ↔ FeO− + H+, pH > pHPZC
![[triple bond, length as m-dash]](https://www.rsc.org/images/entities/char_e002.gif) FeOH + OH− ↔ FeO− + H2O, pH > pHPZC
FeOH + OH− ↔ FeO− + H2O, pH > pHPZC


