 Open Access Article
Creative Commons Attribution 3.0 Unported Licence
The supranutritional selenium status alters blood glucose and pancreatic redox homeostasis via a modulated selenotranscriptome in chickens (Gallus gallus)†
Li-Run Xiang‡
a,
Wei Li‡a,
Li-Li Wangab,
Chang-Yu Caoa,
Nan Liac,
Xue-Nan Liad,
Xiu-Qing Jiangad and
Jin-Long Li *ad
*ad
aCollege of Veterinary Medicine, Northeast Agricultural University, Harbin, 150030, People's Republic of China. E-mail: Jinlongli@neau.edu.cn; Tel: +86 451 55190407
bCollege of Veterinary Medicine, Shanxi Stem Cell Engineering and Technology Center, Northwest A&F University, Yangling 712100, P. R. China
cNational Science and Technology, Institute of Health and Family Planning Commission, Beijing, 100081, P. R. China
dKey Laboratory of the Provincial Education, Department of Heilongjiang for Common Animal Disease Prevention and Treatment, Northeast Agricultural University, Harbin, 150030, P. R. China
First published on 5th May 2017
Abstract
Numerous studies have found that high Selenium (Se) influences the pancreas in animals. Considerable studies suggest that Se status plays an important role in the pancreatic function and regulation of blood glucose in chicks. However, true proof for the effects of the supranutritional Se status on the chicken pancreas through modulating the selenotranscriptome is lacking. 1 day-old chicks were fed a basal diet and Se (0.15 mg, 3.0 mg, or 5.0 mg Se per kg of diet) for 8 weeks. The blood glucose level, tissue Se content, redox homeostasis and mRNA level of the selenoproteome in the pancreas were measured. The supranutritional Se status (3.0 mg kg−1) decreased the blood glucose level and increased the pancreatic antioxidant capacity. The excess Se status (5.0 mg kg−1) increased the blood glucose and Se content and decreased the pancreatic antioxidant capacity. The dietary Se status affected the mRNA levels of 24 selenoproteins and the selenoprotein synthesis related transcription factors in the pancreas. The dietary Se level could modulate the growth performance via affecting the blood glucose level and pancreatic function. Se contributions to chicken growth and the regulation of blood glucose are associated with pancreatic redox homeostasis via a modulated selenotranscriptome in chickens.
Introduction
Selenium (Se), which plays an important role in regulating various metabolic processes, is an essential nutrient for humans and many other species.1 Se deficiency causes a variety of diseases in different types of animals.2 In chickens, Se deficiency induces exudative diathesis, nutritional muscular dystrophy, neurological phenotypes and pancreatic atrophy.3–5 The pancreas may be the target organ of Se deficiency in chicks.6 It is reported that dietary Se deficiency produced severe pancreatic degeneration.7 Histological pancreatic changes in Se-deficient chicks have been described as hyaline body formation and vacuolation of individual acinar cells succeeded by fibrosis in the chronic phase; occasionally there were foci of acinar necrosis.8,9 Nevertheless, it was noted that Se may damage the tissue when its intake was too high. Since many studies have reported potentially protective effects of Se in human and animal models of type 2 diabetes.10–13 High-dose selenite treatment exacerbates hepatic insulin resistance in mouse model of type 2 diabetes.12,13 However, little is known about the influence of supranutritional Se in the pancreatic tissue of chickens.Se has been considered to be an insulin-mimic and anti-diabetic.14 Animal studies and epidemiological surveys have shown correlations between Se deficiency and glucose or lipid disorders impairment or low plasma Se or selenoprotein status in diabetic subjects.15 These have been observed that Se stimulates glucose uptake in adipocytes and restores normoglycaemia in streptozotocin-diabetic rats.16 Feeding both normal and diabetic rats with Se-deficient diet for 10 weeks elevated their plasma glucose concentrations and induced albuminuria and glomerular sclerosis.17 However, recent epidemiological data have proved potential high-glucose effects of high Se intake.18,19 Se excess resulted in the oxidative damage and hepatocyte histopathology.20 Dietary high Se induced hyperinsulinemia, insulin resistance, and glucose intolerance.21 Increasing studies have been determined the impact of high Se intake on glucose and lipid metabolism in mice, rats, and pigs.17 These reports suggested that high Se may affect the glucose metabolism. However, the effect of supranutritional Se to the glucose metabolism in chickens have not been identified.
Selenoproteins are the biological effector molecules of Se in animals.22 The Se in all selenoproteins is present as selenocysteine (Sec) in the peptide backbone, which is specified positionally by an UGA codon (normally a stop codon) in the mRNA.23 The codon UGA not only acts as an opal stop codon during translation, but also encodes the translational incorporation of Sec into proteins when the mRNA contains a distinct hairpin mRNA sequence downstream of the UGA codon in its 3-untranslated region.24 Insertion of Sec requires the presence of a complex machinery that includes Sec tRNA, elongation factor selenocysteine-specific elongation factor (EFsec), SECp43, O-phosphoseryl-tRNA (Sec) kinase (PSTK), and selenocysteine synthase and SECIS binding proteins (SECIS binding protein 2 (SBP2)), translation initiation factor 4A3 (eIF4A3), and nucleolin.25–27 Selenoproteins are involved in antioxidant to reduce the concentration of blood glucose in vivo.28 Biosynthesis and activity of many selenoenzymes depend on Se availability.29 Numerous studies indicate that selenoproteins can protect the pancreas.30,31 These evidences suggest that selenoproteins may play an important role in pancreas function.
Se is a key constituent of selenoenzymes and other selenoproteins with antioxidant function.32 Oxidative stress has been shown to decrease pancreatic function and destroy the regulation of glucose.33 Pancreas is very sensitive to oxidative stress because of lower levels of antioxidant enzymes in tissue.34,35 Se also displays an insulin-mimetic activity in vitro and in vivo.36 However, the effect of supranutritional Se status on the pancreas of chicken is not clear, especially the role of selenoproteins. Thus, the aim of this study was to investigate the effect of supranutritional Se on the pancreas via modulating selenotranscriptome.
Experimental
All experimental procedures were approved by the Institutional Animal Care and Use Committee of Northeast Agricultural University (NEAU). Methods were carried out in accordance with the approved guidelines of NEAU.Experimental animals and treatments
Male 1 day-old chicks (n = 240, HY-LINE VARIETY WHITE, Xianfeng farm, Harbin, China) were randomly divided into three groups and fed the basal diet with 0.15 mg kg−1 Se (control Se, C-Se) as Na2SeO3, 3.0 mg kg−1 Se (supranutritional Se, S-Se), and 5.0 mg kg−1 Se (excess Se, E-Se). The volume, protein content, energy level, and trace elements (except Se) in the feed match the NRC recommendations. Chickens raised were immunized and had free access to feed, water. Observations concerning general health and clinical symptoms were recorded daily. At the end of the experimental period, chickens (100 chicks at the 4th and 8th week, respectively) were sacrificed, and the pancreas was dissected out. The pancreas tissue was stored in RNA Locker (Beijing Tiandz, Inc. China) for RNA extraction then preserved at −80 °C until use.Determination of blood glucose
Chickens were fasted for 24 h overnight and then blood samples were drawn at the end of the 2nd, 4th, 6th, and 8th week. Blood samples were analysed immediately for glucose content using HemoCueB-Glucose Analyzer (HemoCue, Lake Forest, CA).Determination of pancreatic Se level
Se level was determined using inductively coupled plasma mass spectrometry (ICP-MS, Agilent 7500cs-Octopole Reaction Cell, Agilent Technologies, USA). A complete digestion of the samples was performed with a microwave digestion system. The digested samples were diluted with ultrapure water to a final volume of 50 mL and mixed well prior to ICP-MS analysis. The concentrations of Se in the pancreas were determined with the calibration curve method and compared among the non-, H2 and D2 reaction modes.Determination of pancreatic redox states
Determination of CAT activity
The catalase (CAT) activity was measured with a detection kit (Nanjing Jiancheng Bioengineering Institute, China). By using visible light, the decomposition of H2O2 by CAT can be interrupted by adding ammonium molybdate; the remaining H2O2 and ammonium molybdate can produce a light yellow complex. CAT activity can be calculated by determining the amount of complex produced.Analysis of the selenotranscriptome
To evaluate the effect of Se status on the selenotranscriptome in pancreas, the expression of 24 selenoproteins and 6 selenoprotein synthesis related transcription factors were tested using the real-time reverse transcriptase-polymerase chain reaction array (qRT-PCR array). Total RNA was isolated from the pancreas at 4th and 8th week using the RNA out reagent (Beijing Tiandz, Inc. China) and following the manufacturer's protocol. The dried RNA pellets were resuspended in 40 μL of nuclease-free water. The content and purity of total RNA was determined using a spectrophotometer at 260/280 nm. First-strand cDNA synthesis was performed using Oligo dT primers and TransScript Reverse Transcriptase (Beijing TransGen Biotech Co. Ltd., China) according to the manufacturer's protocols.Primers for the selenoproteome genes and the 4 reference genes, β-actin (Actb), glyceraldehyde 3-phosphate dehydrogenase (GAPDH), ribosomal protein L19 (RPL19), ribosomal protein L14 (RPL14), were designed using Primer Analysis Software (Oligo 7.24, Molecular Biology Insights, Inc. USA) (Table S1†). The mRNA expressions of selenoproteins were assayed by qRT-PCR array using a 7500 Real Time PCR System (Applied Biosystems, Carlsbad, CA, USA) and GoTaq® qPCR Master Mix (Promega, USA). The qRT-PCR array brings a highly sensitive and reliable method of gene expression profiling. The array was designed in a 96-well format and set up to detect 84 wells of target genes, 4 wells for housekeeping genes and internal controls, 1 well for the DNA control, 3 wells for positive and negative controls. There were 3 replicates for each tissue. All data was normalized to the internal control primers, and the 2−ΔΔCt method was used to calculate relative changes on mRNA expression. Data analysis of mRNA expression was analysed using the GeneCopoeia-FulenGen qPCR Array data analysis system online (http://www.genecopoeia.com/product/qpcr/analyse2/index.php).
The heatmap of the selenotranscriptome
We showed the expression profile of each gene derived from different groups using the heatmap. It was plotted using heatmap R package (version 3.2.1). The data are presented as mean. The source code of heatmap package was slightly modified to improve the layout and to add some features, the R function plots were used.Statistical analysis
Statistical analysis of the blood glucose, antioxidant related factors, the selenotranscriptome in pancreas was analysed using GraphPad Prism 5.1 (GraphPad Software Inc., USA). One way-analysis of variance (ANOVA) and the Least Significant Difference (LSD) post hoc test were used to analyse the data. Differences among the means of data were analysed by the paired T-test which was utilized to determine the effects of Se status. The results were expressed as mean ± S.D. of different groups. The significant differences of all data were showed by ANOVA about each experiment. Statements of significance were based on P < 0.05 unless otherwise stated.Results
Effects of supranutritional Se status on the level of blood glucose and growth performance
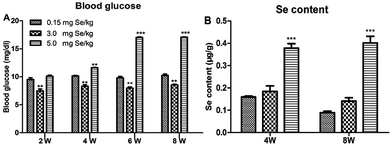
One-day-old chicks were allocated randomly to experimental groups. At the start, body weight was no significant differences in initial group weights. After 8 weeks, dietary Se had a significant effect on body weight and chicks fed the supranutritional Se diet had the higher average body weight (data not shown). The S-Se and E-Se groups exhibited larger body sizes and glossy feathers. The blood glucose of the E-Se group was significantly higher than C-Se group at the 2nd, 4th, 6th, 8th weeks (P < 0.01 or P < 0.001), but the S-Se group was significantly lower (P < 0.01) (Fig. 1A).Effects of supranutritional Se status on the Se content of pancreas
The effect on pancreatic performance was found in the S-Se and E-Se groups. To investigate the effects of supranutritional Se status on the pancreas, the content of pancreatic tissue was tested. Se content of pancreas was increased significantly in the E-Se group for 4th and 8th weeks, compared to the C-Se group (P < 0.001), but there was not any alternation in the S-Se group (Fig. 1B).Effects of Se status on pancreatic redox states in pancreas
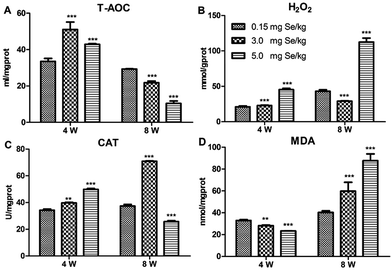
Four antioxidant factors in pancreatic tissue, including T-AOC, H2O2, MDA, and CAT, were influenced by dietary Se level. Compared to the C-Se group, T-AOC content increased in the S-Se and E-Se group at the 4th week (P < 0.001) and decreased significantly in the S-Se and E-Se groups at the 8th week (P < 0.001) (Fig. 2A). H2O2 content increased significantly in the E-Se group at the 4th and 8th week and in the S-Se group at the 4th week (P < 0.001) and decreased in the S-Se at the 8th week (P < 0.001), compared to the C-Se group (Fig. 2B). The CAT activity in the S-Se group increased significantly at the 4th and 8th week, compared to the C-Se group (P < 0.01 or P < 0.001). However, the CAT activity in the E-Se group increased significantly at the 4th week (P < 0.001) and decreased at the 8th week (P < 0.001), compared to the C-Se group (Fig. 2C). MDA content decreased in the S-Se and E-Se groups at the 4th week and increased at the 8th week (Fig. 2D).Effects of Se status on the selenotranscriptome in pancreas
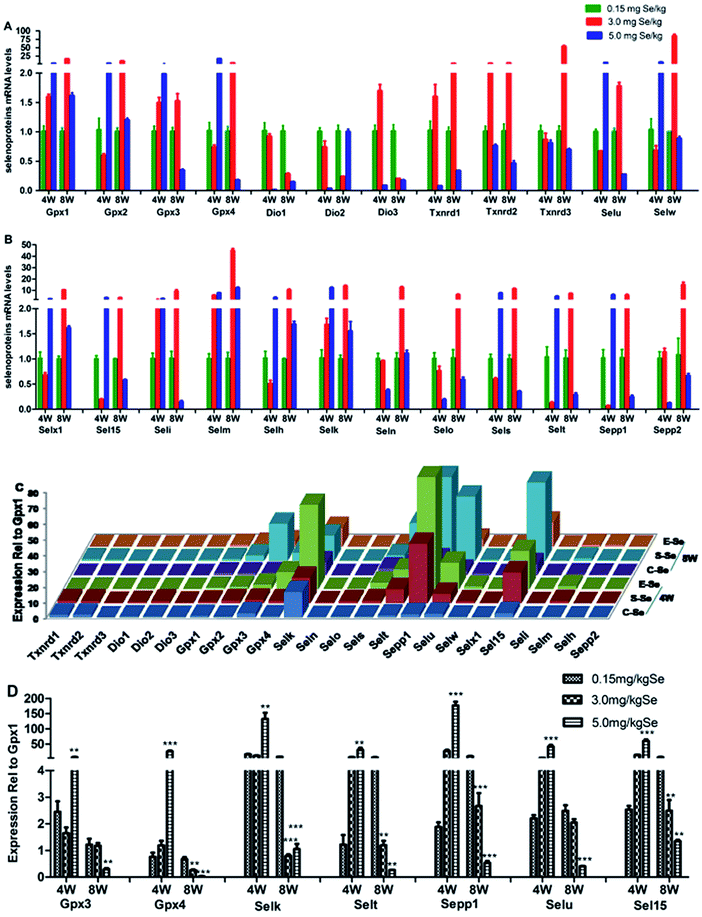
We screened reverse-transcribed pancreas cDNA libraries for selenoprotein transcript expression using qRT-PCR array. Fig. 3 showed the relative expression of transcripts for the 24 chicken selenoproteins for the housekeeping genes (Fig. 3A and B), and for Gpx1 (Fig. 3C and D). As shown in Fig. 3A and B, the mRNA expression of eight selenoproteins (Gpx1, Gpx3, Txnrd1, Txnrd2, Dio3, Seli, Selm and Selh) in the S–Se group at the 4th week generally increased and four selenoproteins (Selx1, Sel15, Sepp1 and Selt) decreased significantly, compared to the C-Se group (P < 0.05). The mRNA expression of fifteen selenoproteins in the E-Se group at the 4th week increased and six selenoproteins (Dio1, Dio2, Dio3, Txnrd1, Selo, Sepp2) decreased significantly, compared to the C-Se group (P < 0.05). In the S–Se group at the 8th week, the expressions of almost selenoproteins expect Dio1, Dio2, Dio3, were un-regulated, but over fourteen selenoproteins expect Selx1, Selm, Selh and Selk were down-regulated in the E-Se group.As shown in Fig. 3C, seven selenoproteins (Gpx3, Gpx4, Selk, Selt, Sepp1, Selu, Sel15) mRNA in pancreas were the most abundant and expressed at levels comparable to levels for Gpx1. In the S–Se group at the 4th week, the expressions of seven selenoproteins were not alter in pancreas and at the 8th week decreased, compared to the C-Se group. In the E-Se group, the expressions of seven selenoproteins increased significantly at the 4th week (P < 0.01 or P < 0.001) and decreased at the 8th week (P < 0.01 or P < 0.001), compared to the C-Se group.
Effects of Se status on the selenoprotein synthesis related transcription factors in pancreas
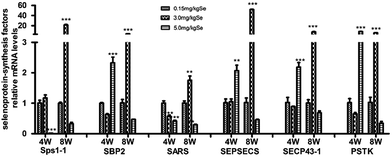
The selenoprotein synthesis related transcription factors play an important role from Se to selenoprotein. We also screened reverse-transcribed pancreas cDNA libraries for six factors (Sps1-1, SBP2, SARS, SEPSECS, SECP43-1, PSTK) transcript expression using qRT-PCR array (Fig. 4). In the S–Se group, five factors (Sps1-1, SARS, SEPSECS, SECP43-1, PSTK) were not change at the 4th week and six factors increased significantly at the 8th week (P < 0.01 or P < 0.001), compared to the C-Se group (Fig. 4). In the E-Se group, Sps1-1 and SARS decreased at the 4th and 8th week, SBP2, SEPSECS, SECP43-1 and PSTK increased significantly at the 4th week (P < 0.01 or P < 0.001) and decreased at the 8th week, compared to the C-Se group (Fig. 4).Effects of supranutritional Se status on selenoproteomic expression spectrum
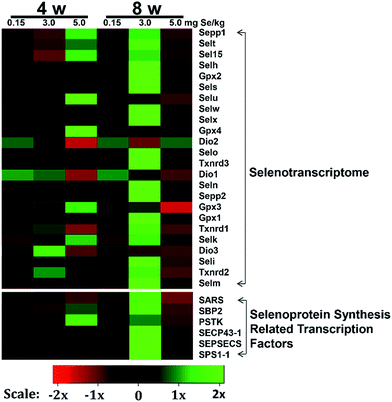
To determine the effects of supranutritional Se status on the hierarchy of selenotranscriptome expression in pancreas, we analysed the relative expression of transcripts for 24 chicken selenoproteins and six selenoprotein synthesis related transcription factors in C-Se, S–Se or E-Se group at the 4th and 8th week (Fig. 5). In the heatmap, the expressions of nine genes (Sepp1, Selt, Sel15, Selu, Gpx3, Gpx4, Selk, SBP2 and PSTK) in the E-Se group were up-regulated at the 4th week. The expressions of almost genes (except Selu, Gpx3, Gpx4, Dio1, Dio2, Dio3) in the S–Se group were also up-regulated at the 8th week. However, in the E-Se group at the 8th week, the expressions of numerous genes were significantly down-regulated (Fig. 5), compared to the C-Se group.Discussion
Se plays important roles on maintaining the function of pancreas, and chicken is the animal whose pancreas is extremely susceptible to dietary Se.4 Se deficiency elevates the level of plasma glucose and stimulates glucose uptake.15–17 Commission Implementing Regulation (EU, No 427/2013)37 reported that the maximum supplementation with organic selenium to 0.2 mg Se per kg complete feed for reasons of consumer safety and maximum content of total Se in feed of animal species is 0.5 mg kg−1 of complete feed. Increased dietary Se content markedly reduced feed conversion ratio (FCR) as a result of significantly lower feed intakes of birds while maintaining the same weight gains.38 In the present study, supranutritional dietary Se affected the blood glucose concentrations in chicks and decreases the pancreatic Se contents. This work helps in understanding the mechanism of the appropriate Se supplementation increased the growth performance in chicken.Pancreas represents a main structure to regulate glucose metabolism and homeostasis.36,39 More and more studies have found dietary supranutritional Se can cause high glucose.16,18,19,21 Previous studies showed that Se administration to normal rats for 4 weeks caused a significant increase in blood glucose level.40 In this study, dietary supranutritional Se (<3.0 mg kg−1) decreased the blood glucose in chicks and elevated the weight gains. The pancreatic Se content was changed in the chicks fed with supranutritional Se diet. However, dietary excess Se (>5.0 mg kg−1) increased the blood glucose and decreased the final body weight compared to the normal Se level. Excess Se significantly increased the pancreatic Se content. Those data suggested that the appropriate Se supplementation improved the weight gains and growth performance via affecting the blood glucose level and the pancreatic Se content in birds.
Se can protect the pancreas by enhancing antioxidant enzyme (SOD, CAT, T-AOC) activities and significantly reducing pancreas lipid peroxides.41–43 Thus Se is able to neutralize ROS and prevent cellular components from oxidative damage.42 In this study, dietary supranutritional Se increased significantly CAT and T-AOC levels and decreased the H2O2 and MDA content in pancreas, which suggested that the pancreatic antioxidant system against oxidative stress was strengthened. Here, we observed that T-AOC or CAT activity was decreased and H2O2 or MDA content was increased in the pancreas of chicks fed dietary excess Se. This result was consistent with the outcomes of previous investigations in pancreas.44 The elevated concentrations of H2O2 can damage pancreatic cells, influence insulin release and signalling, and alter glucose metabolic processes.45,46 It is concluded that Se can influence the steady-state level of H2O2.47 CAT is more important in protecting against severe oxidative stress. In this study, these data of CAT and H2O2 suggested that the levels of reactive oxygen species were beyond the limit of antioxidant abilities. The concern about the relationship between Se and high glucose is that there may be adverse effects of excess Se supplementation, given that pancreatic antioxidant ability is decreased.
Se, an essential trace element, is incorporated into selenoproteins that play a crucial role in animal health. It can regulate the concentration and activity of selenoproteins, but also regulate the amount of the corresponding mRNA expression.48 Se exerts most of its known biological functions through selenoproteins, many of them being antioxidant enzymes.49 As we all know, the Gpxs have the antioxidant function via reducing the content of peroxides in the body.50–52 The Txnrds play an important role in regenerating antioxidant system, gene expression, cell viability, and proliferation.53,54 And, Dios are indicated to regulate the activity of the thyroid hormone. In addition, other selenoproteins are transmembrane glycoproteins and play a key role in redox homeostasis and cell protection against oxidative stress.55–57 Prior studies indicated that Se deficiency influenced the expressions of 24 selenoproteins, such as Txnrd1, Sels, Selu, Sepx1, Sepw1 in the immune system, pancreas of chickens.58–60
In the present study, we mainly studied the effect of dietary Se status on the expressions of all 24 selenoproteins in pancreas. The supranutritional Se intake increased mRNA levels of most selenoprotein in the chickens. These results confirm that appropriate Se content is contributed to protect pancreatic function through overproduction of selenoprotein activity diminishes intracellular ROS. This mechanism is different from the reports about the mammals, such as rats. It is unique for this study to illustrate the effect of the Se status and a continued supranutritional Se intake on chicken. However, excess Se diet reduced the expressions of almost 24 selenoproteins in pancreas and influenced the levels of antioxidative selenoproteins and then destroyed the function of the pancreas. Overall, our findings reveal a realistic risk of prolonged excess Se intake and argue against nondiscretional Se supplements for Se-adequate subjects.
Several studies have been conducted that examined the expression of selenoprotein transcripts, primarily with a focus on the impact of Se deficiency, but also with data on expression in Se-adequate chicks.23 In this study, the mRNA abundances of seven selenoproteins (Gpx3, Gpx4, Selk, Selt, Sepp1, Selu, Sel15) in pancreas were the highest among 24 avian selenoproteins. Noting, Sepp1 mRNA was most highly expressed in pancreas. Sepp1 is closely related to glucose metabolism, high glucose concentrations dose-dependently suppressed the Se-induced elevation of Sepp1 mRNA level. The high glucose induced by the excess Se diet in the chick was associated with a consistent downregulation of mRNA levels of these selenoproteins levels. Although the roles of Gpx3, Gpx4, Selk, Selt, Selu and Sel15 in glucose metabolism or diabetes have not been reported, these selenoproteins may play crucial roles in chicken pancreas. In addition, most of these affected selenoproteins preserve the antioxidative function. Thus, the decreased antioxidative selenoproteins may disturb the balance between oxidant and antioxidant agent and induce oxidative stress and oxidative damage.46 In this study, the expressions of eight selenoproteins were increased at the supranutritional concentration of Se in chicken pancreas. It revealed that the eight selenoproteins which had higher hierarchy might exert important influences to resist diseases.
Se exerts biological functions mainly as the amino acid selenocysteine (Sec) in selenoproteins in mammals.23 All selenoprotein genes have two characteristic features: a Sec-encoding TGA codon and a Sec insertion sequence (SECIS) element.61 The alternations of these factors expression may affect selenoprotein expression. In this study, dietary supranutritional Se increased six factors significantly at the 8th week. And dietary excess Se increased significantly the expressions of SBP2, SEPSECS, SECP43-1 and PSTK at the 4th week and decreased at the 8th week. These results suggested that the levels of selenoprotein expression can be regulated by dietary Se concentration via affecting the selenoprotein synthesis related transcription factors (Fig. 6).
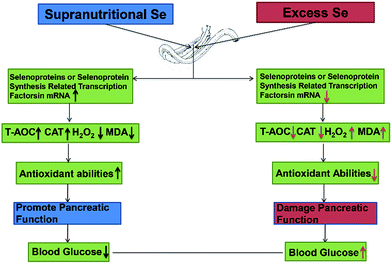 | ||
| Fig. 6 Supranutritional selenium status alters blood glucose and pancreatic redox homeostasis via modulated selenotranscriptome. | ||
Conclusions
In conclusion, dietary Se level could modulate the growth performance via affecting the blood glucose level and the pancreatic function. Supranutritional Se status could increase the growth through downregulating the blood glucose level in chicken. Excess Se status could inhibit the growth through upregulating the blood glucose level in chicken. Se contributions of chicken growth and the regulation of blood glucose are associated with the pancreatic redox homeostasis via modulated selenotranscriptome in chickens (Fig. 6).Competing interests
The authors declare there are no competing interests.Acknowledgements
This work was supported by China New Century Excellent Talents in University (No. NECT-1207-02), Program for New Century Excellent Talents In Heilongjiang Provincial University (No. 1252-NCET-009), National Natural Science Foundation of China (No. 31572586) and Academic Backbone Project of Northeast Agricultural University (No. 15XG16). We also acknowledge the valuable help provided by Prof. Shi-Wen Xu in Northeast Agricultural University and all of the workers involved.References
- Y. Liu, H. Zhao, Q. Zhang, J. Tang, K. Li, X. J. Xia, K. N. Wang, K. Li and X. G. Lei, J. Nutr., 2012, 142, 1410–1416 CrossRef CAS PubMed.
- M. Rederstorff, A. Krol and A. Lescure, Cell. Mol. Life Sci., 2006, 63, 52–59 CrossRef CAS PubMed.
- X. Zhao, H. Yao, R. Fan, Z. Zhang and S. Xu, Biol. Trace Elem. Res., 2014, 161, 341–349 CrossRef CAS PubMed.
- J. N. Thompson and M. L. Scott, J. Nutr., 1970, 100, 797–809 CAS.
- J. L. Li, H. X. Li, S. Li, X. J. Gao, S. W. Xu and Z. X. Tang, BioMetals, 2012, 25, 459–468 CrossRef CAS PubMed.
- M. E. Whitacre and G. F. Combs Jr, J. Nutr., 1983, 113, 1972–1983 CAS.
- J. N. Thompson and M. L. Scott, J. Nutr., 1969, 97, 335–342 CAS.
- A. H. Rebar and J. F. Van Vleet, Vet. Pathol., 1977, 14, 629–642 CrossRef CAS PubMed.
- J. Hardman, S. Jamdar, C. Shields, R. McMahon, H. P. Redmond and A. K. Siriwardena, J. Periodontol., 2005, 6, 431–437 Search PubMed.
- A. S. Mueller and J. Pallauf, J. Nutr. Biochem., 2006, 17, 548–560 CrossRef CAS PubMed.
- H. Steinbrenner, B. Speckmann, A. Pinto and H. Sies, J. Clin. Biochem. Nutr., 2011, 48, 40–45 CrossRef CAS PubMed.
- A. Farrokhian, F. Bahmani, M. Taghizadeh, S. M. Mirhashemi, M. H. Aarabi, F. Raygan, E. Aghadavod and Z. Asemi, Horm. Metab. Res., 2016, 48, 263–268 CrossRef CAS PubMed.
- J. Zhou, G. Xu, Z. Bai, K. Li, J. Yan, F. Li, S. Ma, H. Xu and K. Huang, Toxicol. Appl. Pharmacol., 2015, 289, 409–418 CrossRef CAS PubMed.
- H. Steinbrenner, B. Speckmann, A. Pinto and H. Sies, J. Clin. Biochem. Nutr., 2011, 48, 40–45 CrossRef CAS PubMed.
- X. Wang, W. Zhang, H. Chen, N. Liao, Z. Wang, X. Zhang and C. Hai, Toxicol. Lett., 2014, 224, 16–23 CrossRef CAS PubMed.
- S. C. Campbell, A. Aldibbiat, C. E. Marriott, C. Landy, T. Ali, W. F. Ferris, C. S. Butler, J. A. Shaw and W. M. Macfarlane, FEBS Lett., 2008, 582, 2333–2337 CrossRef CAS PubMed.
- J. Zhou, K. Huang and X. G. Lei, Free Radical Biol. Med., 2013, 65, 1548–1556 CrossRef CAS PubMed.
- S. Stranges, J. R. Marshall, R. Natarajan, R. P. Donahue, M. Trevisan, G. F. Combs, F. P. Cappuccio, A. Ceriello and M. E. Reid, Ann. Intern. Med., 2007, 147, 217–223 CrossRef PubMed.
- M. P. Rayman and S. Stranges, Free Radical Biol. Med., 2013, 65, 1557–1564 CrossRef CAS PubMed.
- X. Hao, Q. Ling and F. Hong, Fish Physiol. Biochem., 2014, 40, 1313–1323 CrossRef CAS PubMed.
- M. S. Zeng, X. Li, Y. Liu, H. Zhao, J. C. Zhou, K. Li, J. Q. Huang, L. H. Sun, J. Y. Tang, X. J. Xia, K. N. Wang and X. G. Lei, Free Radical Biol. Med., 2012, 52, 1335–1342 CrossRef CAS PubMed.
- X. Q. Jiang, C. Y. Cao, Z. Y. Li, W. Li, C. Zhang, J. Lin, X. N. Li and J. L. Li, J. Inorg. Biochem., 2017, 169, 13–22 CrossRef CAS PubMed.
- J. L. Li, H. X. Li, X. J. Gao, J. L. Zhang, S. Li, S. W. Xu and Z. X. Tang, PLoS One, 2012, 7, e35761 CAS.
- J. Kohrle, F. Jakob, B. Contempre and J. E. Dumont, Endocr. Rev., 2005, 26, 944–984 CrossRef CAS PubMed.
- V. M. Labunskyy, D. L. Hatfield and V. N. Gladyshev, Physiol. Rev., 2014, 94, 739–777 CrossRef CAS PubMed.
- A. A. Turanov, X. M. Xu, B. A. Carlson, M. H. Yoo, V. N. Gladyshev and D. L. Hatfield, Adv. Nutr., 2011, 2, 122–128 CrossRef CAS PubMed.
- M. E. Budiman, J. L. Bubenik, A. C. Miniard, L. M. Middleton, C. A. Gerber, A. Cash and D. M. Driscoll, Mol. Cell, 2009, 35, 479–489 CrossRef CAS PubMed.
- B. L. Dhanya, R. P. Swathy and M. Indira, Biol. Trace Elem. Res., 2014, 161, 107–115 CrossRef CAS PubMed.
- W. C. Hawkes and N. L. Keim, J. Nutr., 2003, 133, 3443–3448 CAS.
- D. J. Bowrey, G. J. Morris-Stiff and M. C. Puntis, HPB Surg, 1999, 11, 207–215 CrossRef CAS PubMed ; discussion 215–206.
- M. P. Rayman, Lancet, 2000, 356, 233–241 CrossRef CAS.
- H. Steinbrenner, B. Speckmann and L. O. Klotz, Arch. Biochem. Biophys., 2016, 595, 113–119 CrossRef CAS PubMed.
- H. Kaneto, D. Kawamori, Y. Nakatani, S. Gorogawa and T. A. Matsuoka, Drug News Perspect., 2004, 17, 447–453 CAS.
- J. H. Yu and H. Kim, World J. Gastroenterol., 2014, 20, 17324–17329 CrossRef PubMed.
- S. R. Stapleton, Cell. Mol. Life Sci., 2000, 57, 1874–1879 CrossRef CAS PubMed.
- M. Tharaheswari, N. Jayachandra Reddy, R. Kumar, K. C. Varshney, M. Kannan and S. Sudha Rani, Mol. Cell. Biochem., 2014, 396, 161–174 CrossRef CAS PubMed.
- Commission Implementing Regulation (EU) No 427/2013, Official Journal of the European Union, 2013, L127, 20–22.
- J. L. Li, C. Y. Cao, L. L. Wang, X. Q. Jiang, C. Zhang and J. X. Xu, FASEB J., 2015, 29(S1), 136.5 Search PubMed.
- P. Vazquez, A. M. Robles, F. de Pablo and C. Hernandez-Sanchez, Diabetologia, 2014, 57, 2339–2347 CrossRef CAS PubMed.
- M. Ayaz, S. Ozdemir, N. Yaras, G. Vassort and B. Turan, Biochem. Biophys. Res. Commun., 2005, 327, 163–173 CrossRef CAS PubMed.
- L. A. Bozkaya, R. Ozturk-Urek, T. Aydemir and L. Tarhan, Cell Biochem. Funct., 2001, 19, 153–157 CrossRef CAS PubMed.
- H. Steinbrenner, Free Radical Biol. Med., 2013, 65, 1538–1547 CrossRef CAS PubMed.
- R. Tang, H. Liu, T. Wang and K. Huang, Arch. Biochem. Biophys., 2005, 441, 16–24 CrossRef CAS PubMed.
- M. Naziroglu, J. Recept. Signal Transduction Res., 2012, 32, 134–141 CrossRef CAS PubMed.
- H. Matsui, T. M. Oyama, Y. Okano, E. Hashimoto, T. Kawanai and Y. Oyama, Toxicology, 2010, 276, 27–32 CrossRef CAS PubMed.
- P. Garberg and J. Hogberg, Chem.-Biol. Interact., 1992, 81, 291–306 CrossRef CAS PubMed.
- D. Li, W. Wang, Y. Shan, L. N. Barrera, A. F. Howie, G. J. Beckett, K. Wu and Y. Bao, Food Chem., 2012, 133, 300–307 CrossRef CAS PubMed.
- S. J. Fairweather-Tait, Y. Bao, M. R. Broadley, R. Collings, D. Ford, J. E. Hesketh and R. Hurst, Antioxid. Redox Signaling, 2011, 14, 1337–1383 CrossRef CAS PubMed.
- H. Steinbrenner and H. Sies, Biochim. Biophys. Acta, 2009, 1790, 1478–1485 CrossRef CAS PubMed.
- P. Scheerer, A. Borchert, N. Krauss, H. Wessner, C. Gerth, W. Hohne and H. Kuhn, Biochemistry, 2007, 46, 9041–9049 CrossRef CAS PubMed.
- X. G. Lei and W. H. Cheng, J. Nutr., 2005, 135, 2295–2298 CAS.
- J. G. Li, J. C. Zhou, H. Zhao, X. G. Lei, X. J. Xia, G. Gao and K. N. Wang, Meat Sci., 2011, 87, 95–100 CrossRef CAS PubMed.
- R. Geisberger, C. Kiermayer, C. Homig, M. Conrad, J. Schmidt, U. Zimber-Strobl and M. Brielmeier, Biol. Chem., 2007, 388, 1083–1090 CrossRef CAS PubMed.
- Z. Yang, C. Liu, C. Liu, X. Teng and S. Li, Biol. Trace Elem. Res., 2016, 172, 209–221 CrossRef CAS PubMed.
- S. Arbogast, M. Beuvin, B. Fraysse, H. Zhou, F. Muntoni and A. Ferreiro, Ann. Neurol., 2009, 65, 677–686 CrossRef CAS PubMed.
- M. Rederstorff, P. Castets, S. Arbogast, J. Laine, S. Vassilopoulos, M. Beuvin, O. Dubourg, A. Vignaud, A. Ferry, A. Krol, V. Allamand, P. Guicheney, A. Ferreiro and A. Lescure, PLoS One, 2011, 6, e23094 CAS.
- S. Du, J. Zhou, Y. Jia and K. Huang, Arch. Biochem. Biophys., 2010, 502, 137–143 CrossRef CAS PubMed.
- H. Ruan, Z. Zhang, Q. Wu, H. Yao, J. Li, S. Li and S. Xu, Biol. Trace Elem. Res., 2012, 145, 59–65 CrossRef CAS PubMed.
- D. Yu, J. L. Li, J. L. Zhang, X. J. Gao and S. Xu, Biol. Trace Elem. Res., 2011, 144, 678–687 CrossRef CAS PubMed.
- P. F. Sheng, Y. Jiang, Z. W. Zhang, J. L. Zhang, S. Li, Z. Q. Zhang and S. W. Xu, BioMetals, 2014, 27, 33–43 CrossRef CAS PubMed.
- R. A. Sunde, G. R. Sunde, C. M. Sunde, M. L. Sunde and J. K. Evenson, PLoS One, 2015, 10, e0129801 Search PubMed.
Footnotes |
| † Electronic supplementary information (ESI) available: Table S1 primers used for qRT-PCR. See DOI: 10.1039/c7ra02278f |
| ‡ These authors contributed equally to this work. |
| This journal is © The Royal Society of Chemistry 2017 |

