 Open Access Article
Green fluorescent organic nanoparticles based on carbon dots and self-polymerized dopamine for cell imaging†
Tianxiang Zhanga,
Hongwei Xua,
He Wangb,
Jinyang Zhub,
Yue Zhaib,
Xue Baia,
Biao Dong*a and
Hongwei Song *a
*a
aState Key Laboratory on Integrated Optoelectronics, College of Electronic Science and Engineering, Jilin University, 2699 Qianjin Street, Changchun, 130012, China. E-mail: songhw@jlu.edu.cn; dongb@jlu.edu.cn
bCollege of Physics, Jilin University, 2699 Qianjin Street, Changchun, 130012, China
First published on 7th June 2017
Abstract
Fluorescent organic nanoparticles (FONs) based on polydopamine (PDA) have recently emerged as a novel fluorescent probe due to its facile synthesis procedure, good water solubility, and excellent biocompatibility. However, previously reported PDA-FONs show low monodispersity and efficiency, which largely limit their application. In this study, we report a new type of FONs that has been prepared using carbon dots (CDs) as seeds and assembled via the self-polymerization of dopamine molecules. The prepared FONs showed high efficiency and monodispersity; moreover, via controlling the time of the polymerization reaction, different FONs could be obtained, which demonstrated similar structures but with tunable emission properties, and the emission gradually evolved from blue to green with the increasing reaction time. The mechanism of the prepared FONs was confirmed to be via the Förster resonance energy transfer (FRET) effect occuring between CDs and polymerized dopamine, leading to high efficiency and tunable emission. The FONs were also explored for cell imaging and cytotoxicity experiments, and they showed excellent biocompatibility and good prospects in biotechnological applications.
1. Introduction
In the past decade, fluorescent organic nanoparticles (FONs) have attracted significant attention due to their excellent biocompatibility, low biotoxicity, and potential applications in biosensors, bioimaging,1,2 and therapy.3–6 Various FONs including conjugated polymers, aggregation-induced emission materials, and polydopamine (PDA) nanoparticles have been successively reported in recent years.5–10 Among these, polydopamine FONs (PDA-FONs) have attracted significant attention because of their excellent water-solubility and facile synthesis procedure, i.e. dopamine molecule can self-polymerize at room temperature. In recent years, several studies have been reported on the PDA-FONs: for example, Zhang et al. have reported biocompatible FONs prepared via one-pot oxidation of polydopamine and subsequently utilized them for cell imaging;11 Yildirim et al. have reported that fluorescent PDA nanoparticles can be used for dopamine sensing;12 Liu et al. reported novel fluorescent organic probes for biological imaging applications, which were prepared through the self-polymerization of dopamine and polyethyleneimine;13 Chen et al. reported fluorescent PDA capsules that were used for biomedical application;14 and Lin et al. have reported fluorescent PDA nanodots prepared from hydroxyl radical-induced degradation of PDA nanoparticles.15 Moreover, in these studies, it has been reported that the prepared PDA-FONs undergo larger degree of aggregation and show lower efficiency, which limit their applications. Thus, it is still a challenge to improve the monodispersity and promote the efficiency of the PDA-FONs.On the other hand, carbon dots (CDs) are a new type of fluorescent materials,16 which have been widely applied in many fields, for instance, in bioimaging, sensing, photocatalysis, and optoelectronic devices, because of their unique properties such as outstanding stability, high efficiency, low toxicity, and environmentally friendliness.17–25 Various carbon-containing precursors, from organic molecules to all types of biomass, have been explored for the preparation of different CDs;26–29 however, most of the reported CDs are blue emitters and mainly show absorption in the ultraviolet region, which greatly restricts its application. Thus, extension of the emission wavelength of CDs is of utmost importance. A relatively feasible way is to use a composite material as CDs contain abundant surface groups that make them easy to combine with other materials; moreover, CDs can be used to construct composite materials based on the Förster resonance energy transfer (FRET) effect because the high energy blue emission of CDs makes them an ideal energy donor.30–33
Based on the abovementioned considerations, herein, we report a rather convenient and effective strategy for the preparation of green and high efficiency CD-PDA-FONs using CDs and self-polymerization of DA. The final products exhibited smaller size, high monodispersity, and efficient green emission; moreover, the quantum yield (QY) was 25%. Various techniques have been used to characterize their structure, chemical composition, and optical properties. In addition, the formation process was investigated by analyzing the prepared FONs at different reaction times, and the FONs demonstrated tunable emission properties and the emission color changed from blue to green. Furthermore, the photoluminescence (PL) mechanism of the CD-PDA-FONs was investigated through fluorescence decay analysis. Finally, the biomedical application of CD-PDA-FONs was explored, especially for cell imaging and cytotoxicity.
2. Materials and methods
2.1 Materials
Citric acid (CA), anhydrous ethane diamine (EDA), and isopropanol were of analytical grade and purchased from the Beijing Chemical Reagent Company. Dopamine·HCl (DA, Sigma-Aldrich Co., Shanghai, China) and Tris (Aladdin reagent Inc. Shanghai, China) were used as received without further purification. Water was deionized and purified using a Milli-Q water purification system.2.2 Apparatus
Transmission electron microscopy (TEM) and high resolution TEM (HR-TEM) images were obtained using a JEOL H-800 and JEM-2100 microscope operating at the acceleration voltage of 200 kV. Scanning electron microscopy (SEM) image was obtained using a JEOL JSM-7500F field emission scanning electron microscope (Japan). Dynamic light scattering measurement (DLS) was conducted through a Malvern ZETASIZER nano series. UV-vis spectra were obtained using a Shimadzu 3100 spectrometer. Fluorescence measurements were performed using a fluorescence spectrophotometer (SENS-900). Nanosecond fluorescence lifetime experiments were performed using a time-correlated single-photon counting (TCSPC) system (HORIBA Scientific iHR 320), and a 390 nm nano-LED light source (<1 ns) was used to excite the samples. Fourier transform infrared (FT-IR) spectroscopy was carried out in the transmission mode using a Shimadzu Spectrum 100 spectrometer (Waltham, MA, USA) via the KBr pellet technique, and 16 scans at the resolution of 1 cm−1 were accumulated to obtain each spectrum.2.3 Preparation of the CDs
The CDs were prepared according to previously reported methods with slight modification.34,35 Typically, 1.05 g (5 mmol) CA and 1 mL (15 mmol) EDA was dissolved in 25 mL deionized water and stirred to form a transparent solution. Then, the solution was transferred into a 50 mL Teflon-lined stainless autoclave. The sealed autoclave was heated to 160 °C in an electric oven and kept at this temperature for additional 4 hours. The final products were obtained via the addition of isopropanol into the solution and centrifugation at 10![[thin space (1/6-em)]](https://www.rsc.org/images/entities/char_2009.gif) 000 rpm for 10 min. The supernatant was discarded and the oily sediment was obtained. The process was repeated four times to remove excess impurities and unreacted precursors.
000 rpm for 10 min. The supernatant was discarded and the oily sediment was obtained. The process was repeated four times to remove excess impurities and unreacted precursors.
2.4 Preparation of the CD-PDA-FONs
CDs (100 μL, concentrated) was dispersed in 10 mL deionized water to form a light yellow clear solution. Then, DA (20 mg) was added and pH of the mixed solution was buffered to 8.5 by adding Tris, which could form a Tris–HCl buffer solution with HCl of DA. The solution pH was monitored using a pH meter (KEDIDA CT-6021A Pen pH meter) fitted with a combined glass electrode (0.1 pH units). After stirring for two minutes, the mixed solution turned from light yellow to grey. Then, the mixture was stirred for additional 10 hours at room temperature to ensure the completion of the reaction. Finally, the products were obtained as a dark-grey solution, moderate isopropanol was added to it, and then, the solution was centrifuged for 10 minutes at 12![[thin space (1/6-em)]](https://www.rsc.org/images/entities/char_2009.gif) 000 rpm to remove the larger particles and unreacted CDs. The supernatant was obtained and dried via a vacuum oven at 50 °C for 5 h, and the products were dispersed in deionized water; then, the final products were stored at −4 °C in dark for further measurements. The control pristine PDA-FONs were prepared using the same procedure and conditions but without the CDs.
000 rpm to remove the larger particles and unreacted CDs. The supernatant was obtained and dried via a vacuum oven at 50 °C for 5 h, and the products were dispersed in deionized water; then, the final products were stored at −4 °C in dark for further measurements. The control pristine PDA-FONs were prepared using the same procedure and conditions but without the CDs.
2.5 Confocal cell imaging
MCF-7 cells were purchased from the Shanghai Institute for Biological sciences, Chinese Academy of Science. The culture medium contained RPMI 1640 (GIBCO) and fetal bovine serum in the ratio of 9![[thin space (1/6-em)]](https://www.rsc.org/images/entities/char_2009.gif) :
:![[thin space (1/6-em)]](https://www.rsc.org/images/entities/char_2009.gif) 1. MCF-7 cells were incubated at 37 °C with CO2 (5%). Trypsin (EDTA 0.02%) was used to re-suspend the cells before plating. An Olympus FV1000 CLSM was employed to observe the cells. At first, MCF-7 cells at 1 × 10⁵ cells per well were seeded in 35 mm confocal dishes, incubated for 24 h, and then treated with CD-PDA-FONs in a fresh medium. After incubation for additional 4 hours, cells were washed three times with PBS to remove the extra FONs and then observed using a confocal fluorescence microscope. The 405 nm lasers with the power density of 2.5 mW were used with the detection scale ranging from 430 to 650 nm.
1. MCF-7 cells were incubated at 37 °C with CO2 (5%). Trypsin (EDTA 0.02%) was used to re-suspend the cells before plating. An Olympus FV1000 CLSM was employed to observe the cells. At first, MCF-7 cells at 1 × 10⁵ cells per well were seeded in 35 mm confocal dishes, incubated for 24 h, and then treated with CD-PDA-FONs in a fresh medium. After incubation for additional 4 hours, cells were washed three times with PBS to remove the extra FONs and then observed using a confocal fluorescence microscope. The 405 nm lasers with the power density of 2.5 mW were used with the detection scale ranging from 430 to 650 nm.
2.6 In vitro cytotoxicity
Herein, 3-(4,5-dimethylthiazol-2-yl)-2,5-diphenyltetrazolium bromide (MTT) reduction assays were used to assess the cytotoxicity of FONs in vitro. The cells were plated in 96-well plates at the density of 5 × 10³ per well. After 24 h, the cells were tightly attached to the plates and then incubated with different concentrations of CD-PDA-FONs in 5% CO2 at 37 °C for 24 h in a humidified incubator. The culture medium in 96 wells was discarded using a microsyringe and adding dimethyl sulfoxide (DMSO, 150 μL) to each well. After the color of each well became stable, the absorbance was determined using a microplate reader (Bio Tek, ELx800). A series of wells without the addition of CD-PDA-FONs was regarded as a blank control. The cytotoxicity was expressed as the percentage of cell viability in comparison to that of the blank control.3. Results and discussion
3.1 Characterization of the CD-PDA-FONs
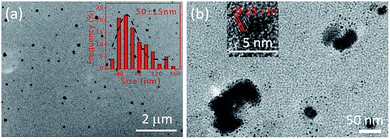
The representative TEM images of the prepared FONs are shown in Fig. 1a; many spherical nanoparticles can be observed, which indicate the successful formation of CD-PDA-FONs through a rather facile method. The SEM image of the prepared CD-PDA-FONs also shows spherical nanoparticles, as shown in Fig. S1.† The average size of the prepared CD-PDA-FONs was about 50 nm, and the particles show relative wide distribution. DLS measurements were also performed to identify the size of the prepared CD-PDA-FONs. As shown in Fig. S2,† the average size was 59 nm, which was in accordance with the TEM results. The structure details are shown in Fig. 1b, as obtained via HR-TEM, which indicate that the nanoparticles are irregular, and the CDs (small black dots) inside them can be clearly observed. Further investigation of the lattice fringes indicated the interplanar spacing of 0.25 nm, corresponding to the (100) diffraction facets of graphite,34,36 thereby confirming that the CDs were successfully assembled into FONs (Fig. S3†).For identifying the structural composition of CD-PDA-FONs, the FT-IR spectra were obtained, as shown in Fig. S4.† The spectra of CDs, CD-PDA-FONs, and PDA-FONs were labeled as curve A, B, and C, respectively. They exhibited similar spectra profiles; specifically, the absorbance bands located between 3200 and 3600 cm−1 could be ascribed to the O–H an N–H vibrations, the small peaks around 2890 cm−1 and 2945 cm−1 could be assigned to the C–H vibration, the peak around 1600 cm−1 and 1650 cm−1 could be assigned to the –COOH groups; and the sharp peak around 1390 cm−1 represented the absorbance of the C–N vibration. The main difference among the three spectra was observed around 1600 cm−1. The spectrum of the CD-PDA-FONs (curve B) shows overlapped peaks and contains both the absorption peak of the –COOH groups from the CDs and the vibration peak of the quinone structures originating from the PDA-FONs. Moreover, the intensity of the absorption peak of the C–N vibration at 1390 cm−1 was weaker than that of the CDs, indicating that the amino group-related reactions occurred between the CDs and PDA. The possible reaction mechanism between the DA molecule and CDs was complex, and various reactions such as the Michael addition reaction, Schiff base reaction, and hydrogen bonding combination were involved.13,37–41
The optical properties were investigated via the absorption and fluorescence spectra. As shown in Fig. 2, the blue, green, and red curve represent the UV-vis absorption spectra of the CDs, PDA-FONs, and CD-PDA-FONs, respectively. The spectrum of the CDs shows two main peaks located at 240 nm and 360 nm, which originate from the π–π* transition provided by the sp2 domain and n–π* transition from the oxygen-related groups, respectively. The spectrum of the control PDA-FONs shows a peak at 280 nm which originates from the DA molecule, and the observed absorption band from 330 nm to 600 nm indicates the polymerization of DA. In the absorption spectra of the CD-PDA-FONs, typical absorption peaks of both PDA and CDs can be observed. Note that the intensity at 280 nm shows a slight decrease as compared to that of the PDA-FONs, which may be caused by higher degree of polymerization in the presence of CDs. The new band peaking at 360 nm can be assigned to the absorption of the templated CDs. These results confirm that the CD-PDA-FONs are a new types of composite nanoparticles, based on CDs and PDA.
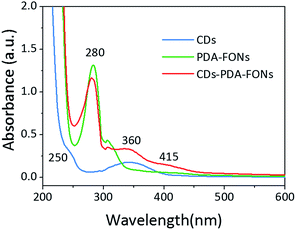 | ||
| Fig. 2 The absorption spectra of the CDs (blue line), PDA-FONs (green line), and CD-PDA-FONs (red line). | ||
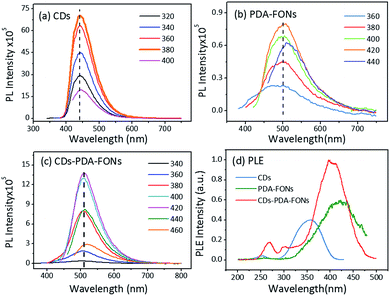
The PL properties were investigated via the PL emission spectra and PLE (photoluminescence excitation) spectra. As shown in Fig. 3a, the emission spectra of the CDs show only one emission band peaking at 440 nm when the excitation wavelength is gradually changed from 320 nm to 400 nm, and its QY measured in an integrated sphere system is 76%. By contrast, the spectrum of pristine PDA-FONs shows one main peak at 500 nm and the emission peak shows a slight shift when the excitation wavelength is changed from 360 nm to 440 nm, as shown in Fig. 3b. The QY of the PDA-FONs was relatively low (1.1%). When the CDs were conjugated with PDA, the prepared CD-PDA-FONs showed main emission peak at 515 nm, and the peak showed a very slight shift (∼5 nm, see Fig. 3c) when the excitation wavelength was changed. The QY of the CD-PDA-FONs was as high as 25%, and as compared to that of the PDA-FONs, the QY of CD-PDA-FONs showed about ten-fold promotion. The images of the PDA-FONs and CD-PDA-FONs under a UV lamp were also obtained to observe the visual difference (see Fig. S5†). Fig. 3d shows the normalized PLE spectra of the CDs (at 450 nm), PDA-FONs (at 500 nm), and CD-PDA-FONs (at 515 nm). In the PLE spectra of the CD-PDA-FONs, three main excitation peaks can be observed, which were located around 268 nm, 300 nm, and 395 nm. The peaks at 268 nm and 300 nm could be attributed to the CDs, and another band around 395 nm could be ascribed to both the CDs and PDA-FONs. These results indicated that the emission of the CD-PDA-FONs was contributed by both the CDs and polymerized DA structures.
The stability of the prepared CD-PDA-FONs was also evaluated, as shown in Fig. S6.† The photostability was measured under continuous radiation using a xenon lamp (50 W), wherein after 5000 seconds, the PL intensity decreased by about 10% (Fig. S6a†). The storage stability (stored at −4 °C in dark) was investigated, as shown in Fig. S6b,† and after 20 days, the fluorescence intensity decreased by about 10%. Fig. S6c† demonstrates the influence of the concentration of NaCl, i.e. when the concentration of NaCl was increased from 0.01 M to 0.1 M, the intensity of the CD-PDA-FONs showed negligible change. Moreover, the influence of pH was investigated (Fig. S6d†), and it was observed that the CD-PDA-FONs showed good stability at the pH value ranging from 5 to 10. These experimental results indicated that the prepared CD-PDA-FONs showed relative good stability under various conditions.
3.2 Formation and PL mechanism of the CD-PDA-FONs
For further investigating the formation mechanism of the CD-PDA-FONs, different CD-PDA-FONs were prepared by controlling the reaction time of polymerization. Fig. 4a shows the TEM image of PDA-FONs without CDs and larger range of aggregation can be observed, similar to previous reports, which can lead to low QY. Fig. 4b–d are the representative TEM images of the FONs prepared at reaction times of 1 h, 5 h, and 10 h; for simplicity, they were named FONs-1, FONs-5, and FONs-10, respectively. It can be observed that the dispersity improved with the increasing reaction time. The absorption spectra of different FONs were obtained and are shown in Fig. S7.† The three main absorption bands showed enhanced intensity when the reaction time was increased, and no obvious shifts were observed in the peak value. The FT-IR spectra were also obtained to examine the chemical structure composition, as shown in Fig. S8;† the spectral profiles for different FONs were found to be very similar, thereby indicating their similar structural composition.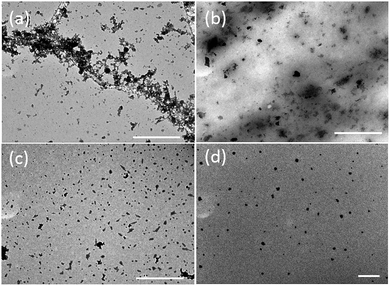 | ||
| Fig. 4 TEM images of the (a) pristine PDA-FONs (b) FONs-1, (c) FONs-5, and (d) FONs-10. The scale bar in all the images is 1 μm. | ||
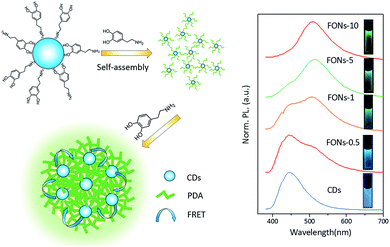
The emission spectra of different FONs were obtained at the same excitation wavelength of 365 nm, as shown in Fig. 5. The emission spectra of different FONs were obtained from 380 nm to 700 nm. Pristine CDs exhibited one emission band at 445 nm. After dopamine was added and copolymerized for 30 minutes, the prepared FONs showed a shoulder peak appearing at around 515 nm, which could be assigned to PDA in contrast with the PL emission of PDA-FONs. With the gradual increase in the reaction time, the emission at 515 nm becomes stronger and the green-colored emission dominates, whereas the emission at 445 nm gradually decreases. When the reaction time reaches 10 h, the formed FONs completely become green emitters. The emission of the FONs gradually evolved from blue, turquoise to green color. This color evolution can be directly observed in the right inset of Fig. 5, and the images of the corresponding FONs under irradiation of a UV lamp at 365 nm can be observed. According to abovementioned analysis, we proposed a possible formation procedure model for CD-PDA-FONs, as illustrated in Fig. 5. In the beginning of the reaction, the DA molecule reacted with CDs on the surface to form an oligomer. Then, a significant number of DA molecules polymerized to form larger nanoparticles with the increasing reaction time.
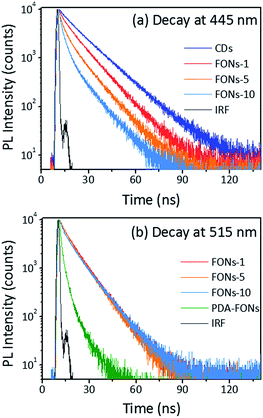
For further investigating the origin of tunable PL emission of the CD-PDA-FONs, the fluorescence decay measurement was performed. The decay at 445 nm for the CDs and different FONs was carried out by a TCSPC system, and all the data were fitted with deconvolution, as shown in Fig. 6a. The fitting parameters are shown in Table S1.† The decay of the CDs alone was bi-exponential with an average lifetime of 13.8 ns. After polymerization with DA, it becomes a tri-exponential fitting function and the average lifetime gradually decreases with the increasing polymerization time.
The average lifetime change can be explained by the FRET effect.32,42–44 Generally, FRET occurs between an energy donor and acceptor. There are two necessary conditions: one is an effective overlap between the absorption spectrum of the acceptor and emission spectrum of the donor and the other is that the distance between the acceptor and donor should be sufficiently shorter (usually below 10 nm). In the CD-PDA-FONs, both conditions for FRET were satisfied. The CDs act as the donor and the PDA plays the role of an acceptor. The spectral overlapping between CDs and PDA is shown in Fig. S9.† The main emission of CDs ranges from 400 nm to 600 nm, which has efficient overlap with the absorption of PDA-FONs. The co-polymerization of the CDs and DA molecule within the same nanoparticles ensured sufficiently close distance. The decay dynamics around 515 nm for different FONs were also obtained and the results were fitted well via a bi-exponential function (see Fig. 6b). The fitting parameters are shown in Table S2.† The decay parameters were similar (∼8 ns in average), but quite different from those of the pristine PDA-FONs, which could be fitted well using a tri-exponential function with the average lifetime of 4.3 ns. The relatively shorter lifetime and lower QY of the pristine PDA-FONs may be caused by the larger aggregation of the PDA-FONs, which was greatly improved after the introduction of the CDs, resulting in improved dispersity and increased lifetime. The FRET efficiency (E) can be estimated by E = 1 − τD*/τD, where τD* is the average lifetime of the donor in presence of an acceptor and τD is the average lifetime of the donor in the absence of an acceptor. The estimated FRET efficiency for the prepared FONs-1, FONs-5, and FONs-10 is 16.7%, 25.4%, and 35.5%, respectively.45,46 The effective FRET also makes the CD-PDA-FONs highly efficient as compared to the pristine PDA-FONs.
3.3 Biological imaging applications of the CD-PDA-FONs
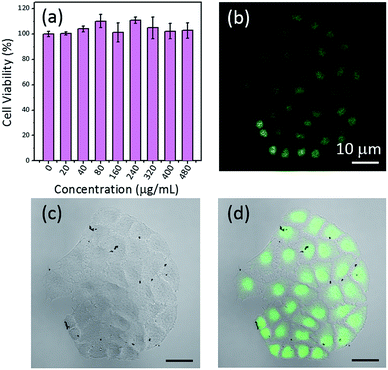
The possible application of the synthesized CD-PDA-FONs as cell-imaging agents was explored. To achieve this application, materials must be highly biocompatible. Thus, an MTT assay was performed using the MCF-7 cell lines to evaluate the cytotoxicity of CD-PDA-FONs in vitro. As shown in Fig. 7a, the prepared CD-PDA-FONs do not impose any significant toxicity to cells and are tolerable even at high concentration (480 μg mL−1). Hence, these is safe for in vitro and in vivo applications. After incubating the MCF-7 cells with the FONs (40 μg mL−1) for 6 h, the living cells were observed via a confocal microscope under a 405 nm laser excitation. Fig. 7b shows the confocal images of the MCF-7 cells treated with the CD-PDA-FONs at the excitation wavelength 405 nm; bright green area inside the MCF-7 cells can be seen, indicating successful translocation of the CD-PDA-FONs through the cell membrane and effective labeling on the cell membrane and nucleus. All these preludes demonstrate that the CD-PDA-FONs have potential applications in the field of biological imaging and are suitable candidates for biosensing and drug delivery.4. Conclusions
In summary, a new type of CD-PDA-FONs was prepared for the first time via the polymerization of DA and CDs. The preparation process was facile, effective, green, and scalable and could be completed at room temperature without any catalyst. The prepared CD-PDA-FONs show high dispersity, high efficiency, and excellent biocompatibility. By controlling the reaction time, different FONs were prepared that showed similar structural compositions but tunable emissions. The spectral overlap and fluorescent decay measurement confirmed that the FRET effect happened between CDs and PDA, leading to high efficiency and tunable emission in different FONs. Lastly, the CD-PDA-FONs were applied to bio-imaging and showed excellent biocompatibility. Due to the existence of reactive functional groups on the surface of the CD-PDA-FONs, many other functional components, such as drugs, targeting agents, and imaging agents, can be further integrated into the CD-PDA-FONs to realize multi-functional applications.Acknowledgements
This work was supported by the National Key Research and Development Program (2016YFC0207101), Major State Basic Research Development Program of China (973 Program) (no. 2014CB643506), program of Chang Jiang Scholars and Innovative Research Team in University (No. IRT13018), and National Natural Science Foundation of China (Grant no. 11374127, 21403084, 11674126, 61674067 and 11674127).Notes and references
- S. Y. Xu, X. L. Bai, J. W. Ma, M. M. Xu, G. F. Hu, T. D. James and L. Y. Wang, Anal. Chem., 2016, 88, 7853–7857 CrossRef CAS PubMed.
- X. Q. Zhang, M. Y. Liu, B. Yang, X. Y. Zhang and Y. Wei, Colloids Surf., B, 2013, 112, 81–86 CrossRef CAS PubMed.
- A. D. Shao, Y. S. Xie, S. J. Zhu, Z. Q. Guo, S. Q. Zhu, J. Guo, P. Shi, T. D. James, H. Tian and W. H. Zhu, Angew. Chem., Int. Ed., 2015, 54, 7275–7280 CrossRef CAS PubMed.
- B. K. An, S. K. Kwon, S. D. Jung and S. Y. Park, J. Am. Chem. Soc., 2002, 124, 14410–14415 CrossRef CAS PubMed.
- K. Li and B. Liu, Chem. Soc. Rev., 2014, 43, 6570–6597 RSC.
- Z. Wang, T. Y. Yong, J. S. Wan, Z. H. Li, H. Zhao, Y. B. Zhao, L. Gan, X. L. Yang, H. B. Xu and C. Zhang, ACS Appl. Mater. Interfaces, 2015, 7, 3420–3425 CAS.
- G. Chen, W. Li, T. Zhou, Q. Peng, D. Zhai, H. Li, W. Z. Yuan, Y. Zhang and B. Z. Tang, Adv. Mater., 2015, 27, 4496–4501 CrossRef CAS PubMed.
- W. Z. Yuan, P. Lu, S. Chen, J. W. Y. Lam, Z. Wang, Y. Liu, H. S. Kwok, Y. Ma and B. Z. Tang, Adv. Mater., 2010, 22, 2159–2163 CrossRef CAS PubMed.
- C.-C. Chang, M.-C. Hsieh, J.-C. Lin and T.-C. Chang, Biomaterials, 2012, 33, 897–906 CrossRef CAS PubMed.
- Y. Liu, K. Ai, J. Liu, M. Deng, Y. He and L. Lu, Adv. Mater., 2013, 25, 1353–1359 CrossRef CAS PubMed.
- X. Y. Zhang, S. Q. Wang, L. X. Xu, L. Feng, Y. Ji, L. Tao, S. X. Li and Y. Wei, Nanoscale, 2012, 4, 5581–5584 RSC.
- A. Yildirim and M. Bayindir, Anal. Chem., 2014, 86, 5508–5512 CrossRef CAS PubMed.
- M. Y. Liu, J. Z. Ji, X. Y. Zhang, X. Q. Zhang, B. Yang, F. J. Deng, Z. Li, K. Wang, Y. Yang and Y. Wei, J. Mater. Chem. B, 2015, 3, 3476–3482 RSC.
- X. Chen, Y. Yan, M. Müllner, M. P. van Koeverden, K. F. Noi, W. Zhu and F. Caruso, Langmuir, 2014, 30, 2921–2925 CrossRef CAS PubMed.
- J.-H. Lin, C.-J. Yu, Y.-C. Yang and W.-L. Tseng, Phys. Chem. Chem. Phys., 2015, 17, 15124–15130 RSC.
- Y. P. Sun, B. Zhou, Y. Lin, W. Wang, K. A. Fernando, P. Pathak, M. J. Meziani, B. A. Harruff, X. Wang, H. Wang, P. G. Luo, H. Yang, M. E. Kose, B. Chen, L. M. Veca and S. Y. Xie, J. Am. Chem. Soc., 2006, 128, 7756–7757 CrossRef CAS PubMed.
- K. Hola, Y. Zhang, Y. Wang, E. P. Giannelis, R. Zboril and A. L. Rogach, Nano Today, 2014, 9, 590–603 CrossRef CAS.
- Y. Wang and A. Hu, J. Mater. Chem. C, 2014, 2, 6921–6939 RSC.
- S. Y. Lim, W. Shen and Z. Gao, Chem. Soc. Rev., 2015, 44, 362–381 RSC.
- P. Miao, K. Han, Y. Tang, B. Wang, T. Lin and W. Cheng, Nanoscale, 2015, 7, 1586–1595 RSC.
- D. Wang, L. Zhu, J.-F. Chen and L. Dai, Nanoscale, 2015, 7, 9894–9901 RSC.
- X. T. Zheng, A. Ananthanarayanan, K. Q. Luo and P. Chen, Small, 2015, 11, 1620–1636 CrossRef CAS PubMed.
- S. Zhu, Y. Song, X. Zhao, J. Shao, J. Zhang and B. Yang, Nano Res., 2015, 8, 355–381 CrossRef CAS.
- Z. X. Gan, H. Xu and Y. L. Hao, Nanoscale, 2016, 8, 7794–7807 RSC.
- W. Liu, C. Li, Y. Ren, X. Sun, W. Pan, Y. Li, J. Wang and W. Wang, J. Mater. Chem. B, 2016, 4, 5772–5788 RSC.
- W. Lu, X. Qin, S. Liu, G. Chang, Y. Zhang, Y. Luo, A. M. Asiri, A. O. Al-Youbi and X. Sun, Anal. Chem., 2012, 84, 5351–5357 CrossRef CAS PubMed.
- J. Wang, C.-F. Wang and S. Chen, Angew. Chem., Int. Ed., 2012, 51, 9297–9301 CrossRef CAS PubMed.
- K. Jiang, S. Sun, L. Zhang, Y. Lu, A. Wu, C. Cai and H. Lin, Angew. Chem., Int. Ed., 2015, 54, 5360–5363 CrossRef CAS PubMed.
- J. B. Essner, C. H. Laber, S. Ravula, L. Polo-Parada and G. A. Baker, Green Chem., 2016, 18, 243–250 RSC.
- A. Zhu, Q. Qu, X. Shao, B. Kong and Y. Tian, Angew. Chem., Int. Ed., 2012, 51, 7185–7189 CrossRef CAS PubMed.
- A. Diac, M. Focsan, C. Socaci, A. M. Gabudean, C. Farcau, D. Maniu, E. Vasile, A. Terec, L. M. Veca and S. Astilean, RSC Adv., 2015, 5, 77662–77669 RSC.
- A. R. Clapp, I. L. Medintz and H. Mattoussi, ChemPhysChem, 2006, 7, 47–57 CrossRef CAS PubMed.
- W. Shi, X. H. Li and H. M. Ma, Angew. Chem., Int. Ed., 2012, 51, 6432–6435 CrossRef CAS PubMed.
- S. Zhu, Q. Meng, L. Wang, J. Zhang, Y. Song, H. Jin, K. Zhang, H. Sun, H. Wang and B. Yang, Angew. Chem., Int. Ed., 2013, 52, 3953–3957 CrossRef CAS PubMed.
- D. Qu, M. Zheng, L. Zhang, H. Zhao, Z. Xie, X. Jing, R. E. Haddad, H. Fan and Z. Sun, Sci. Rep., 2014, 4, 5294 CrossRef CAS PubMed.
- S. Zhu, J. Shao, Y. Song, X. Zhao, J. Du, L. Wang, H. Wang, K. Zhang, J. Zhang and B. Yang, Nanoscale, 2015, 7, 7927–7933 RSC.
- M. J. LaVoie, B. L. Ostaszewski, A. Weihofen, M. G. Schlossmacher and D. J. Selkoe, Nat. Med., 2005, 11, 1214–1221 CrossRef CAS PubMed.
- Q. Ye, F. Zhou and W. M. Liu, Chem. Soc. Rev., 2011, 40, 4244–4258 RSC.
- X. Y. Zhang, M. Y. Liu, Y. L. Zhang, B. Yang, Y. Ji, L. Feng, L. Tao, S. X. Li and Y. Wei, RSC Adv., 2012, 2, 12153–12155 RSC.
- Y. Z. Cao, X. Y. Zhang, L. Tao, K. Li, Z. X. Xue, L. Feng and Y. Wei, ACS Appl. Mater. Interfaces, 2013, 5, 4438–4442 CAS.
- D. R. Dreyer, D. J. Miller, B. D. Freeman, D. R. Paul and C. W. Bielawski, Chem. Sci., 2013, 4, 3796–3802 RSC.
- J. S. Huang, T. Goh, X. K. Li, M. Y. Sfeir, E. A. Bielinski, S. Tomasulo, M. L. Lee, N. Hazari and A. D. Taylor, Nat. Photonics, 2013, 7, 480–486 CrossRef.
- D. Beljonne, C. Curutchet, G. D. Scholes and R. J. Silbey, J. Phys. Chem. B, 2009, 113, 6583–6599 CrossRef CAS PubMed.
- H. T. Chen, S. W. Kim, L. Li, S. Y. Wang, K. Park and J. X. Cheng, Proc. Natl. Acad. Sci. U. S. A., 2008, 105, 6596–6601 CrossRef CAS PubMed.
- I. V. Gopich and A. Szabo, Proc. Natl. Acad. Sci. U. S. A., 2012, 109, 7747–7752 CrossRef CAS PubMed.
- S. Xu, S. Xu, Y. Zhu, W. Xu, P. Zhou, C. Zhou, B. Dong and H. Song, Nanoscale, 2014, 6, 12573–12579 RSC.
Footnote |
| † Electronic supplementary information (ESI) available. See DOI: 10.1039/c7ra03493h |
| This journal is © The Royal Society of Chemistry 2017 |

