 Open Access Article
Creative Commons Attribution 3.0 Unported Licence
Fabrication of core–shell Ag@pDA@HAp nanoparticles with the ability for controlled release of Ag+ and superior hemocompatibility†
Keling Chen a,
Kenan Xiea,
Qin Longa,
Lijun Denga,
Zhiqiang Fua,
Huanhuan Xiaoa and
Lu Xie*b
aSchool of Chemical Engineering, Sichuan University, Chengdu 610065, China
bWest China School of Stomatology, Sichuan University, Chengdu 610041, China. E-mail: Xielu2017@163.com; Tel: +86-15198002007
First published on 6th June 2017
Abstract
Silver nanoparticles (Ag-NPs) are a type of crucial bactericide due to their excellent antibacterial properties. However, the application of Ag-NPs in clinics and in bone tissue engineering is hampered because of their unabiding antibacterial efficacy and undesirable biological properties such as cytotoxicity and inferior hemocompatibility. In this study, Ag-NPs were modified with polydopamine (pDA) and hydroxyapatite (HAp) to prepare novel and multifunctional core (Ag-NPs)–shell (pDA)–shell (HAp) nanoparticles (Ag@pDA@HAp-NPs). The Ag+ release rate was reduced by about 80% on the first day, and then Ag+ was slowly released, which implied that the core–shell Ag@pDA@HAp-NPs could effectively control the release of Ag+. The core–shell Ag@pDA@HAp-NPs could obviously inhibit the growth of E. coli and S. aureus, and the bactericide rate of the Ag@pDA@HAp-NPs was up to 99.99% after being cultured for 24 h. Furthermore, the synthesized Ag@pDA@HAp-NPs exhibited superior hemocompatibility due to the favorable blood compatibility of the pDA coating and HAp shell as well as the controlled release of Ag+. Thus, the core–shell Ag@pDA@HAp-NPs, with the ability for the controlled release of Ag+ and superior hemocompatibility, are promising for reducing cytotoxicity and achieving long-term antibacterial properties, and could have potential applications in clinics and in bone tissue engineering.
1. Introduction
In the processes of organ transplantation, bone replacement and other surgeries, antibacterial agents are inevitably used in order to prevent bacterial infection and reduce the risk of inflammation. In recent decades, antibiotics such as penicillin, cephalosporin, tetracycline and trimethoprim, etc. have seen wide clinical applications in the treatment of pathogenic bacterial infections and have resulted in the lessening or elimination of human morbidity and mortality.1,2 However, the resistance of pathogens has dramatically increased due to the overuse and abuse of antibiotics, which has made pathogen infections difficult to cure.1–3 Along with the advances of nanotechnology, inorganic nanomaterials, especially Ag-NPs, have extensive applications in the biomedical field because of their remarkable physical, chemical and biological properties.4–6 Ag-NPs possess excellent antibacterial properties towards a wide spectrum of pathogens (Gram-positive bacteria, Gram-negative bacteria, fungi and even viruses).7–9 What is more, the pathogens will not develop any resistance to the Ag-NPs. Therefore, the wide application of Ag-NPs can effectively reduce the use of antibiotics, therefore solving the problem of bacterial resistance, which has attracted considerable attention.10However, the application of Ag-NPs in clinics and in bone tissue engineering is hampered because of the cytotoxicity and short-term antibacterial efficacy. After further studies into the antibacterial mechanism and cytotoxicity of Ag-NPs, it is now generally believed that the antibacterial properties and cytotoxicity of Ag-NPs are primarily attributed to the concentration of Ag+.11,12 Large amounts of released Ag+ could not only induce physical damage of the cell membrane, but could also penetrate into the cells, affect cellular signalling and inhibit cell division as well as DNA replication, such that the Ag+ could strongly inhibit and kill cells.1,12 Jonghoon Choi and his co-workers reported that large amounts of released Ag+ can cause damage to the red blood cell membrane and release hemoglobin, thus giving rise to hemolysis.13 Hemolysis may also induce adverse effects such as anemia and hypertension.13 Moreover, the rapid release of Ag+ from materials has limited its long-term antibacterial properties.14,15 Therefore, the controlled release of Ag+ plays a pivotal role in solving the tough problems of high cytotoxicity and unabiding antibacterial efficacy. Ag-containing biomaterials prepared by grafting or blending modification cannot effectively control the release of Ag+. The Ag-NPs in these biomaterials are often exposed to the surfaces of biomaterials, and can be more prone to being oxidized due to their high surface-to-volume ratios and high surface energies, thus resulting in the rapid release of large amounts of Ag+.6,11 Therefore, those biomaterials could not only give rise to stronger bactericidal activity, but could also cause more intense cytotoxicity due to direct contact with human cells.16–19 Nowadays, surface modification of Ag-NPs is carried out to fabricate nanoparticles with core–shell structures with the aim to control the release of Ag+ and to avoid direct contact of Ag-NPs with body tissue and cells. In terms of their properties, core–shell nanoparticles exhibit unique, tailored and anisotropic properties in comparison with those of other multi-layered structural materials.20–22
Another fatal drawback of Ag-NPs is their inferior biological properties such as hemocompatibility and bioactivity, which limits their application in the biomaterials field.17,23 Therefore, we have attempted to improve the biological properties of Ag-NPs by using certain materials with favorable biological properties as the shells of the core–shell Ag-NPs. It is well known that various materials such as noble metals, semiconductors and synthetic polymers, etc. can be modified with pDA because of its strong adhesiveness.24,25 Substrates possess favorable hydrophilicity, hemocompatibility and remarkable antibacterial activity towards Gram-positive and Gram-negative bacteria after modification with pDA.26–28 Moreover, HAp is an ideal bone substitute material due to its favorable bioactivity and biocompatibility and the similarity of its chemical composition to that of natural bone, and it possesses the ability to form strong bonds with bones.16,29,30 Recently, HAp-NPs, especially hollow HAp-NPs, have been regarded as perfect nanocarriers for the delivery of drugs, fluorescent dyes and proteins.31–33 Hollow HAp-NPs improve the drug-loading capacity greatly, and the thin HAp shells can not only effectively control the release of drugs, but can also provide pH-responsive degradability.31,34
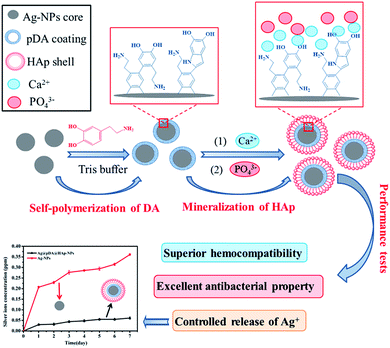
Herein, based on the above design concept, Ag-NPs were modified with pDA and HAp to prepare core–shell Ag@pDA@HAp-NPs with the purpose of controlling the release of Ag+ and endowing Ag-NPs with admirable hemocompatibility, as is shown in Scheme 1. The chelation of Ca2+ with dopamine as well as the electrostatic attraction between Ca2+ and PO43− plays a key role in the nucleation of HAp. It must be said that this method is more effective and convenient than the method of soaking in simulated body fluid (SBF) to prepare HAp.27,35 To the best of our knowledge, this is the first reported synthesis of nanoparticles with a core (Ag-NPs)–shell (pDA)–shell (HAp) structure. The core–shell Ag@pDA@HAp-NPs could contribute to reducing cytotoxicity, achieving long-term antibacterial properties, and widening their applications in clinics and in bone tissue engineering.
2. Materials and methods
2.1. Materials
Calcium nitrate tetra hydrate (Ca(NO3)2·4H2O), diammonium hydrogen phosphate ((NH4)2HPO4), trihydroxymethyl aminomethane (Tris, C4H11NO3), hydrazine hydrate (N2H4·H2O, 80 vol%), silver nitrate (AgNO3), ammonia (NH4OH, 25–28 vol%), soluble starch ((C6H10O5)n) and hydrochloric acid (30%, HCl) were purchased from Kelong Reagent Co., Ltd. (Chengdu, China). Dopamine (DA) and bovine serum albumin (BSA) were obtained from Aladdin Reagent Co., Ltd. (Shanghai, China) and hydroxyapatite (Ca10(PO4)6(OH)2) was purchased from JinSui Biological Technology Co., Ltd. (Shanghai, China). All other chemicals were of analytical reagent grade and were used as received without further purification. All aqueous solutions were prepared with de-ionized water (D.I. water).2.2. Preparation of silver nanoparticles
Ag-NPs were prepared by a liquid reduction method. 0.5 g of soluble starch was uniformly dispersed in 50 mL of D.I. water under vigorous stirring at 60 °C for 6 h. Subsequently, 1 mL of AgNO3 solution (1 mol L−1) was added to the solution. Next, a certain amount of ammonia was slowly dropped into the solution to maintain a pH value of 9 under intensive stirring for 30 min. Afterwards, 1 mL of N2H4·H2O (5 vol%) was added dropwise to the above mixture for the reduction of Ag+. After the reaction, the precipitate was collected by centrifugation and rinsed with D.I. water at least three times to remove any organics on the surfaces of the particles. The resulting products were vacuum freeze-dried for 24 h.2.3. Fabrication of core–shell Ag@pDA nanoparticles
The formation of a uniform pDA coating on the surfaces of materials is attributed to the oxidation and self-polymerization reaction of dopamine in an alkaline solution.35,36 120 mg of the prepared Ag-NPs was homogeneously suspended in 400 mL of Tris buffer (pH = 8.5, 10 mM Tris–HCl) under ultrasonic dispersion for 30 min. Subsequently, dopamine was dissolved in the above solution at a concentration of 3.04 mg mL−1 under vigorous stirring at room temperature for 2 h. The resultant products were then washed with D.I. water at least three times and vacuum freeze-dried for 24 h.2.4. Synthesis of core–shell Ag@pDA@HAp nanoparticles
The aforementioned Ag@pDA-NPs were uniformly dispersed in 200 mL of Ca(NO3)2 aqueous solution (0.5 mol L−1) for 24 h under continuous stirring at ambient temperature. After the reaction, the supernatant was gently poured out. The precipitate was rinsed with D.I. water at least three times, and was then uniformly suspended in 200 mL of (NH4)2HPO4 solution (0.5 mol L−1). The pH of the mixed solution was adjusted to 10 by NH3·H2O under intensive stirring for 6 h at 60 °C. After the reaction, the products were washed with D.I. water at least three times and vacuum freeze-dried for 24 h.2.5. Characterization
FT-IR spectra of the pristine Ag-NPs and core–shell Ag-NPs in the form of KBr pellets were obtained using Fourier-transform infrared spectroscopy (FTIR, Nicolet 750, USA) from 400 cm−1 to 4000 cm−1. The functional groups of the products were identified by analysis of the FT-IR spectra.The phase compositions of the pristine Ag-NPs and core–shell Ag-NPs were examined by X-ray diffraction analysis (XRD, PANalytical B.V., PANalytical) using Cu Kα radiation (λ = 0.154249 nm). The samples were tested over the diffraction angle (2θ) range between 10° and 70° with a scanning step size of 0.026°. Phase analysis was carried out by comparing the sample diffraction pattern with the JCPDS standard XRD card.
A field emission scanning electron microscope (FE-SEM, JSM-7500F, Japan) equipped with energy dispersive X-ray spectroscopy (EDS) was used to analyze the morphologies and elements of the pristine Ag-NPs and core–shell Ag-NPs. Transmission electron microscopy (TEM, TecnaiG2F20S-TWIN, Netherlands) was used to detect the microstructures of the samples. All of the powder samples were ultrasonically dispersed in ethanol to form dilute suspensions. Next, a drop of the dilute suspension was placed onto a copper grid and the solvent was allowed to evaporate in air at ambient temperature before TEM testing.
A laser dynamic light scattering (DLS) instrument (Zetasizer nano ZS, Malvern, UK) was used to examine the zeta potentials and particle size distributions of the as-obtained samples at room temperature. The powder samples were homogeneously dispersed in D.I. water to form dilute suspensions before the zeta-potential and grain size analysis was carried out. X-ray photoelectron spectroscopy (XPS, AXIS Ultra DLD, Kratos Analytical) was used to carry out the surface chemical analysis and qualitative analysis of the elements by using monochromated Al Kα excitation radiation (1486.6 eV).
2.6. Silver ions release
3 mg of pristine Ag-NPs and core–shell Ag@pDA@HAp-NPs were submerged in 15 mL of phosphate buffer solution (PBS, pH = 7.4), respectively. The above mixture was then incubated in an orbital shaker at 120 rpm at 37 °C. At predetermined times (0, 1, 2, 3, 4, 5, 6 and 7 days), 3 mL of the supernatant was collected, and then the mixture was refilled with an equal amount of fresh PBS accordingly. The collected solution was analyzed using inductively coupled plasma-atomic emission spectrometry (ICP-AES, iCAP Q, Thermo Fisher).2.7. Antibacterial tests
Escherichia coli (E. coli, ATCC8739) and Staphylococcus aureus (S. aureus, ATCC6538) were employed to evaluate the antibacterial properties of the samples. The bacteria were cultivated at 37 °C in a liquid Luria Bertani (LB) medium under shaking at 150 rpm for 24 h. 100 μL of the E. coli or S. aureus suspension at a concentration of 106 to 107 CFU mL−1 was coated uniformly onto agar LB medium. Next, HAp-NP paper (a filter paper which contains a certain amount of evenly dispersed HAp-NPs), Ag-NP paper and Ag@pDA@HAp-NP paper were placed onto the aforementioned agar LB medium in order to successfully evaluate the antibacterial properties of the materials and the release-ability of Ag+. After incubating for 24 h at 37 °C, bacterial growth inhibition zones were observed, the sizes of which were evaluated.100 μL of the E. coli suspension or S. aureus suspension at a concentration of 106 to 107 CFU mL−1 and 10 mL of liquid LB medium were added into each sterilized test tube. Three parallel samples of each group were used to evaluate the bacterial growth kinetics. Then, 1 mg of Ag-NPs, HAp-NPs and Ag@pDA@HAp-NPs was further introduced into the aforementioned suspensions, respectively. These solutions were incubated at 37 °C in an orbital shaker for 24 h. The optical density value of the bacteria at 600 nm (OD600) was obtained using a microplate reader (SAF-680T, Shanghai) at various time periods (0, 3, 6, 9, 12 and 15 h). The bacterial solution was serially diluted by 10−5-fold after reacting with the materials for 24 h. In order to visually observe the effect of the materials on the bacteria, 100 μL of the diluted bacterial suspension was coated uniformly onto agar LB medium. The number of bacterial colonies was recorded after culturing for 24 h.
2.8. In vitro hemolysis assay
Acid citrate dextrose (ACD) solution was prepared on the basis of the previously reported method.37 2 mL of ACD solution and 4 mL of fresh rabbit blood were added into a sterile centrifuge tube to prepare ACD blood. Then, 3 mg of the powdered material (HAp-NPs, Ag-NPs and Ag@pDA@HAp-NPs) sterilized by ultraviolet irradiation and 4 mL of normal saline (0.9%) were added into sterile centrifuge tubes, respectively, at 37 °C in a thermostat water bath. After reacting for 30 min, the normal saline was removed. Subsequently, 200 μL of ACD blood was added into the sterile centrifuge tubes and incubated for 20 min. Meanwhile, 200 μL of ACD blood was added into two additional sterile centrifuge tubes for use as positive and negative control groups and these were incubated under the above conditions. After that, 4 mL of normal saline was added to each sterile centrifuge tube, while 4 mL of deionized water was added to the negative control group, before being incubated for 1 h. After the reaction, the resulting mixture was separated by centrifugation at 1000 rpm for 5 min. The optical density (OD) values of the supernatants were obtained using a microplate reader (SAF-680T, Shanghai) at 540 nm. The percentage of hemolysis was calculated using the following equation:37Rabbits were obtained from the Laboratory Animal Center of Sichuan University. Animal welfare and the relevant experiments were carried out in compliance with the Guide for the Care and Use of Laboratory Animals, published by the National Academy of Sciences. The experiments were also approved by the ethics committee of Sichuan University.
2.9. In vitro protein adsorption tests
BSA was used in the static protein adsorption experiments. BSA was added into 0.5 M PBS buffer solution (pH = 7.4) to prepare a BSA solution with a concentration of 50 μg mL−1. 3 mg of the powdered material (HAp-NPs, Ag-NPs and Ag@pDA@HAp-NPs) sterilized by ultraviolet irradiation was immersed into 5 mL of BSA solution, respectively. The aforementioned mixtures and the control groups (BSA solution without nanoparticles and a nanoparticle solution without BSA) were incubated at 37 °C under shaking at 100 rpm for 1 h. After the reaction, the resulting mixture was separated by centrifugation at 1000 rpm for 10 min and the amount of BSA in the supernatant was examined using a microplate reader (SAF-680T, Shanghai) at 280 nm. The adsorption capacity of BSA (mg g−1) was calculated using the following equation:38where Q (mg g−1) is the adsorption capacity of BSA, C0 and Ca (μg mL−1) are, respectively, the initial concentration of the BSA solution and the concentration of BSA after reacting with the materials for 1 h, V (mL) is the volume of the BSA solution, and M is the weight of the nanoparticles.
2.10. Statistical analysis
All experiments were conducted in triplicate, and the data points were expressed as the mean. A value of p < 0.05 was considered significant.3. Results and discussion
3.1. Morphological observation
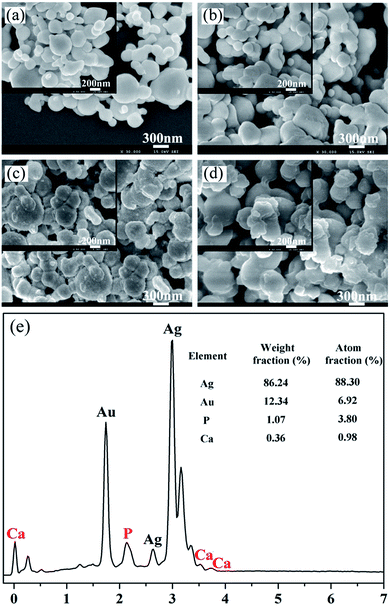
Fig. 1 shows the morphologies of the pristine Ag-NPs and the as-synthesized core–shell Ag-NPs. The inset images show higher-magnification SEM images of the corresponding samples. The prepared Ag-NPs possessed irregular spherical structures and exhibited an uneven size distribution (Fig. 1a). The SEM images of the core–shell Ag-NPs, as shown in Fig. 1b–d, demonstrate that the extent of aggregation of Ag-NPs increased after they were surface modified. In addition, the surfaces of the Ag@pDA-NPs became rougher as the reaction time increased. To further confirm the chemical composition of the as-obtained core–shell Ag-NPs, EDX analysis was carried out. Ca and P signals were clearly observed in the EDX spectrum of the Ag@pDA@HAp-NPs and a Ca/P ratio of 1![[thin space (1/6-em)]](https://www.rsc.org/images/entities/char_2009.gif) :
:![[thin space (1/6-em)]](https://www.rsc.org/images/entities/char_2009.gif) 3.8 was demonstrated, which implied the formation of apatite.
3.8 was demonstrated, which implied the formation of apatite.
The microstructures of the Ag-NPs and the as-obtained core–shell Ag-NPs were observed by TEM analysis, as shown in Fig. 2. Fig. 2a shows a TEM image of the Ag-NPs. TEM images of the Ag@pDA-NPs prepared for 2 h (Fig. 2b) and 6 h (Fig. 2c) clearly show that the pDA coating was successfully coated onto the surfaces of the Ag-NPs. The thickness of the pDA coating of the Ag@pDA-NPs-2 h and Ag@pDA-NPs-6 h was found to be 31.385 ± 2.145 nm and 34.102 ± 1.377 nm, respectively. This implies that there was no significant increase in the thickness of the pDA coating after a reaction time of 6 h compared to 2 h. The TEM image of Ag@pDA@HAp-NPs (Fig. 2d) shows that the Ag-NPs were completely coated with amorphous apatite. This provides good evidence that Ag@pDA@HAp-NPs with an obvious core–shell structure were successfully fabricated.
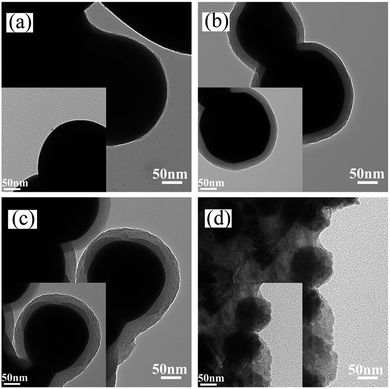 | ||
| Fig. 2 TEM images of Ag-NPs (a), Ag@pDA-NPs fabricated at different reaction times: 2 h (b), 6 h (c), and Ag@pDA@HAp-NPs (d). | ||
3.2. Particle size distribution and zeta potential
A dynamic light-scattering technique was used to investigate the particle size distribution (PSD) of the pristine Ag-NPs and the as-synthesized core–shell Ag-NPs suspension (Fig. S1†). The test results suggested that the average particle sizes of the Ag-NPs, Ag@pDA-NPs and Ag@pDA@HAp-NPs were about 91.2 ± 8.2 nm, 135.1 ± 5.6 nm and 590.4 ± 10.1 nm, respectively (Table 1). Combined with the SEM and TEM results, this implied that the surfaces of the Ag-NPs were successfully coated with a pDA coating and HAp, thus resulting in the enhancement in the particle sizes.| Sample name | Size (mean ± SD) (nm) | Zeta potential (mean ± SD) (mV) |
|---|---|---|
| Ag-NPs | 91.2 ± 8.2 | −23.33 ± 0.69 |
| Ag@pDA-NPs | 135.1 ± 5.6 | −22.20 ± 0.95 |
| Ag@pDA@HAp-NPs | 590.4 ± 10.1 | −20.28 ± 0.70 |
The zeta potentials of the pristine Ag-NPs and the as-synthesized core–shell Ag-NPs suspension were obtained in order to reveal any changes in the surface charges of the specimens, which could confirm the formation of core–shell nanoparticles (Table 1). The zeta potential of the Ag-NPs was about −23.33 ± 0.69 mV, which was potentially attributed to the positive charges on the surfaces of the Ag-NPs. During the self-polymerization of dopamine process, phenolic hydroxyl groups were oxidized to quinone groups (C![[double bond, length as m-dash]](https://www.rsc.org/images/entities/char_e001.gif) O),25 and the dissociation of quinone groups and imine groups under alkaline conditions led to a pDA surface with negative charges.39 Those negative surface charges could neutralize a portion of the positive charges on the surfaces of the Ag-NPs. Therefore, the zeta potential of the Ag-NPs increased to −22.20 ± 0.95 mV, after modification with pDA. After surface modification with HAp, the zeta potential of the Ag@pDA-NPs increased to −20.28 ± 0.70 mV, which implied the formation of HAp on the surfaces of the samples. There was only a small difference in the zeta potential among the three materials because the amount of pDA or HAp in the Ag@pDA@HAp-NPs was relatively small.
O),25 and the dissociation of quinone groups and imine groups under alkaline conditions led to a pDA surface with negative charges.39 Those negative surface charges could neutralize a portion of the positive charges on the surfaces of the Ag-NPs. Therefore, the zeta potential of the Ag-NPs increased to −22.20 ± 0.95 mV, after modification with pDA. After surface modification with HAp, the zeta potential of the Ag@pDA-NPs increased to −20.28 ± 0.70 mV, which implied the formation of HAp on the surfaces of the samples. There was only a small difference in the zeta potential among the three materials because the amount of pDA or HAp in the Ag@pDA@HAp-NPs was relatively small.
3.3. X-ray diffraction analysis
The crystalline structures of the samples were investigated using XRD analysis. As shown in Fig. S2,† the XRD patterns of the as-obtained materials were very similar. Three intense diffraction peaks were detected at 2θ values of 38.12°, 44.27° and 64.43° corresponding to the (111), (200) and (220) planes, which matched well with the JCPDS standard XRD card no. 04-0783 for Ag. After being modified with pDA, the XRD patterns of the samples did not change, which implied that pDA did not change the crystal structure of the Ag-NPs. After being coated with HAp on the surface, HAp characteristic peaks were not detected by XRD, indicating that the small amount of HAp present was outside the scope of testing.3.4. FTIR spectra analysis
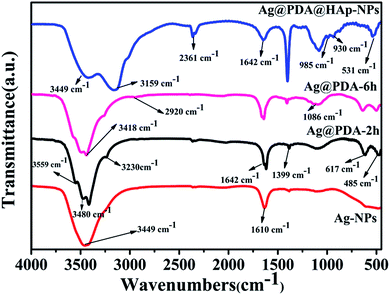
The FTIR spectra of the pristine Ag-NPs and the as-synthesized core–shell Ag-NPs are shown in Fig. 3. In the four FTIR spectra curves, the peaks at about 3449 cm−1 and 1642 cm−1 are associated with water molecules. The peaks detected at 1399 cm−1 and 2361 cm−1 correspond to the vibrations of CO32−, which was assigned to the dissolution of CO2 from the air. Compared with the spectra of samples without modification with HAp, the intensities of the CO32− vibrational absorption peaks were prominently enhanced because of its partial substitution of PO43− during the formation process of HAp.23 After reacting for different times, the surfaces of the Ag-NPs were covered with different thicknesses of pDA, and the typical peaks of Ag@PDA-2 h were similar to those of Ag@PDA-6 h. It is remarkable that the peak at 485 cm−1 might be attributed to the stretching vibration of C![[double bond, length as m-dash]](https://www.rsc.org/images/entities/char_e001.gif) O. The peak detected at 1610 cm−1 potentially corresponds to the resonance vibration of C
O. The peak detected at 1610 cm−1 potentially corresponds to the resonance vibration of C![[double bond, length as m-dash]](https://www.rsc.org/images/entities/char_e001.gif) C in an aromatic ring and the bending vibration of N–H in pDA.40 According to the previous literature, the appearance of a weak peak at 2920 cm−1 was attributed to the asymmetric vibration of C–H2.26,40 The typical peaks of pDA at 3230 cm−1 and 3418 cm−1 were potentially attributed to the role of intermolecular hydrogen bonds that exist in pDA molecules. The absorption peaks at 3480 cm−1 and 3559 cm−1 correspond to the O–H and N–H vibrations in the pDA coating. These results suggest that pDA was successfully deposited on the surfaces of the Ag-NPs. Several new peaks at 531 cm−1, 930 cm−1, 985 cm−1, 1086 cm−1, 3159 cm−1 and 3733 cm−1 in the spectrum of the Ag@pDA@HAp-NPs revealed the obvious formation of HAp. The presence of the characteristic peaks at 531 cm−1, 930 cm−1, 985 cm−1 and 1086 cm−1 could be related to PO43− vibration absorption, which is consistent with the reported literature.41 Furthermore, the peaks that emerge at 531 cm−1 and 1086 cm−1 potentially correspond to the P–O bending vibrational absorption and P–O–P stretching vibrational absorption of PO43−, respectively. In addition, the broad absorption band at 3159 cm−1 is attributed to the stretching and bending vibrations of –OH groups in HAp. These results confirmed that HAp was successfully coated on the surfaces of the Ag@pDA-NPs.
C in an aromatic ring and the bending vibration of N–H in pDA.40 According to the previous literature, the appearance of a weak peak at 2920 cm−1 was attributed to the asymmetric vibration of C–H2.26,40 The typical peaks of pDA at 3230 cm−1 and 3418 cm−1 were potentially attributed to the role of intermolecular hydrogen bonds that exist in pDA molecules. The absorption peaks at 3480 cm−1 and 3559 cm−1 correspond to the O–H and N–H vibrations in the pDA coating. These results suggest that pDA was successfully deposited on the surfaces of the Ag-NPs. Several new peaks at 531 cm−1, 930 cm−1, 985 cm−1, 1086 cm−1, 3159 cm−1 and 3733 cm−1 in the spectrum of the Ag@pDA@HAp-NPs revealed the obvious formation of HAp. The presence of the characteristic peaks at 531 cm−1, 930 cm−1, 985 cm−1 and 1086 cm−1 could be related to PO43− vibration absorption, which is consistent with the reported literature.41 Furthermore, the peaks that emerge at 531 cm−1 and 1086 cm−1 potentially correspond to the P–O bending vibrational absorption and P–O–P stretching vibrational absorption of PO43−, respectively. In addition, the broad absorption band at 3159 cm−1 is attributed to the stretching and bending vibrations of –OH groups in HAp. These results confirmed that HAp was successfully coated on the surfaces of the Ag@pDA-NPs.
3.5. XPS analysis
Fig. 4 presents the surface chemical analysis of the Ag@pDA-NPs and Ag@pDA@HAp-NPs, which was estimated by XPS. According to the survey spectra, Ag, O, N and C elements were detected on the surfaces of the Ag@pDA-NPs, which supported the presence of Ag and pDA. Additionally, P and Ca elements could be observed in the survey spectra of Ag@pDA@HAp-NPs, thus confirming the appearance of HAp.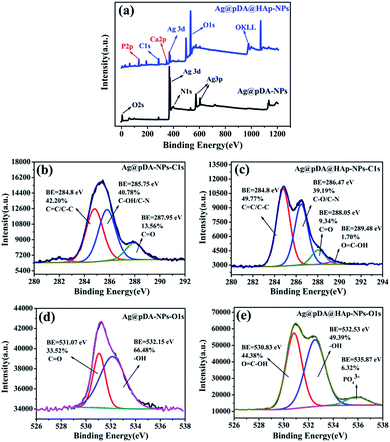 | ||
| Fig. 4 XPS survey spectra for Ag@pDA-NPs and Ag@pDA@HAp-NPs (a), C 1s XPS spectra of Ag@pDA-NPs (b) and Ag@pDA@HAp-NPs (c), and O 1s XPS spectra of Ag@pDA-NPs (d) and Ag@pDA@HAp-NPs (e). | ||
The high resolution C 1s spectra of the Ag@pDA-NPs and Ag@pDA@HAp-NPs were shown in Fig. 4b and c, respectively. It is obvious that the C 1s spectra of the two materials consist of four characteristic peaks ranging from 280 eV to 292 eV. The typical C 1s peaks of the Ag@pDA-NPs detected at binding energies of 287.95 eV and 284.8 eV were ascribed to C![[double bond, length as m-dash]](https://www.rsc.org/images/entities/char_e001.gif) O (13.56%) and C
O (13.56%) and C![[double bond, length as m-dash]](https://www.rsc.org/images/entities/char_e001.gif) C/C–C (42.20%), respectively.42 Furthermore, the binding energy of 285.75 eV may be attributed to C–OH and C–N.43,44 The C
C/C–C (42.20%), respectively.42 Furthermore, the binding energy of 285.75 eV may be attributed to C–OH and C–N.43,44 The C![[double bond, length as m-dash]](https://www.rsc.org/images/entities/char_e001.gif) C/C–C, C–OH, C–N and C
C/C–C, C–OH, C–N and C![[double bond, length as m-dash]](https://www.rsc.org/images/entities/char_e001.gif) O groups were ascribed to an aromatic carbon chain, phenolic hydroxyl groups, amidogen and quinone, respectively, thus confirming the existence of pDA. The binding energies of C
O groups were ascribed to an aromatic carbon chain, phenolic hydroxyl groups, amidogen and quinone, respectively, thus confirming the existence of pDA. The binding energies of C![[double bond, length as m-dash]](https://www.rsc.org/images/entities/char_e001.gif) O and C–N/C–OH investigated at 287.95 eV and 285.75 eV have both shifted to higher energies detected at 288.05 eV and 286.47 eV, after the formation of HAp on the surfaces of the Ag@pDA-NPs. The catechol and quinone groups in pDA were used to chelate Ca2+, thus resulting in the change of chemical environment.45 It is worthwhile to note that a new sub-peak appeared at 289.48 eV which confirmed the existence of O
O and C–N/C–OH investigated at 287.95 eV and 285.75 eV have both shifted to higher energies detected at 288.05 eV and 286.47 eV, after the formation of HAp on the surfaces of the Ag@pDA-NPs. The catechol and quinone groups in pDA were used to chelate Ca2+, thus resulting in the change of chemical environment.45 It is worthwhile to note that a new sub-peak appeared at 289.48 eV which confirmed the existence of O![[double bond, length as m-dash]](https://www.rsc.org/images/entities/char_e001.gif) C–OH (1.70%).46 The appearance of C
C–OH (1.70%).46 The appearance of C![[double bond, length as m-dash]](https://www.rsc.org/images/entities/char_e001.gif) O, C–OH and O
O, C–OH and O![[double bond, length as m-dash]](https://www.rsc.org/images/entities/char_e001.gif) C–OH indicated that the self-polymerization mechanism of pDA was in accordance with that raised by Nicola F. et al.
C–OH indicated that the self-polymerization mechanism of pDA was in accordance with that raised by Nicola F. et al.
The information provided by the O 1s spectra could be used to complement that provided by the C 1s spectra due to the fact that the lower photoelectron kinetic energies and the smaller sampling depth of O 1s make the O 1s spectra slightly more surface-specific.47 The high resolution O 1s spectra of the Ag@pDA-NPs and Ag@pDA@HAP-NPs are presented in Fig. 4d and e, respectively. For these two materials, the O 1s spectra ranging from 526 eV to 538 eV consist of two and three characteristic peaks, respectively. The characteristic O 1s peaks of the Ag@pDA-NPs at binding energies of 531.07 eV and 532.15 eV might be assigned to C![[double bond, length as m-dash]](https://www.rsc.org/images/entities/char_e001.gif) O and –OH, respectively.40,48 After modification with HAp, a binding energy emerged at 530.83 eV which corresponded to O
O and –OH, respectively.40,48 After modification with HAp, a binding energy emerged at 530.83 eV which corresponded to O![[double bond, length as m-dash]](https://www.rsc.org/images/entities/char_e001.gif) C–OH, which was in accordance with the results obtained from the C 1s spectra.47 The typical peak of –OH, observed at 532.15 eV, shifted to a higher binding energy and emerged at 532.53 eV. Combined with the results of the C 1s spectra, this may be attributed to the chelation of Ca2+ with the catechol in pDA. It may also be attributed to –OH in HAp.49 Additionally, the binding energy at 535.87 eV was attributed to PO43− of HAp.
C–OH, which was in accordance with the results obtained from the C 1s spectra.47 The typical peak of –OH, observed at 532.15 eV, shifted to a higher binding energy and emerged at 532.53 eV. Combined with the results of the C 1s spectra, this may be attributed to the chelation of Ca2+ with the catechol in pDA. It may also be attributed to –OH in HAp.49 Additionally, the binding energy at 535.87 eV was attributed to PO43− of HAp.
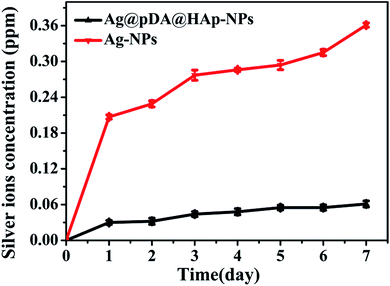 | ||
| Fig. 5 Ag+ release curves of the Ag-NPs and Ag@pDA@HAp-NPs. Each symbol indicates the mean ± the standard error averaged over three observations. | ||
The high resolution N 1s spectra of the Ag@pDA-NPs and Ag@pDA@HAp-NPs are provided in Fig. S3a and b,† respectively. According to the literature, the peak at 399.4 eV is typical for an amine NH.50 After decoration with HAp, the binding energy of the typical amine peak increased from 399.33 eV to 399.52 eV, which may be attributed to the chelation of Ca2+ with the amine in pDA. The peak at the binding energy of 401.23 eV with the bulk peak area could be assigned to a protonated amine that derives from ammonia, which was employed to adjust the pH.51 As shown in Fig. S3c,† the high resolution spectra of Ag 3d5/2 (at about 368.15 eV) and Ag 3d3/2 (at about 374.15 eV) for the Ag@pDA-NPs and Ag@pDA@HAp-NPs implied the existence of the Ag element. The high resolution P 2p spectrum of the Ag@pDA@HAp-NPs could be separated into two sub-peaks, as shown in Fig. S3e.† The binding energy observed at 133.41 eV corresponded to PO43− of HAp and the binding energy at 132.82 eV was attributed to PO43− of calcium phosphate (Ca3(PO4)2).49 The high resolution Ca 2p spectrum of the Ag@pDA@HAp-NPs consisted of a doublet, as shown in Fig. S3d.† The characteristic peaks of Ca 2p3/2 at 347.12 eV and Ca 2p1/2 at 350.67 eV were attributed to Ca3(PO4)2 and Ca10(PO4)6(OH)2.49,52
3.6. Ag+ release analysis
It is well known that the antibacterial properties and cytotoxicity of Ag-NPs primarily depend on the concentration of the released Ag+. The controlled release of Ag+ is expected to reduce the cytotoxicity and achieve long-term antibacterial properties. Fig. 5 displays the Ag+ release curves of the pure Ag-NPs and Ag@pDA@HAp-NPs. Ag+ was released from the pure Ag-NPs with a burst release rate on the first day, and then with a slow release rate over the next 6 days. However, the Ag+ release rate of the Ag@pDA@HAp-NPs was reduced by about 80% on the first day, and Ag+ was released with a slower release rate over the whole releasing process. This implied that the Ag@pDA@HAp-NPs could achieve a sustained release of Ag+. In addition, the concentration of released Ag+ from the Ag-NPs (0.361 μg mL−1) was about 6 times higher than that from the Ag@pDA@HAp-NPs (0.061 μg mL−1), after being incubated for 7 days. The oxidation of the Ag-NPs and the hydrolysis of silver oxide (AgO) play key roles in the release of Ag+.53 Specifically, Ag-NPs are oxidized to silver oxide (AgO) in aqueous solution, and then the hydrolysis of AgO produces Ag+. The chemical equations are as follows:11| 2Ag + O2 → 2AgO | (1) |
| 2Ag2O + 4H+ → 4Ag+ + 2H2O | (2) |
Therefore the Ag-NPs exposed to air-saturated aqueous solutions could be more prone to being oxidized, thus resulting in the rapid release of large amounts of Ag+ within a short time. The oxidation rate of the Ag-NPs was significantly decreased when the compact oxidation film formed on the surfaces of the Ag-NPs, which led to a slowdown in the Ag+ release rate.54 Pedro J. J. Alvarez and his co-workers confirmed that no Ag+ was released from Ag-NPs under strict anaerobic conditions.11 The dense pDA coating and HAp shell could effectively avoid the direct contact of the Ag-NPs with air-saturated aqueous solutions, and only trace amounts of oxygen (O2) and hydrogen ions (H+) reacted with the Ag-NPs. Thus Ag+ was released from the Ag@pDA@HAp-NPs with a slower release rate over the whole releasing process.
3.7. Antibacterial tests analysis
In this study, bacterial growth inhibition zones were used to evaluate the antibacterial properties of the materials and the release-ability of Ag+. As is shown in Fig. 6, the bacterial growth inhibition zones around the Ag-NP papers and Ag@pDA@HAp-NP papers could be easily observed. This revealed that both types of materials exhibited favorable antibacterial properties. In addition, the sizes of the bacterial growth inhibition zones around the Ag-NP paper and Ag@pDA@HAp-NP paper for S. aureus were 3.14 ± 0.04 mm and 1.42 ± 0.03 mm, respectively (Table S1†). The sizes of the bacterial growth inhibition zones around the Ag-NP paper and Ag@pDA@HAp-NP paper for E. coli were 3.22 ± 0.09 mm and 1.05 ± 0.09 mm, respectively (Table S1†). Therefore, the bacterial growth inhibition zones around the Ag-NP papers were significantly larger than those around the Ag@pDA@HAp-NP papers against both S. aureus and E. coli. This further indicated that the Ag@pDA@HAp-NPs could successfully control the release of Ag+.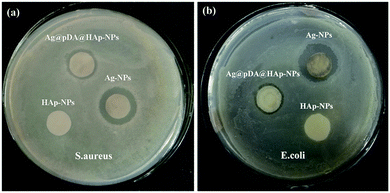 | ||
| Fig. 6 Growth inhibition zones of the HAp-NPs, Ag-NPs and Ag@pDA@HAp-NPs against S. aureus (a) and E. coli (b). | ||
The growth curves of S. aureus and E. coli were used to evaluate the effect of the nascent and decorated Ag-NPs on the bacterial growth kinetics. As is shown in Fig. 7, HAp had little effect on the growth of S. aureus and E. coli. Both the Ag-NPs and the Ag@pDA@HAp-NPs noticeably inhibited the growth of S. aureus and E. coli. This demonstrated that the Ag@pDA@HAp-NPs exhibited prominent antibacterial effects in spite of only releasing very small amounts of Ag+. It was reported that pDA exhibits strong antibacterial efficacy.28 Thus the dual antibacterial effects of pDA and Ag+ may be an underlying reason for the enhanced antibacterial properties of the Ag@pDA@HAp-NPs.
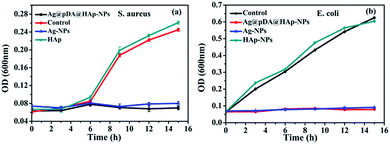 | ||
| Fig. 7 Growth curves of S. aureus (a) and E. coli (b) with the effect of the Ag@pDA@HAp-NPs, Ag-NPs and HA-NPs. Each symbol indicates the mean ± the standard error averaged over three observations. | ||
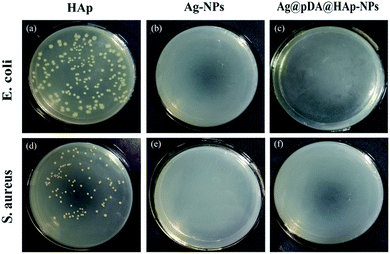
In order to visually observe the effect of the materials on the bacteria, the bacteria suspension after 24 h of reacting with the material was coated uniformly onto agar LB media. The antibacterial results, as shown in Fig. 8, were investigated after 24 h of incubation. It was apparent that the Ag-NPs and Ag@pDA@HAp-NPs killed more than 99.99% of S. aureus and E. coli, thus suggesting that the Ag@pDA@HAp-NPs exhibited superior antibacterial properties.
3.8. In vitro hemolysis assay analysis
The hemocompatibility of materials is one of the important biological properties for biomaterials. Hemolysis can occur if Ag-NPs directly interact with blood, which may lead to anemia, hypertension and renal toxicity.13 In this study, the percentage of hemolysis was used to evaluate the hemocompatibility of the substrates, with the results shown in Fig. 9. The percentage of hemolysis was less than 5%, thus implying the existence of excellent hemocompatibility.37 Obviously, the hemolysis rates of the three materials were much lower than 5%, which is regarded as a biosafety threshold, and thus the results demonstrate excellent hemocompatibility. It was evident that the hemolysis rate of the Ag@pDA@HAp-NPs (1.115%) was close to that of HAp (1.083%). This proved that the blood compatibility of the Ag-NPs was significantly improved, after modification with pDA and HAp.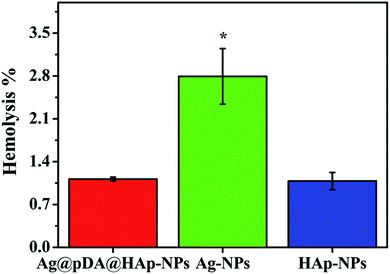 | ||
| Fig. 9 Hemolysis of the Ag@pDA@HAp-NPs, Ag-NPs and HAp-NPs. Each symbol indicates the mean ± the standard error averaged over three observations. * represents p < 0.05 between the groups. | ||
3.9. In vitro protein adsorption tests analysis
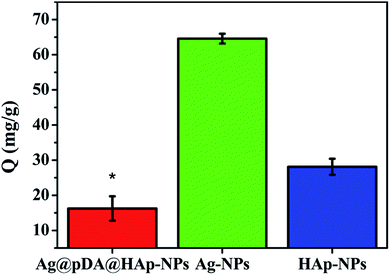
Protein adsorption onto materials promotes the release of blood coagulation factors from activated platelets and the formation of thrombosis.55 Therefore, protein adsorption is a crucial indicator for evaluating the hemocompatibility of biomaterials. Fig. 10 shows the adsorption capacities of BSA (Q) onto the Ag@pDA@HAp-NPs, Ag-NPs and HAp-NPs. As is shown in Fig. 10, the adsorption capacity of BSA onto the Ag-NPs (64.58 mg g−1) was much higher than that onto the HAp-NPs (28.12 mg g−1) and Ag@pDA@HAp-NPs (16.27 mg g−1), which implied that the Ag@pDA@HAp-NPs exhibited superior hemocompatibility. There are three conceivable reasons to explain the excellent hemocompatibility of the Ag@pDA@HAp-NPs: (1) the HAp shell and the amine groups of the pDA coating could improve the blood compatibility,37,56 (2) the Ag@pDA@HAp-NPs could effectively control the release of Ag+ and (3) they could avoid the direct contact of Ag-NPs with red blood cells. Therefore, the as-obtained core–shell Ag-NPs can be widely used in the field of biological materials as a clinical and multifunctional antibacterial agent.4. Conclusion
In summary, we have reported a convenient and effective method to prepare Ag-NPs and core–shell Ag@pDA@HAp-NPs. In this study, pDA and HAp were uniformly coated on the surfaces of the Ag-NPs, so that core–shell Ag@pDA@HAp-NPs were successfully fabricated. The results revealed that the Ag@pDA@HAp-NPs could effectively control the release of Ag+. On account of the intense antibacterial effects of the Ag@pDA@HAp-NPs, the bactericide rate of the Ag@pDA@HAp-NPs was up to 99.99%, after being cultured for 24 h. In addition, the hemolysis rate of the Ag@pDA@HAp-NPs was close to that of HAp, and the adsorption capacity of BSA onto the Ag@pDA@HAp-NPs was obviously lower than that onto the Ag-NPs. This implied that after surface modification with pDA and HAp, the blood compatibility of the Ag-NPs was significantly improved. Thus, the as-obtained Ag@pDA@HAp-NPs could effectively reduce or eliminate the negative effects of Ag-NPs, thus greatly broadening the applications of Ag-NPs in clinics and in bone tissue engineering.Acknowledgements
This work was supported by the financial support from the scientific research foundation of Sichuan University.References
- L. Rizzello and P. P. Pompa, Chem. Soc. Rev., 2014, 45, 1501–1518 RSC
.
- D. I. Andersson and D. Hughes, Nat. Rev. Microbiol., 2010, 8, 260–271 CAS
.
- M. J. Schwaber, T. Demedina and Y. Carmeli, Nat. Rev. Microbiol., 2004, 2, 979–983 CrossRef CAS PubMed
.
- S. Pal, Y. K. Tak and J. M. Song, Appl. Environ. Microbiol., 2007, 73, 1712 CrossRef CAS PubMed
.
- Q. Tang, J. Liu, L. K. Shrestha, K. Ariga and Q. Ji, ACS Appl. Mater. Interfaces, 2016, 8, 18922–18929 CAS
.
- G. Chen, I. Roy, C. Yang and P. N. Prasad, Chem. Rev., 2016, 116, 2826–2885 CrossRef CAS PubMed
.
- M. Vukomanović, U. Repnik, T. Zavašnikbergant, R. Kostanjšek, S. D. Škapin and D. Suvorov, ACS Biomater. Sci. Eng., 2015, 1, 935–946 CrossRef
.
- M. Gajbhiye, J. Kesharwani, A. Ingle, A. Gade and M. Rai, Nanomedicine, 2009, 5, 382–386 CrossRef CAS PubMed
.
- K. Zodrow, L. Brunet, S. Mahendra, D. Li, A. Zhang, Q. Li and P. J. Alvarez, Water Res., 2009, 43, 715–723 CrossRef CAS PubMed
.
- H. Bo, W. Ning, H. Lu, C. Ming-Li and W. Jian-Hua, Acta Biomater., 2015, 11, 511–519 CrossRef PubMed
.
- Z. Xiu, Q. Zhang, H. L. Puppala, V. L. Colvin and P. J. J. Alvarez, Nano Lett., 2012, 12, 4271–4275 CrossRef CAS PubMed
.
- M. K. Rai, S. D. Deshmukh, A. P. Ingle and A. K. Gade, J. Appl. Microbiol., 2012, 112, 841–852 CrossRef CAS PubMed
.
- J. Choi, V. Reipa, V. M. Hitchins, P. L. Goering and R. A. Malinauskas, Toxicol. Sci., 2011, 123, 133–143 CrossRef CAS PubMed
.
- C. Damm, H. Münstedt and A. Rösch, J. Mater. Sci., 2007, 42, 6067–6073 CrossRef CAS
.
- X. Yan, S. Li, Y. Pan, B. Xing, R. Li, B. W. L. Jang and X. Liu, RSC Adv., 2015, 5, 39384–39391 RSC
.
- G. Sahni, P. Gopinath and P. Jeevanandam, Colloids Surf., B, 2013, 103, 441–447 CrossRef CAS PubMed
.
- L. Zhao, H. Wang, K. Huo, L. Cui, W. Zhang, H. Ni, Y. Zhang, Z. Wu and P. K. Chu, Biomaterials, 2011, 32, 5706–5716 CrossRef CAS PubMed
.
- M. Ramstedt, B. Ekstrand-Hammarström, A. V. Shchukarev, A. Bucht, L. Österlund, M. Welch and W. T. S. Huck, Biomaterials, 2009, 30, 1524–1531 CrossRef CAS PubMed
.
- E. Navarro, F. Piccapietra, B. Wagner, F. Marconi, R. Kaegi, N. Odzak, L. Sigg and R. Behra, Environ. Sci. Technol., 2008, 42, 8959–8964 CrossRef CAS PubMed
.
- T. Mitsudome, T. Urayama, K. Yamazaki, Y. Maehara, J. Yamasaki, K. Gohara, Z. Maeno, T. Mizugaki, K. Jitsukawa and K. Kaneda, ACS Catal., 2016, 6, 666–670 CrossRef CAS
.
- J. Jang, J. Ha and B. Lim, Chem. Commun., 2006, 6, 1622–1624 RSC
.
- Y. Okuno, K. Nishioka, A. Kiya, N. Nakashima, A. Ishibashi and Y. Niidome, Nanoscale, 2010, 2, 1489–1493 RSC
.
- S. Eraković, A. Janković, D. Veljović, E. Palcevskis, M. Mitrić, T. Stevanović, D. Janaćković and V. Miškovićstanković, J. Phys. Chem. B, 2012, 117, 1633–1643 CrossRef PubMed
.
- H. Lee, S. M. Dellatore, W. M. Miller and P. B. Messersmith, Science, 2007, 318, 426–430 CrossRef CAS PubMed
.
- S. Hong, Y. S. Na, S. Choi, I. T. Song, W. Y. Kim and H. Lee, Adv. Funct. Mater., 2012, 22, 4711–4717 CrossRef CAS
.
- L. P. Zhu, J. H. Jiang, B. K. Zhu and Y. Y. Xu, Colloids Surf., B, 2011, 86, 111–118 CrossRef CAS PubMed
.
- C. Xie, X. Lu, K. Wang, H. Yuan, L. Fang, X. Zheng, C. Chan, F. Ren and C. Zhao, ACS Biomater. Sci. Eng., 2016, 2, 920–928 CrossRef CAS
.
- L. Su, Y. Yu, Y. Zhao, F. Liang and X. Zhang, Sci. Rep., 2016, 6, 24420 CrossRef CAS PubMed
.
- N. M. Zain, R. Hussain and M. R. A. Kadir, Appl. Surf. Sci., 2014, 322, 169–176 CrossRef CAS
.
- H. Wang, Y. Li, Y. Zuo, J. Li, S. Ma and L. Cheng, Biomaterials, 2007, 28, 3338–3348 CrossRef CAS PubMed
.
- Y. H. Yang, C. H. Liu, Y. H. Liang, F. H. Lin and K. C. W. Wu, J. Phys. Chem. B, 2013, 1, 2447–2450 CAS
.
- B. P. Bastakoti, Y. C. Hsu, S. H. Liao, K. C. Wu, M. Inoue, S. Yusa, K. Nakashima and Y. Yamauchi, Chem.–Asian J., 2013, 8, 1301–1305 CrossRef CAS PubMed
.
- B. P. Bastakoti, M. Inuoe, S. Yusa, S. H. Liao, K. C. Wu, K. Nakashima and Y. Yamauchi, Chem. Commun., 2012, 48, 6532–6534 RSC
.
- Y. H. Liang, C. H. Liu, S. H. Liao, Y. Y. Lin, H. W. Tang, S. Y. Liu, I. Lai and K. C. W. Wu, ACS Appl. Mater. Interfaces, 2015, 4, 6720–6727 Search PubMed
.
- M. E. Lynge, d. W. R. Van, A. Postma and B. Städler, Nanoscale, 2011, 3, 4916–4928 RSC
.
- C. Wu, P. Han, X. Liu, M. Xu, T. Tian, J. Chang and Y. Xiao, Acta Biomater., 2014, 10, 428–438 CrossRef CAS PubMed
.
- V. S. Chandra, G. Baskar, R. V. Suganthi, K. Elayaraja, M. I. A. Joshy, W. S. Beaula, R. Mythili, G. Venkatraman and S. N. Kalkura, ACS Appl. Mater. Interfaces, 2012, 4, 1200–1210 Search PubMed
.
- T. Lan, Z. Q. Shao, J. Q. Wang and M. J. Gu, Chem. Eng. J., 2015, 260, 818–825 CrossRef CAS
.
- F. Bernsmann, B. Frisch, C. Ringwald and V. Ball, J. Colloid Interface Sci., 2010, 344, 54–60 CrossRef CAS PubMed
.
- Z. Y. Xi, Y. Y. Xu, L. P. Zhu, Y. Wang and B. K. Zhu, J. Membr. Sci., 2009, 327, 244–253 CrossRef CAS
.
- M. Sadat-Shojai, M. Atai, A. Nodehi and L. N. Khanlar, Dent. Mater., 2010, 26, 471–482 CrossRef CAS PubMed
.
- J. Chen, Y. Li, L. Huang, N. Jia, C. Li and G. Shi, Adv. Mater., 2015, 27, 3654–3660 CrossRef CAS PubMed
.
- O. Akhavan and E. Ghaderi, Carbon, 2012, 50, 1853–1860 CrossRef CAS
.
- H. S. Han, H. K. Lee, J. M. You, H. Jeong and S. Jeon, Sens. Actuators, B, 2014, 190, 886–895 CrossRef CAS
.
- X. Hong, S. Xue, M. Hui, Y. Lv, L. Zhang and Z. Mao, Appl. Surf. Sci., 2011, 257, 6799–6803 CrossRef
.
- J. Chen, B. Yao, C. Li and G. Shi, Carbon, 2013, 64, 225–229 CrossRef CAS
.
- D. Yang, A. Velamakanni, G. Bozoklu, S. Park, M. Stoller, R. D. Piner, S. Stankovich, I. Jung, D. A. Field and C. A. Ventrice Jr, Carbon, 2009, 47, 145–152 CrossRef CAS
.
- S. Saidin, P. Chevallier, M. R. Abdul Kadir, H. Hermawan and D. Mantovani, Mater. Sci. Eng., C, 2013, 33, 4715–4724 CrossRef CAS PubMed
.
- Z. Q. Yao, Y. Ivanisenko, T. Diemant, A. Caron, A. Chuvilin, J. Z. Jiang, R. Z. Valiev, M. Qi and H. J. Fecht, Acta Biomater., 2010, 6, 2816–2825 CrossRef CAS PubMed
.
- J. Liebscher, R. Mrówczyński, H. A. Scheidt, C. Filip, N. D. Hădade, R. Turcu, A. Bende and S. Beck, Langmuir, 2013, 29, 10539–10548 CrossRef CAS PubMed
.
- G. Lawrie, I. Keen, B. Drew, A. Chandlertemple, L. Rintoul, P. Fredericks and L. Grøndahl, Biomacromolecules, 2007, 8, 2533–2541 CrossRef CAS PubMed
.
- W. H. Song, Y. K. Jun, Y. Han and S. H. Hong, Biomaterials, 2004, 25, 3341–3349 CrossRef CAS PubMed
.
- J. Liu and R. H. Hurt, Environ. Sci. Technol., 2015, 44, 2169–2175 CrossRef PubMed
.
- I. V. Sukhorukova, A. N. Sheveyko, N. V. Shvindina, E. A. Denisenko, S. G. Ignatov and D. Shtansky, ACS Appl. Mater. Interfaces, 2017, 9, 4259–4271 CAS
.
- L. Convert, V. Chabot, P. J. Zermatten, R. Hamel Jr, J. P. Cloarec, R. Lecomte, V. Aimez and P. G. Charette, Sens. Actuators, B, 2012, 173, 447–454 CrossRef CAS
.
- J. P. Singhal and A. R. Ray, Biomaterials, 2002, 23, 1139–1145 CrossRef CAS PubMed
.
Footnote |
| † Electronic supplementary information (ESI) available. See DOI: 10.1039/c7ra03494f |
| This journal is © The Royal Society of Chemistry 2017 |

